![]()
![]()
![]()
6.1 The main areas
6.2 The equatorial system
6.3 Domes
6.4 Upwellings in the Indian Ocean and Indonesian region, including the South China Sea
In this section the upwelling areas are examined in more detail. The first subsection covers the main areas of upwelling in the eastern boundary currents. The second examines the equatorial systems. The domes are treated in the third. In the fourth are grouped all the upwellings in the Indian Ocean and Indonesian area, because they are dominated by the monsoon system.
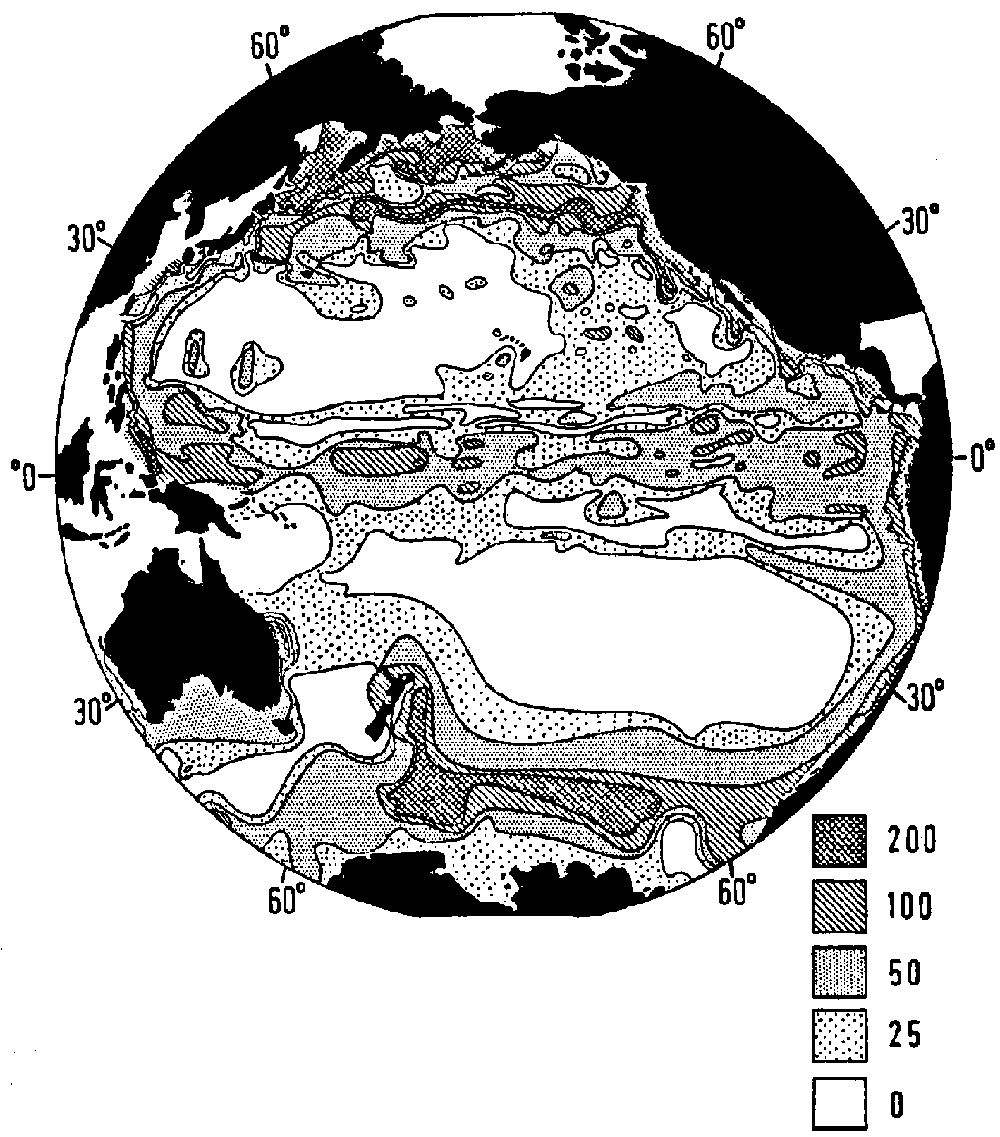
The U.S. Navy Hydrographic Office Publication 225 (1944), the World Atlas of Sea Surface Temperatures, gives charts by months. From them each upwelling area can be identified, and its length and width for each season can be estimated. For each area relevant publications are also used, but the main reliance on the U.S. Navy Hydrographic Office Publication 225 ensures that the upwelling areas are all treated in the same way. Atlases of wind strength and direction were also used, particularly to pinpoint the peak season and its position (U.K. Meteorological Office, Air Ministry, 1957).
There are four main upwelling areas - on the west coasts of North and South America and of North and South Africa. There should be one off the west coast of Australia, but it appears to be limited to the northwest coast for a short period. In Table I the four main areas are split into sub-areas by seasons. The length of each is given from the published data. The width of the productive strip is defined above.
MAIN UPWELLINGS
West coast of North America
California Current
|
|
Season (a) |
Length (km) |
Width (km) |
Area (km²) |
|
1. Baja California to Point Conception |
FMAMJJ |
880 |
190 |
169.103 |
|
2. Point Conception to Cape Mendocino |
AMJJAS |
560 |
190 |
106.103 |
|
3. Cape Mendocino to Cape Flattery |
MJJASO |
800 |
290 |
230.103 |
Note (a) Underlining donates the main season
In addition to the U.S. Navy Hydrographic Office Publication 225, full descriptions of the California Current are given in Sverdrup (1938), Yoshida (1955), Reid, Roden and Wyllie (1958), Wooster and Reid (1963), Stefansson and Richards (1964) and in the California, Department of Fish and Game Progress Reports 1953 and 1958. The countercurrent below 200 m, the inshore current, the northward seasonal shift, the generation of large swirls and the intermittent character of upwelling are all described in these papers.
West coast of South America
Peru Current
|
|
Season |
Length (km) |
Width (km) |
Area (km²) |
|
1. Cape Blanco to 10°S |
FMAMJJASO |
720 |
400 |
288.103 |
|
2. 10°S to Arica |
FMAMJJASO |
1300 |
170 |
191.103 |
|
3. Antofagasta to Cape Carranza |
DJFMAMJJ |
1500 |
250 |
375.103 |
|
4. Cape Carranza to 45°S |
ASONDJFM |
1000 |
150 |
150.103 |
Note (a) Underlining donates the main season
The first full description of the upwelling system off South America was given in Gunther (1963); here the countercurrent below 200 m and the inshore countercurrent were described, together with the seasonal and coastal patterns of upwelling. Posner (1957) described the phenomenon known as El Niño and made some estimates of ascending velocity. Schaefer, Bishop and Howard (1958) showed that the zone of biological production extended far to seaward particularly in the Peru oceanic current. Bjerknes (1961) in his study of the El Niño phenomenon described the whole system including the equatorial divergences. Wyrtki (1966) summarized much of the data and generalized the current structure.
Wooster and Reid (1963), from their Ekman transport values normal to the coast, showed that the winter upwelling off Peru was the most intense. This is borne out by the wind distributions, the wind blowing parallel to the coast at this time. But, as will be shown below, the production at this time is not the heaviest. From Gunther's work and from Wooster and Reid, there appears to be a break in the upwelling system between Southern Peru and Antofagasta in Chile. This may be an effect of the changed angle of the wind to the coastline.
West coast of North Africa
Canaries Current
|
|
Season |
Length (km) |
Width (km) |
Area (km²) |
|
1. Freetown to Dakar |
ONDJF |
800 |
50 |
40.103 |
|
2. Dakar to Cap Blanc |
ONDJFMA |
700 |
150 |
105.103 |
|
3. Cap Blanc to Canaries |
AMJJAS |
1020 |
300 |
306.103 |
|
4. Canaries to Casablanca |
AMJJAS |
1000 |
150 |
150.103 |
|
5. Cap St. Vincent to Vigo |
JJASO |
600 |
150 |
90.103 |
The Canary upwelling is not so well known. The charts of surface temperature (U.S. Navy Hydrographic Office Publication 225) are reinforced by the work of Furnestin (1959) between Cap Jubi and north of Casablanca. Quarterly cruises and a few sections show upwelling to some extent in the whole area in summer, but concentrated between Cap Ghir and Mazagan. A further upwelling appears late, north of Casablanca. The region between Freetown and Dakar has been examined by Berrit (1958, 1961, 1962) who shows the shift with season from Cap Vergas northwards as winter gives way to spring. Jones and Folkard (1968) have published sections of the whole current, showing the upwelling zone to be limited to the upper 200 m. A remarkable point from their sections is the obviously slow rate of mixture in various properties, the upwelling tongue bending downwards to seaward.
West coast of South Africa
Benguela Current
|
|
Season |
Length (km) |
Width (km) |
Area (km²) |
|
1. Pointe Noire to Porto Amboin |
FMA |
700 |
50 |
35.103 |
|
2. Baia dos Tigros to Walvis Bay |
DJFMAMJJ |
800 |
300 |
240.103 |
|
3. Walvis Bay to Orange River |
SONDJFMAMJJA |
700 |
300 |
210.103 |
|
4. Orange River to Cape of Good Hope |
SONDJFHA |
700 |
220 |
144.103 |
The upwelling area in the Benguela Current was first described fully by Defant (1936). Hart and Currie (1960) published the first specific work on upwelling. They showed the seasonal shift southward, which can be linked with the winter upwelling much further north between Point Noire and Amboin (Figure 14) (Berritt, 1961, 1962). They also suggested that a countercurrent was present and described the "roller bearing" of convergence and divergence about 100 km offshore. The season and length of the upwelling area is taken from the U.S. Navy Hydrographic Office Publication 225. Darbyshire (1953) and Buys (1959) have given charts of surface temperature also and Darbyshire described the system of upwelling. Copenhagen (1953) showed where the points of upwelling were along the coast between Cabo Frio and the Orange River, together with some points off Cape Province. In general it is a long persistent upwelling in the centre, shorter to the south and to the north. The seasonal cycle, although present, is rather hard to distinguish because of the long persistence in the central region.
At the equator the north and south equatorial gyres meet, forming a westbound North Equatorial Current (at 10°-20°N in the Pacific) and westbound South Equatorial Current (at 5°N to 10°S in the Pacific). Between the two equatorial currents runs an eastbound Equatorial Countercurrent (at 5°-10°N in the Pacific), the strength of which varies with season. In the Pacific the seasonal strengths are:
|
|
North Equatorial Current |
Countercurrent |
South Equatorial Current |
|
September to January |
weak |
weak |
strong |
|
February to April |
strong |
None |
weak |
|
May to July |
strong |
strong |
weak |
|
July, August |
weak |
strong |
strong (Knauss, 1963) |
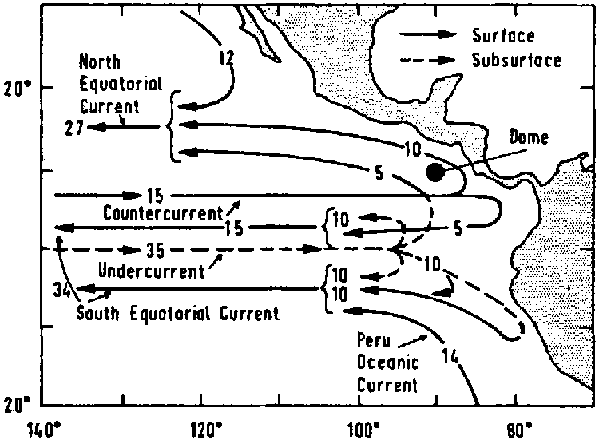
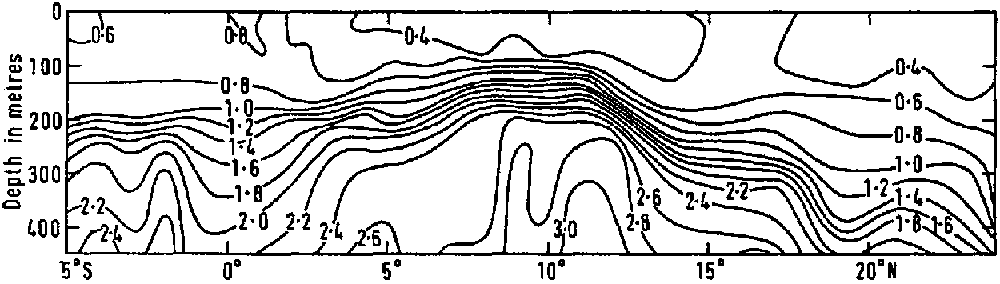
At the equator beneath the South Equatorial Current runs the eastbound undercurrent, or Cromwell Current, which originates roughly in mid-ocean. In the western ocean two undercurrents may appear beneath the two equatorial currents (for example the Lomonosov Current under the South Atlantic Equatorial current). Figure 10 shows how the currents are resolved in the eastern tropical Pacific (Wyrtki, 1966); notable is the great width of the system and the structural connection to the California and Peru Currents. There is an area of offshore divergence spreading from the upwelling areas to the equatorial currents. The Peru Oceanic Current is a good example of this effect (Wyrtki, 1966). In the equatorial complex shown in Figure 10, the two equatorial currents tend to generate divergences and the Countercurrent convergences.
Figure 10. Currents in the Eastern Tropical Pacific during the period June to December (Wyrtki, 1966); the figures represent transports in cm³ 1012/sec
Beneath the Cromwell Undercurrent, at the equator, radiolarian skeletons are deposited in relatively dense quantities (Arrhenius, 1963). There is a productive zone, narrowly confined to the region of the Undercurrent, which is more productive than the divergences of the South Equatorial Current near the equator. The same point is made in Figure 15 showing the distribution of radiocarbon observations, a narrow productive band at the equator in the eastern ocean above the Cromwell Undercurrent.
Figure 11 shows the distribution of zooplankton in the upper 150 m in the Pacific (Reid, 1962b). Not only are the divergences round both subtropical gyres well shown, but both coastal upwelling areas off California and off Peru. But more remarkable is the wide band of zooplankton at the equator; the eastern dense patches coincide with zones of divergence in the South Equatorial Current and the North Equatorial Current. A similar picture of phosphorus at the surface shows an eastern distribution centred about the undercurrent and its connection with the Peru Current. That of phosphorus at 100 m shows the distribution of the North and South Equatorial Currents with the barren Countercurrent between them. Between the Countercurrent and the North Equatorial Current lies a zone of convergence in the northern summer.
Figure 12 gives the distribution of divergence and convergence in the Pacific in the northern winter and the northern summer. There are extensive areas of divergence in both seasons at the roots of the North Equatorial and South Equatorial Currents. In the northern summer there is convergence all along the Countercurrent, with intermittent divergences along the South Equatorial Current. In the northern winter there are divergences where the Countercurrent is weak or non-existent, particularly in the eastern part of the ocean.
Figure 12 (a). Distributions of divergence and convergence, in kg/m³/sec, in the northern winter
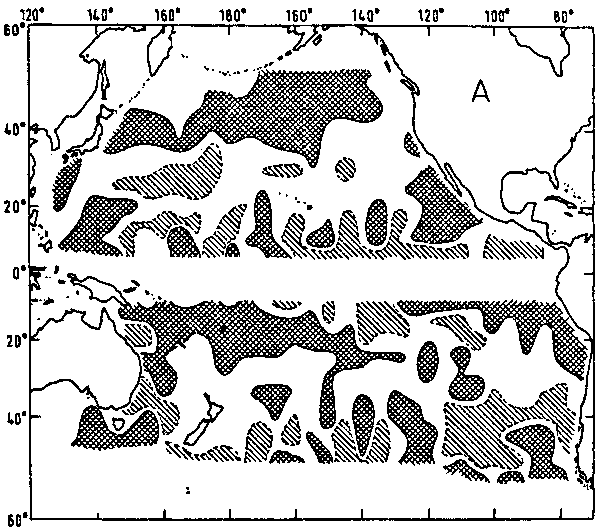
Figure 12 (b). Distributions of divergence and convergence, in kg/m³/sec, in the northern summer
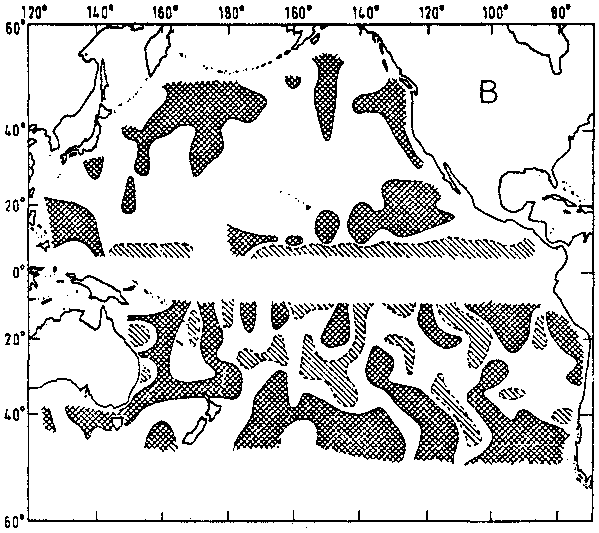
(after Hidaka and Ogawa, 1958); the cross-hatched areas are divergences and the diagonally shaded ones are convergences
Areas of divergence are difficult to define in such a complex system and so no detailed estimate has been made. However, the area of the equatorial system is large, 10° wide (across the equator), and excluding the Countercurrent, 115° long in the Pacific, 50° in the Atlantic and 50° in the Indian Ocean. The high season of divergence is in the northern summer in the North Equatorial Current and in the southern summer in the South Equatorial Current, six months for the whole area.
The classic dome is the Costa Rica Dome at 7.5-9.0°N, 87-90°W (Wyrtki, 1964). It is most prominent when the Equatorial Countercurrent is strongest, in late summer and in autumn but it exists at all seasons, even in February and March when the Countercurrent appears to be absent. The Countercurrent turns north into the Costa Rican Coastal Current and then westward into the North Equatorial Current. The eddy gives rise to the dome and with the fluctuations in current strength, the shape changes and domelets may become split off. Figure 13 shows a section of the dome, in phosphorus (Cromwell, 1958). Upwelling is generated on the left flank of the anticyclonic flow and by a lateral transport across the dome (Wyrtki, 1964). Consequently there must be a sinking on the right of the flow, shown most prominently in a hollow south of the dome, as part of the Countercurrent turns south and then west into the South Equatorial Current.
Figure 13. Section of the Costa Rica Dome, in phosphorus (m g-atoms/l), (Cromwell, 1958)
Wyrtki (1962) has shown that the upwelling off Java and Sumbawa is a dome analogous to the Costa Rica Dome; there is an Indian Ocean Countercurrent, but it is more temporary than the Pacific one, because of the switch from one monsoon to the other. The dome off Java and Sumbawa lasts only from May to September during the southeast monsoon (a name given to the southeast trades in the Indonesian area).
In the eastern tropical Atlantic the domes are described by Mazeika (1967). From January to April, in the southern summer there is a dome off Angola, the Angola Dome. Similarly from July to September, in the northern summer, there is a dome southwest of Dakar, the Guinea Dome. It is formed as the Equatorial Countercurrent turns into the North Equatorial Current; in other words, it is an exact analogue of the Costa Rica Dome but is seasonal like the Sumbawa Dome presumably because the Equatorial Countercurrent in the Atlantic is less strong than that in the Pacific. The Angola Dome cannot be formed in the same way but it has a cyclonic circulation; perhaps it is generated by the turning of the Undercurrent into the South Equatorial Current.
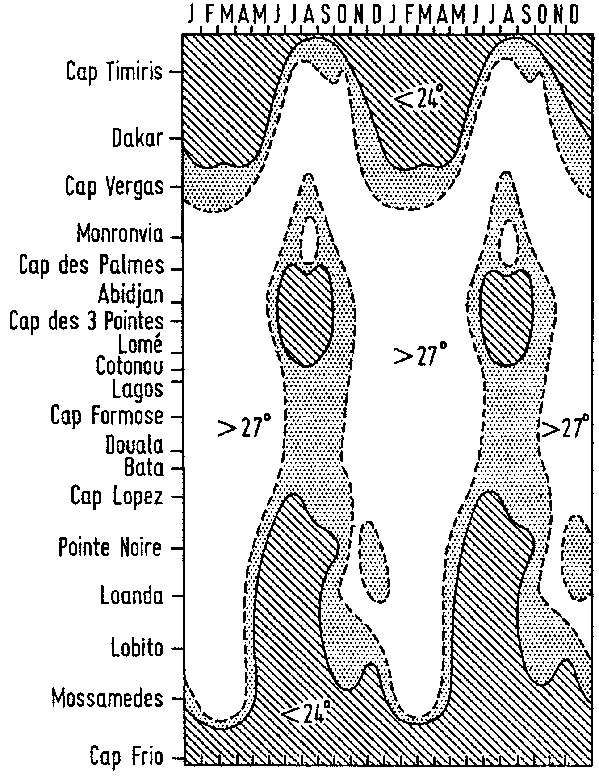
Mazeika also shows that there is a dome just south of the equator between 8°W and 3°E, which is a divergence generated by the easterly winds offshore from the upwelling area off Ghana and the Ivory Coast. Here there is a main period of upwelling from June to November between Cape Palmas and Cotonou; there is a temporary and local upwelling between the Sassandra River and Abidjan. It is associated with west south west winds parallel to the coasts from Cape Palmas and Cape Three Points (Berrit, 1961, 1962). Figure 14 shows the appearance of the Guinea upwelling by time and coastal position, as indicated by temperature differences; the interesting point is the connection between the main upwellings, the Canary and Benguela. That in the Benguela is really the Pointe Noire extension, when the Angola Done is absent much of the Benguela Current itself having turned westward at a higher latitude into the South Equatorial Current. Similarly, the Canary Current upwelling is present south of Dakar when the Guinea Dome is absent.
Figure 14. The timing and position of upwelling in the Guinea Current and in relation to the Canary and Benguela Currents (Berrit, 1962)
The area of the Costa Rica Dome is 1.5.105 km². That off Java is given as 3.105 km², taken from Wyrtki (1964). The Angola and Guinea Domes are possibly a little larger than that off Java. The area of the Guinea upwelling is set provisionally as 1.105 km², from the length of coastline (10°) and a distance offshore of 160 km (from the U.S. Navy Hydrographic Office Publication 225).
There are a number of upwellings associated, with the southwest monsoon, which blows from April to September. They are in the Somali Current, off southwest Arabia, and off the Malabar coast of India. That in the Somali Current is a geostrophic upwelling caused by the tilt in the thermal structure as the Current swings eastward away from the Horn of Africa (Warren, Stommel and Swallow, 1966; Swallow and Bruce, 1966). It is associated with the southwest monsoon only in the sense that the current flows during the period of the monsoon. Being a western boundary current it is associated with wind stress over the whole ocean as well as locally. The upwelling is limited to an area between Cape Guardafui, the eastern end of Socotra Island, 9.5°N, 54.5°E (in the latitude of Ras Mabber), and a point on the Somali coast which shifts with season. It is possible that the biological effects of the upwelling drift seawards in the swift current (Ryther et al., 1966). The areas of upwelling are roughly as follows, with season: -
|
|
Distance to Cape Guardafui (km) |
Area (km²) |
|
May |
375 |
94 x 103 |
|
June |
625 |
112 x 103 |
|
July |
625 |
112 x 103 |
|
August |
375 |
94 x 103 |
|
September |
375 |
94 x 103 |
|
October |
200 |
61 x 103 |
The sea surface temperature distributions by months are given in the U.S. Navy Hydrographic Office Publication 225. Further particular distributions are given by Swallow and Bruce (1966), Warren, Stommel and Swallow (1966), Stommel and Wooster (1965) and Foxton (1965). All the data are summarized for wind, surface temperature and salinity, nutrients and some biological observations in Wooster, Schaefer and Robinson (1967) for the northwest Indian Ocean. From the latter observations the southern boundary on the Somali coast was chartered by months, which explains the differences in area in the table above.
The work of Ryther et al. (1966) shows high carbon production in a wedge northwest of Madagascar and some patches on the African coast at the southern end of the Mozambique channel. The wedge northwest of Madagascar is presumably related to the divergence between the Somali and Agulhas currents (Ivanenkov and Gubin, 1960) as they split away from the two equatorial currents.
Off southwest Arabia there is a coastal upwelling induced by the southwest monsoon. The ocean-graphic data given in Wooster, Schaefer and Robinson (1967) show that upwelling ceases at the entrance of the Persian Gulf, but suggests a slight effect on the coasts of Baluchistan during the same period. This is supported by the work on primary productivity in the area during the Indian Ocean Expedition by the Anton Bruun (Ryther et al., 1966) showing intense production spreading across the Arabian Sea to the coasts off Pakistan. The cruise on H.M.S. OWEN shows upwelling and phytoplankton production in April and May off Karachi (Lee, 1963). The same survey shows a biological boundary much further to seaward than suggested by the oceanographic data quoted above, as might be expected. The areas are from Wooster, Schaefer and Robinson (1967):-
|
|
|
Length (km) |
Width (km) |
Area (km²) |
|
May |
As Salala - Ras al Hadd |
720 |
175 |
126 x 103 |
|
June |
As Salala - Ras al Hadd |
720 |
175 |
126 x 103 |
|
July |
Ras Fartak - Ras al Hadd |
920 |
175 |
161 x 103 |
|
August |
Mukalla - Ras al Hadd |
1240 |
175 |
217 x 103 |
|
September |
As Salala - Ras al Hadd |
720 |
150 |
126 x 103 |
|
October |
Marbat - Al Khalaf |
430 |
75 |
32 x 103 |
During the southwest monsoon a southerly current is generated, with a thermocline tilt along the Malabar coast of India. The upwelling is very shallow, originating, from perhaps 20 m (Darbyshire, 1967), but the surface water is as a consequence 6°C cooler. During July to October, low salinity water spreads over the surface from the rivers and it is at this period that the peak algal production occurs (Subramanyan and Sarma, 1965). During September and October, the post-monsoon period, there is a true wind-induced upwelling between Alleppey and Guilon, off Cochin, and a countercurrent is developed at 75-100 m (Rama Sastry and Myrland, 1959). The situation off the Malabar coast is complex and probably the production is quite high, as indicated by the presence of phosphatic deposits offshore (Tooms, 1967; see Figure 19). It is clear that upwelling extends from Trivandrum as far north as Panjim, but because of its nature and shallow origin reliable areas of upwelling cannot be estimated with the methods used in the other areas. It is possible that the extent of phosphatic deposits indicate the region of upwelling as well as any other method at the moment.
Banse (1968) has examined the upwelling system along the whole coast and shows that an oxygen deficiency can occur below the thermocline during the upwelling period; indeed catches of demersal fishes are reduced in zones of low oxygen tension (<2 ml/l).
In the Bay of Bengal upwelling has been detected off Walthair in February and March (LaFond, 1954); it probably extends up the coast to Sangor Island in June. Ganaparti and Murthy (1954) have described the circulation during this period in the Bay of Bengal. Under the southwest monsoon, upwelling probably occurs all along the coast of Orissa, parallel to the monsoon. The work of LaFond (1957) has shown a long coast of upwelling. An area has been estimated for this coast, based on the length of coastline and a distance of 200 km offshore.
Between December and February upwelling occurs in the Andaman Sea (LaFond, 1957; Wyrtki, 1961) in a rather limited area on the coast of Burma opposite the Andaman Islands. Upwelling also occurs in the shallow Gulf of Thailand, on the west coast in August and on the northeast coast in October and January; slight upwelling occurs all the year round at 12°N and 101°W. Off South Vietnam upwelling occurs during the summer monsoon between the central south Vietnamese coast at Nhatrang for some hundreds of miles up the coast (Wyrtki, 1961). Wyrtki also suggests that upwelling should be found in the Banda Seas, Flores Seas and in the east Arafura Sea, during the southeast monsoon.
Areas have been estimated for the Indonesian upwellings. Those off Java and northwest Australia are taken from the surface temperature distributions in Wyrtki (1964). Those in the Gulf of Thailand and off Vietnam are from the Naga expedition results (Wyrtki, 1961). Those in Flores, Banda and Arafura Seas are estimated from the sea area, in the absence of surface temperature observations showing upwelling, and are hence overestimated. Wyrtki bases his judgment on some sections, which have been used to make the estimate.
Minor upwellings
The Inter American Tropical Tuna Commission has studied a number of gulfs on the west coast of Central America in its search for live bait for tuna. Local upwelling has been found in the Gulf of Panama (Schaefer, Bishop and Howard 1958) and the Gulf of Venezuela (Redfield, 1955), in each case generated by offshore winds. Similarly Garner (1961) has described coastal upwellings off Cape Reinga and off the northeast coast of the South Island in New Zealand. Such areas will be found in other areas of the world when detailed study becomes possible.
![]()
![]()
![]()