


Changes in the stocks of dipterocarp forest resources were first computed through the development of physical accounts. For a given accounting year, the physical account in volume terms starts with an opening stock. Two types of transactions are included: (1) additions in the form of natural stand growth, and (2) reductions in the form of harvest, wastes, stand mortality, and forest conversion/deforestation. Man-made growth as in reforestation and plantation development is treated as a separate account. Growth and reforestation may be considered as investments while reductions as disinvestments.
Addition less reductions results in a net change in stock, which is added algebraically to the opening stock in order to estimate the closing stock for that year. Such end-of-the-year figure then becomes the opening stock of the next accounting year and the process continues until the end of the accounting period.
Depreciation (appreciation) was subsequently estimated using two approaches that draw primarily from the market values of derived products.
The most frequently used approach involves a two-step procedure that develops the physical (volume) accounts for an accounting period and covers previous and current years. The resulting change in resource stocks is then expressed in monetary terms through the net price method.
The rationale for this is that net price may be used to approximate the inter-temporal effect of scarcity on the welfare of various generations. The net price is used as a proxy for the marginal user cost: it is indicative of the foregone use by future generations who are left with fewer resources, and it also reflects the sacrifice that conservation-oriented, present-day users make for the sake of subsequent generations requirements.
Measuring scarcity costs is thus estimated through multiplying net prices with the physical depletion estimates. The net price is computed as the difference between unit price of the extractive resource products (on-site) less the marginal cost of production and a normal return to capital (or the profit and risk margin). For timber resources, the use off net prices where a normal return to the investment is also deducted as cost, yields stumpage values.
The method is convenient to use and has been applied in several country studies conducted under the auspices of the World Resources Institute (e.g. Repetto et al. 1989). When equilibrium exists in the market for natural resources (i.e. when the rate of increase of net price or stumpage value equals the return on alternative investments, or the market rate of interest), “depletion as measured by changes in the present value of the resource equals depletion as measured by the net price method” (Landefeld and Hines 1985:14). For this to happen, either the production has to be monopolistically controlled, or there must be perfect arbitrage among all capital of all forms worldwide.
The net price method does not require assumptions on patterns of depletion over time, or the service life of the asset. Existence of equilibrium in the product markets however, depends on the ability of the resource owner to participate in the market as well as on the competitiveness of markets.
The net price method has other weaknesses hence, the need to explore various methods for valuing natural resource depreciation. One of these weaknesses is imperfections in the market. Examples are:
monopoly, which implies that the net price is inclusive of monopoly rent and therefore tends to overvalue scarcity;
the absence of pseudo-forward market due to information bottlenecks;
institutional bottlenecks such as tenure insecurity, that limit the time horizon of resource users;
with public goods, non-mutually exclusive use, which means that rent is eventually dissipated as the resource is depleted - for most open access resources such as fisheries, the net price method is inappropriate for valuing fish stocks depletion; and
for small open economics, declining forest stock does not affect the global wood supply and price; thus, local scarcity is not reflected in the depreciation estimate.
The second more appropriate approach measures year-to-year changes in the physical resource stock’s asset value. This is done by estimating the stream of goods and services from resource stocks at the beginning of the year and at the end of the year. This means including those expected in the future, and necessitates prior estimates not only of the expected lifetime of the asset but also of the future prices. The physical accounts so derived are subsequently transformed into monetary terms either through the application of the usual stumpage values or by using prices (gross values). The stream of benefits and costs are subsequently computed in present value terms through the discounting process.
Figure 3
Net change in area for old-growth dipterocarp forests,
Philippines, 1970-1989
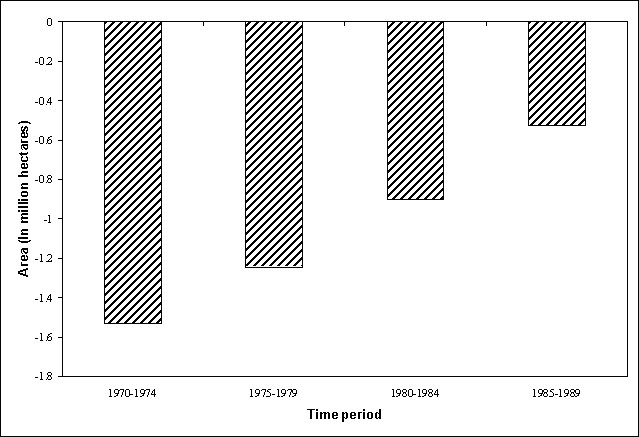
Old-growth forest opening area in 1970 of 5.2 million hectares was reduced by 81 percent to a closing area of 1.0 million hectares in 1989, or an average annual net decrease of 0.21 million hectares. Area reduction was due mainly to logging at an average rate of 130,000 hectares per year and forest conversion at a rate of 80,000 logging and 34 percent to forest conversion, on the average, during the 20 year-period. Old-growth forests have thus consistently declined, albeit at a decreasing rate, with much of the decline occurring during the early years of the accounting period (Figure 3).
Figure 4
Closing area:
old-growth and second-growth dipterocarp forests
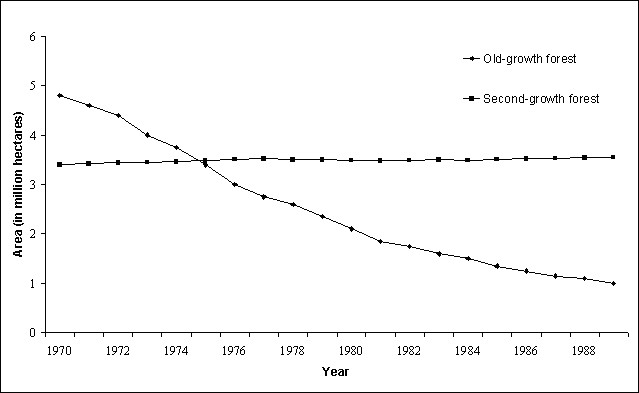
Second-growth forests result from the harvest of old-growth forests. The largest increases occurred in the early seventies and late eighties. However, since a significant portion of logged-over areas was converted to other uses, increase in second-growth forests area did not compensate for old-growth area reduction (Figure 4). The decline forests reached only 12.3 million CUM annually; net volume loss thus averaged at 40 million CUM/year.
The second approach used in estimating economic depreciation of dipterocarp forest resource, the asset value approach, looks into changes in the future stream of harvests. These are then converted into changes in the present value of stumpage at the beginning and at the end of each year; a social discount rate of 15 percent per annum was applied (NRAP I Technical Report No. 6 shows the details of such calculations).
Corresponding estimates amount to an average depreciation of PHP 1,427 million per year for old-growth dipterocarps on the one hand, and a lower depreciation of PHP 1,021 million annually for both old-growth and subsequent growth forests, on the other, as a consequence of appreciation from secondary forests (Table 11). Thus, the adjustments made on NNP averaged only –0.22 percent throughout the accounting period; this figure is many times less than the average adjustments of –6.2 percent implied by the net price method (IRG, Edgevale, Madecor 1991). When the index used for comparison is the forestry gross value added, the percentage is expectedly higher, averaging at 39 percent, resulting in an average net value added of PHP 2.4 billion only.
Table 11
Economic
depreciation estimates for dipterocarp forests asset value approach based on
stumpage values (in million pesos, at 1988 prices)
|
Year |
ti |
Old-Growth Forests |
Old-Growth and Subsequent Forests |
Gross Value Added in Forestry (GVAF) |
Percent on GVAF (OG+SG) |
Net Value |
|||
|
Vi |
Vi – Vi-1 |
Vi |
Vi – Vi-1 |
||||||
|
(1) |
(2) |
(3) |
(4) |
(5) |
(4) / (5) |
(4) + (5) |
|||
|
1975 |
0 |
37,327.60 |
n.a. |
38,684.90 |
n.a. |
1,244.20 |
n.a. |
1,244.20 |
|
|
1976 |
1 |
34,421.90 |
-2,905.70 |
35,982.80 |
-2,702.10 |
1,451.50 |
-186.2 |
-1,250.60 |
|
|
1977 |
2 |
33,150.60 |
-1,271.30 |
34,945.60 |
-1,037.20 |
1,643.00 |
-63.1 |
605.80 |
|
|
1978 |
3 |
32,268.20 |
-882.40 |
34,332.50 |
-613.20 |
2,080.40 |
-29.5 |
1,467.20 |
|
|
1979 |
4 |
30,754.50 |
-1,513.70 |
33,128.30 |
-1,204.10 |
2,248.10 |
-53.6 |
1,044.00 |
|
|
1980 |
5 |
29,126.80 |
-1,627.70 |
31,856.80 |
-1,271.60 |
2,961.40 |
-42.9 |
1,689.80 |
|
|
1981 |
6 |
27,559.20 |
-1,567.60 |
30,698.70 |
-1,158.10 |
2,701.40 |
-42.9 |
1,543.30 |
|
|
1982 |
7 |
25,700.50 |
-1,858.80 |
29,310.90 |
-1,387.80 |
3,228.40 |
-43.0 |
1,840.50 |
|
|
1983 |
8 |
23,937.10 |
-1,763.40 |
28,089.00 |
-1,221.80 |
3,311.80 |
-36.9 |
2,090.00 |
|
|
1984 |
9 |
22,624.30 |
-1,312.70 |
27,399.10 |
-689.90 |
5,447.10 |
-12.7 |
4,757.10 |
|
|
1985 |
10 |
19,823.00 |
-2,801.30 |
25,314.00 |
-2,085.10 |
4,771.60 |
-43.7 |
2,686.50 |
|
|
1986 |
11 |
18,530.60 |
-1,292.50 |
24,845.20 |
-468.80 |
4,336.40 |
-10.8 |
3,867.60 |
|
|
1987 |
12 |
17,032.40 |
-1,498.20 |
24,294.20 |
-551.00 |
4,790.10 |
-11.5 |
4,239.10 |
|
|
1988 |
13 |
15,052.40 |
-1,980.00 |
23,403.40 |
-890.70 |
5,762.40 |
-15.5 |
4,871.70 |
|
|
1989 |
14 |
13,361.00 |
-1,691.30 |
22,964.80 |
-438.60 |
4,892.80 |
-9.0 |
4,454.20 |
|
|
1992 |
15 |
|
|
|
-504.00 |
2,970.10 |
-17.0 |
2,466.10 |
|
|
Average |
|
25,378.00 |
-1,711.90 |
29,683.30 |
-1,081.60 |
3,365.00 |
-38.6 |
2,351.00 |
|
Notes:
| (1) Vi = | present value of future stream of benefits at year i (for old growth forests only) |
| (2) Vi - Vi-1= | present value of future stream of benefits at the end of the year minus present value at beginning of the year (for old growth forests only). Negative numbers imply depreciation, while positive ones mean appreciation. |
| (3) Vi= | present value of future stream of benefits at year i (for old growth and subsequent forests). |
| (4) Vi - Vi-1= | present value of future stream of benefits at the end of the year minus present value at beginning of the year (for old growth and subsequent forests). Post 1990 harvests are from residual forests, based on Forestry Master Plan estimates (1990). |
| (5) Source: | NSCB, Philippine Statistical Yearbook, 1990. Source: NRAP1 Main Report - Table 38; rebased to 1988 using IPIN for forestry |
Table 12
Depreciation
estimates for dipterocarp forests: ENRAP estimates (in million pesos, at 1988 prices)
|
Year |
(Depreciation) Appreciation |
|
|
Net Price Method |
Asset Value Method |
|
|
1975 |
(56,660.5) |
(3,602.0) |
|
1976 |
(38,372.3) |
(2,702.1) |
|
1977 |
(37,511.0) |
(1,037.2) |
|
1978 |
(40,435.7) |
(613.2) |
|
1979 |
(36,597.4) |
(1,204.1) |
|
1980 |
(44,581.8) |
(1,271.6) |
|
1981 |
(51,789.9) |
(1,158.1) |
|
1982 |
(40,003.6) |
(1,387.8) |
|
1983 |
(40,734.6) |
(1,221.8) |
|
1984 |
(35,111.9) |
(689.9) |
|
1985 |
(17,856.9) |
(2,085.1) |
|
1986 |
(14,869.1) |
(468.8) |
|
1987 |
(19,805.8) |
(551.0) |
|
1988 |
(15,631.0) |
(890.7) |
|
1989 |
(781.2) |
(438.6) |
|
1992 |
|
(504.0) |
|
Average |
(32,716.2) |
(1,239.1) |
| Source: | NRAP I (Table 37 & 38); rebased to 1988 using implicit price index for forestry. |
The difference (in results of the two approaches, as shown in Table 12) is caused by the inclusion of future timber harvests, the effect of continuously increasing the real values of stumpage well into the future insensitivity of net price method to the asset’s lifetime. The asset value approach in fact implies that in spite of a physical growth in subsequent forests and future increases in stumpage values.
An important distinction between the two approaches is the need to estimate the lifetime of forest stocks for implementing the asset value approach. The net price method does not require any estimate of the time when physical depletion is expected to occur at all.
In addition, the net price method tends to overestimate depreciation because it also captures monopoly rents. This is not true for the asset value approach, where the computations are based on changes in present values, thereby eliminating monopoly rents that may initially be included in the stumpage values.
The importance of unrecorded removals and wastage of timber resources cannot be understood. Table 13 shows an attempt to estimate such sources of depletion. One factor is under-reporting of log production that, based on estimates by Bautista (1990), amounts to about 50 percent of official log production on average. With such adjustments, an average annual volume harvest of 10 million CUM is implied. Despite this, about 26.2 million CUM of removals remain unaccounted.
A portion of such unrecorded removal may be attributed to unregulated fuelwood gathering, losses due to logging damage, and further adjustments for illegal logging. Based on the most conservative estimate of fuelwood consumption in 1988 of 0.56 CUM per capita at most, 2.89 million CUM is involved.
Table 13
- Implied data discrepancies,
various indicators (in million cubic meters)
|
Year |
Depletion estimates |
Recorded log production |
Trade adjusted log Production |
Corresponding harvest |
Unrecorded removals |
|
(A) |
(B) |
(C) |
(D) |
(A-D) |
|
|
1971 |
68.2 |
10.7 |
16.7 |
23.8 |
44.4 |
|
1980 |
42.4 |
6.4 |
8.3 |
11.8 |
30.5 |
|
1988 |
12.7 |
3.8 |
4 |
5.7 |
7 |
|
Average |
404.0 |
6.7 |
10.0 |
14.2 |
26.2 |
| Notes: | A. Based on ENRAP estimates, 12 December 1991. |
| B. Based on Philippine Forestry Statistics. | |
| C. Based on R.P. - Japan trade data discrepancy (Bautista, 1989). | |
| D. Computed as: (C) divided by 70% conversion efficiency. |
It is likely that the contribution to the economy by the forest land-based communities engaged in food production and fuelwood gathering is under-measured, because of their generally subsistence nature and the difficulty in including them in household surveys.
Table 14 shows an attempt at estimating the value of upland agriculture that does not enter into market transactions due to their subsistence nature. An annual change of PHP 43.4 million during 1980-1987 was estimated, assuming that non-marketed upland production values are approximately 10 to 20 percent of lowland production values. Computed subsistence upland food production of PHP 1.52 billion in 1987 plus the average annual change of PHP 43.4 million implies a total of PHP 1.6 billion worth of unrecorded upland production in 1988.
Table 14
Estimates of non-marketed upland production,
1980-1987
|
Crop type |
Year |
Total area |
Non-marketed production (at 1985 prices) |
|
|
in PHP/ha |
in million PHP |
|||
|
Plantation crops |
1980 |
462,625 |
586 |
271 |
|
1987 |
591,777 |
347 |
||
|
Annual Change |
18,450 |
|
11 |
|
|
Upland rice |
1980 |
247,000 |
1,737 |
429 |
|
1987 |
314,879 |
547 |
||
|
Annual Change |
9,697 |
|
17 |
|
|
Upland field crops |
1980 |
307,175 |
1,669 |
513 |
|
1987 |
373,344 |
623 |
||
|
Annual Change |
9,453 |
|
16 |
|
|
Total |
1980 |
1,016,800 |
n.a. |
1,213 |
|
1987 |
1,280,000 |
1,517 |
||
|
Annual Change |
37,600 |
|
43 |
|
With respect to fuelwood gathering, some indicators enable the estimation of subsistence wood production. The average time spent on household fuelwood collection is 7.4 hours per week, which translates into 48 person-days per year. Some 151 kilograms per week is gathered of which 41 percent (62.3 kg) is consumed by the gatherer-household. Assuming that such home consumption of fuelwood is not appropriately measured in the income accounts, an estimate of the value of fuelwood gathering for subsistence consumption may be made that is based on labour opportunity costs.
Applying the 41 percent (home consumption rate) to the labour opportunity cost of PHP 42 farm wage per day in 1988 translates into PHP 4.3 billion, assuming that 70 percent of the 10.5 million households in 1988 are fuelwood users, of which another 70 percent gather wood for free. The equivalent figure in 1985 is PHP 3.8 billion.
Adding up the two estimates of unrecorded household production of agriculture crops and fuelwood implies a total of PHP 5.4 billion worth of income from non-timber, forest land-based production that did not enter into the national income accounts in 1988. This large value resulting from a serious measurement problem in the national income accounts does not necessarily imply that conversion of forested land into other uses is warranted. Rather, the comparison of net benefits from such conversion needs to be made in incremental terms. Using rough comparisons based on averages, depreciation using the net price method implies a loss of PHP 5,700 per hectare; on the other hand, increase in upland cultivated area means additional value of only PHP 1,154 per hectare (computed as PHP 43.4 million/37,600 ha) of subsistence production and PHP 1,800 of fuelwood consumption (PHP3.8 billion /205,000 ha). A net loss of PHP 2,750 thus characterizes forest depletion in terms of on-site values of alternative forest land uses that involves various user groups.
Total wood removal however was more than what is implied by recorded and unrecorded log production, since considerable conversion of productive forests into other land uses occurred. Table 15 presents comparisons of the economic value from optimal timber harvest, actual depletion and recorded log production. Economic rent from optimal cuts should have averaged only PHP 17.6 billion; but actual depletion and forest land conversion resulted in an average rent of PHP 30.6 billion, or an excess of PHP 13 billion due to over cutting, forest conversion, and damage.
Much of these excess earnings were earned through unrecorded removals, and therefore untaxed activities. The large difference between economic rent from actual depletion and from official log production, averaging PHP 25.7 billion, signals considerable foregone earnings from this tax base.
Another source of revenue loss comes from foregone future timber from uncut old-growth forest and sec ondary forests. Based on optimum harvest rate simulations, an average of 14 million CUM per year would have been harvestable from old-growth forest during the remaining 20 years of its cutting cycle, and 12 million CUM annually from subsequent residual cutting cycles. On the other hand, the current picture is zero harvest from the remaining small area of old-growth forest (of less than 1.0 million hectares). In addition, projected harvest from well-managed, secondary forests under the current forestry Master Plan for example is expected to reach a lower 7.5 million CUM annually by the mid-1990s.
Table 15
Measures
of economic inefficiency from forest depletion (in billion pesos, at 1985 prices)
|
Period |
Annual Economic Rent Estimates |
Economic Inefficiency |
|||
|
Economic Cut |
Actual Depletion |
Log Production |
Excess Earnings |
Unrecorded Removal |
|
|
(A) |
(B) |
(C) |
(B-A) |
(B-C) |
|
|
1970-74 |
11.7 |
37.7 |
5.8 |
26.2 |
31.9 |
|
1975-79 |
14.4 |
36.2 |
5.7 |
21.8 |
31.5 |
|
1980-85 |
23.8 |
36.6 |
4.9 |
12.8 |
31.7 |
|
1985-89 |
20.5 |
11.9 |
3.2 |
-8.6 |
8.7 |
|
Average |
17.6 |
30.6 |
4.9 |
13.0 |
25.7 |
| Notes | A. Based on economic cut from 80% of 5.2 million ha old growth forest in 1969 permanently allocated for timber production. |
| B. Based on NRAP estimates of forest depletion, 12 December 1991. | |
| C. Based on Philippine Forestry Statistics Data. |
