Benthic diatoms are found in abundance along the seashore. The major species used as basic feed for abalone in Korea belong to the Navicula genus. These diatoms grow on the surface of stones and sand in shallow seashores, as well as plastic plates and other suitable objects. When benthic diatoms aggregate they tend to form colonies of a yellow-green color which gradually turns into yellow-brown as they grow. They are abundant in waters approximately 0.5 m deep. A variety of small diatom species tend to be a suitable food for young abalone. The ideal sites for collecting these diatoms are usually near the abalone culture areas.
Unwanted foreign substances encrusted on the plates and floats should be removed while leaving only the diatom layer. The diatoms are then carefully scraped off and place in a clean glass container or in a plastic bag filled with clean filtered seawater.
About 0.5 cm of bottom sand layer should be carefully collected from the sea bottom. The sand is then washed several times with a strong jet of seawater in order to detach the benthic diatoms. The diatoms are then collected in a fluid form.
The surface of gravel or bivalve shells are rubbed with gauze or padding. The diatom fluid is collected by washing the gauze or padding with a strong jet of clean seawater. The diatom fluid is then filtered through a 99 um-mesh size sieve, then through a 60 um-sieve and finally through a 20–30 um-sieve. Should the series of sieves not be available, the same result can be obtained by filtering the seawater initially through a 2-folded nylon cloth and then through a 20–30 um perforated nylon cloth.
Transparent polyethylene sheets measuring 30×30 cm are used as the settling structures for the collected diatoms. These plates are grouped into bundles of 10–20 sheets arranged at 3–5 cm intervals.
Such a structure is convenient to handle as well as for studying the sticking behaviour of the diatoms. In static water the diatoms sink and rapidly stick to the plates. As a result the plates should be placed into the diatom rearing tank at a sloping angle. The diatom rearing tank is then filled with clean filtered seawater into which the diatom starter is eventually poured. The diatoms have usually a density of more than 4000 cells/l, and 1 m3 of seawater should be inoculated with 20 litres of the diatom fluid. Within 24 hours the diatoms will have settled evenly over the plates, and if they do not fall apart when disturbed by slight splashing, the operation may be considered successful. At this stage the tank should be emptied and re-filled with clean seawater which will allow good light penetration and add the necessary nutritive salts. Following the above procedures the diatom culture is left to expand.
Benthic diatoms grow best at water temperatures between 21–25 °C, and can survive at temperatures as high as 30 °C. The low water temperature in early spring or autumn is sufficient for their growth in the rearing tanks, however propagation is very slow. When culturing diatoms in tanks, the water temperature should be 3 °C higher after changing the water so that propagation process is not affected.
Indoor diatom culture requires enough light to activate photosynthesis. Glass roofs and/or big side-wall windows fitted with curtains are needed in the culture rooms. The curtains are to prevent direct sunlight and to adjust the intensity as desired. Navicula spp. propagate fast at relatively strong light levels (1500–3500 lux). Artificial illumination (about 1500 lux) is necessary in the rainy season when natural sunlight is dim. The illuminating photoperiod time is usually 10–12 hours a day.
The salinity of seawater used in the cultivation of diatoms is around 30 °/oo. Inorganic salts, micro-elements and organic substances should be added into the rearing seawater at a certain proportion to accelerate growth. The concentration proportion of nutritive salts to be added is as follows:
N : P : Fe : Si = 10–25 : 1–2.5 : 0.1 : 1 ppm.
The nutrient salts used are NH4NO3, KH2PO4.3H2O, FeC6H5O3 3H2O, Na2SiO3.9H2O. Vitamin B12 is usually added at a concentration of 0.25 ug/l of seawater. The nutrients are added after changing of water in the early morning or in divided amounts 2–3 times throughout the morning. Following the addition of the nutritive liquid, the rearing seawater should be softly agitated to evenly disperse the nutrients.
Culture of diatoms demands regular changes of enriched seawater which is carried out once every 2–3 days. At high water temperatures, changes should be more frequent; once or twice daily. Diatoms reared under such condition can be fed to the young abalone after one week. Species with a comparatively fast growth rate can be fed to the juvenile abalone after 5 days, when cultured under appropriate conditions.
Naked-eye observation and microscopic examination of the cultured diatoms should be carried out daily. The distribution over the plates should be observed whether it is uniform or not, from the different colour shades.
The growth status of diatoms can also be judged from the change in cell colouration, cell density, degree of stickiness, etc. Healthy and normal cells are uniform in pigment, gradually turning from light yellow to dark yellow-brown and do not fall apart when the rearing water is agitated. Tiny air bubbles floating up the water column during midday hours is an indication of good health.
Lengthy culture periods are undesirable as the aging diatoms tend to fall apart in pieces. The colour gradually turns from yellow-brown to purplish-blue and large air bubbles tend to be trapped under the diatom layer floating up individually from time to time.
The diatom plates are hung in the upper layer of abalone culture tank on the second day of free-swimming stage after spawning. On the third day the larvae will settle on the plates and begin the benthic creeping stage, feeding on the diatoms. Optimum diatom density on the plates for larval growth is 3000 cells/mm2. If the density is low, more diatoms should be added into the rearing tank in order to increase the food level. Prior to adding diatoms, they should be decontaminated through filtration. In addition, sufficient light and the right amount of nutrient salts should be made available to enhance diatom growth.
The process of water purification in ponds, rivers, reservoirs or elsewhere is mainly a biological one carried out by microorganisms and/or unicellular green algae which absorb, assimilate and eliminate ammonia. What kind of system can be established in indoor ponds or recirculating units in which the micro-organisms and/or unicellular green algae are not found?
Generally rivers do not become contaminated under natural conditions, as they benefit from auto-purification. Polluted waters, due to sewage and other contaminants influx, gradually regain their original quality level as it flows downstream. This phenomena is attributable to the presence of micro-organisms attached on the surface of gravel, stones and other substrates. Bearing in mind the above natural process, a similar process can be reproduced in indoor and recirculating tanks to purify the rearing water.
In indoor tanks, the side walls, bottom and other rearing structure, all act as “purifiers”, while the filter medium in the recirculating tanks carries out the same function that sand and gravel achieves in rivers. The water quality in indoor rearing systems deteriorates due to the presence of excretions as well as unconsumed feed. The distance of water flow in rivers is equivalent to the staying time in indoor tank water or filter media.
The micro-organisms involved in water depuration may be grouped into several categories depending on their activity.
In aquaculture activities, the activity of oxidizing bacteria is considered to contribute significantly towards the quality of the rearing medium. Heterotrophic bacteria decompose and convert organic substances into their inorganic form, while nitrifying bacteria oxidize the ammonia produced either by the heterotrophic bacteria during the conversion of inorganic substances and/or excreted by the cultured organisms, into the low-toxic nitrate. The latter bacteria require oxygen as the oxidant agent. As a result of their bio-chemical activity they can be divided into ammonia-oxidizing bacteria which generate nitrous acid through the oxidation of ammonia, and nitrous-acid-oxidizing bacteria forming nitrate by oxidizing the nitrous acid.
In auto purification, anaerobic decomposition occurs through which inorganic substances are decomposed in the absence of oxygen. The bacteria involved in this process are known as “anaerobic bacteria”. These bacteria can be divided into two groups: facultative anaerobes which tolerate a wide range of oxygen concentration and compulsory anaerobes which will not develop when oxygen is present.
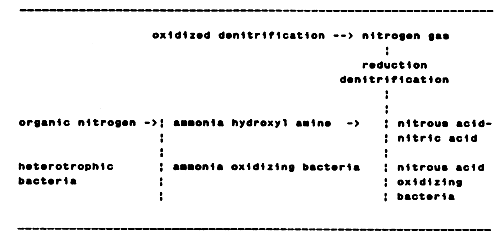
The reduction of nitrate is very important in anaerobic decomposition. Nitrate develops into nitrogen gas via the nitrous acid stage and this process is called “denitrification”. Denitrification also comprises a process of "oxidized denitrification, that is, the development of hydroxyl amine formed at the ammonia-oxidation stage into a nitrogen gas. Figure 1 describes the nitrification process carried out by the above-mentioned bacteria.
Figure 1. Nitrification of nitrogen
The intensity of purification is determined by the number of the bacteria and level of their activity. The filter media provides the growth substratum for the bacteria.
The main factors involved in the water purification process are the formation of bacteria on the filter media, a series of ecological factors which favour bacteria propagation, and the type of filter media.
The level of heterotrophic bacteria, whose nutrition source consist of organic substance, is usually high in newly-made filter tanks used for the purification of water. On the contrary, ammonia or nitrous acid oxidizing bacteria are scarcely found. At this stage, the accumulation of organic substances in the filter will induce a rapid increase in the number of heterotrophic bacteria. After about 7 days, the number of ammonia oxidizing bacteria will increase and nitrous acid will tend to accumulated in rearing water. The presence of nitrous acid then triggers of the prolification of the nitrous acid bacteria which will transform the nitrous acid into nitric acid.
At this stage the purification ability of the filter medium increases considerably. This initial series of events are usually referred to as the “maturation or activation of the filter medium”. At least a two-month period is required for the bacteria to develop in a stable fashion. The quality of the rearing water in the process is shown in Figure 2.
The disappearance of nitrous acid from the rearing water is usually used as a criteria for identifying the degree and maturity of the filter.
As shown in Figure 2, a satisfying level of bacteria formation and water quality stability usually occurs after 40–60 days from the initial activation of the filter. The period required for filter activation is not always the same as it is strongly related to the load of the filter media. Bacteria oxidation usually does not stabilizes before the complete maturation of the filter media. Therefore, an abrupt increase in their number may result in the deterioration of the water quality. It is therefore important to carefully regulate water volume, rearing density and the amount of feed administrated, so that the optimum load of the filter media is always maintained.
To estimate the number of bacteria in the filter medium, sand grains are placed at the bottom of a 70 l glass water tank and rearing conducted by the application of the circulating/filtration method.
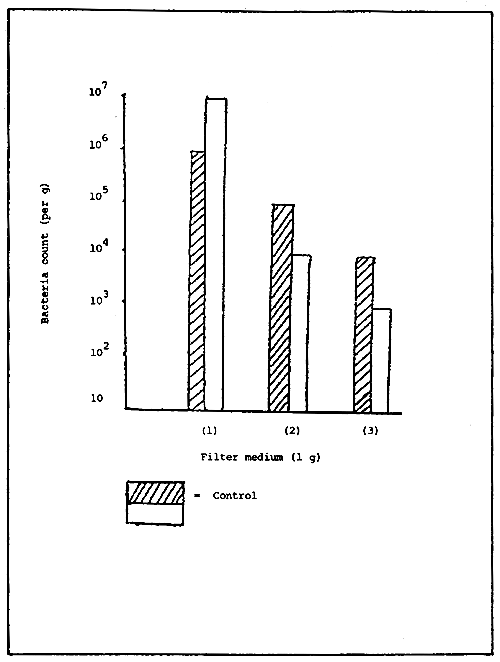
At this stage, the total number of heterotrophic bacteria is calculated and the following results have been obtained (Fig. 3): 10 total heterotrophic bacteria per g of filter media, and 105 ammonia oxidizing bacteria per g of filter media, and 104 nitrous acid oxidizing bacteria per g of filter media. The number of bacteria in a mature filter media vary according to the nature of the filter media itself. Infact the measured value is based on the unit weight and not unit surface area of the filter media. Therefore, the number of bacteria per gram in a sand-based filter will be higher than the number calculated from a stone-based filter, as the surface area per gram of filter media increase with particle of small diameter.
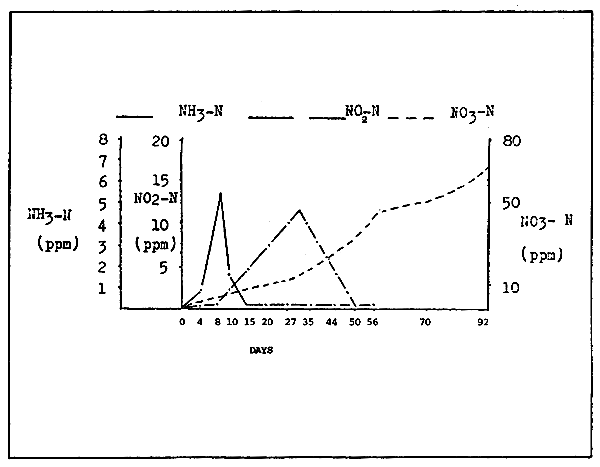
Figure 2. Rearing water quality variations during the process of filter activation.
Heterotrophic bacteria
Ammonia oxidizing bacteria
Nitrous acid oxidizing bacteria
Figure 3. Bacteria count per gram of filter medium.
A 50 cm long filter tank is used to investigate the number of bacteria at different layers of a filter media.
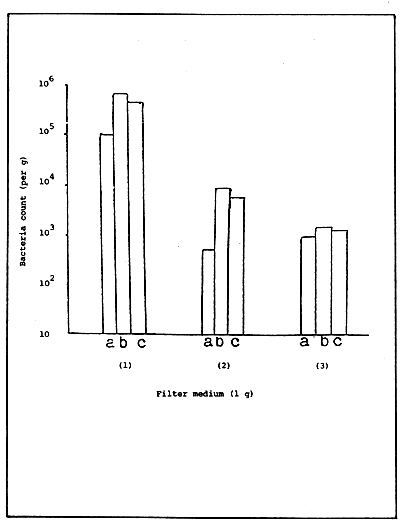
As shown in Figure 4 the upper and lower layers may contain almost the same number of bacteria and it has been shown that water purification is conducted in uniformity. However, the level of purification and the bacteria number will increased in the surface layer if composed of small particles such as sand grains.
A number of researchers in various countries have calculated the maximum value of bacteria per unit weight of a filter media (Table 1).
Table 1. Maximum number of bacteria per unit weight of filter media
| Filter media | Limitation value of bacteria (per g filtered media) | ||
| Limestone D=3.5 cm | Total heterotrophic bacteria | Ammonia oxidizing bacteria | Nitrous acid oxidizing bacteria |
| 10,000,000 | 100,000 | 10,000 | |
In the selection of filter media, it is important to know whether the quality and form of filter media is responsible for the number of the attaching bacteria.
As shown in Figure 5 the number of bacteria per unit surface area does not vary between different filter media. Therefore, the filter media of any quality can be used, unless harmful substance are releases into the water.
Bearing in mind that the number of bacteria is not dependent on the filter material used, a filter media with a large surface area per volume may be more desirable to one with a small one, as the number of bacteria is higher. The purifying ability of the filter media is not simply determined by the number of bacteria, but also on the activity of bacteria.
Heterotrophic bacteria
Ammonia oxidizing bacteria
Nitrous acid oxidizing bacteria
Figure 4. Bacteria count per gram of filter medium (a= top; b= middle; c= bottom layer).
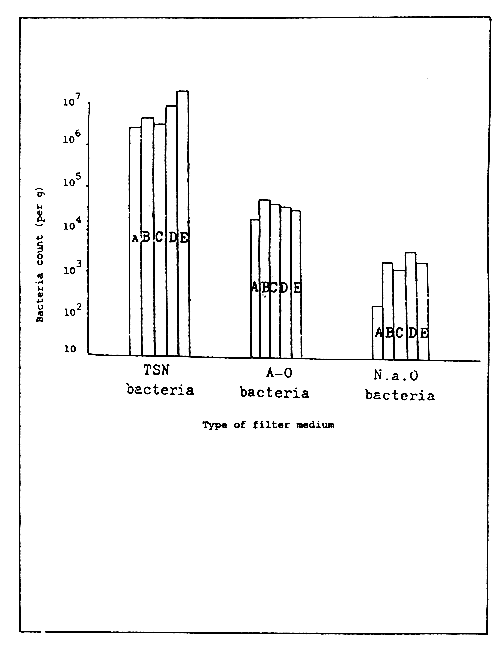
Limestone
Beehive shaped hexagonal column of vinyl chloride plate
Piled Saran fibre
Rough entanglement of yarn-shaped polyprofilyn
Compressed mesh-shaped polyethylene film
Figure 5. Relationship between type of filter medium and bacteria count.
Oxygen concentration. The activity of bacteria is dependent on the level of oxygen saturation, and therefore the rearing water has to be supplied with a sufficient level. Generally, nitrifying bacteria are mainly aerobic and therefore require a high oxygen supply. According to the results of research and experimental trials, the optimal volume of air blowing is 2–3 times the volume of circulating water. In this case, the concentration of oxygen should be in the range of 6–8 mg/l. The concentration of oxygen tend to increase when a proper contact is made between the circulating water and the filter media. The filter media with large surface area per volume is liable to clogging, which may decrease the activity of bacteria.
Water purification (i.e. ammonia oxidation) in the filter media is carried out by the active mud trapped between the spaces of the filter media particles. The active mud occupies one fortieth of total filter media. The daily oxidation of ammonia in the filter media is 0.5 mg ammonia per 1 ml of active mud. The above mentioned purification process is possible, only when sufficient levels of oxygen is supplied. The acquired filter media should be able to retain the mud effectively, which exist in gaps of filter media. A large quantity of mud tend to accumulate in filter media during filtration itself and it has to be regularly removed to maintain the efficiency of water purification. The frequency of mud removal depends on water quality of a given area, however it is normally carried out once a year.
pH of rearing water. The pH is one of the water quality parameter in the circulating filter system that tends to vary with the accumulation of nitric acid. When a fully activated synthetic resin filter media is used in the rearing of eels at a density of 0.5 kg/m3, the pH will drop to about 5.5 in 5 day. Research findings show that the activity of nitric acidification bacteria will be highest when the pH value is 9 and lowers as the pH drops. The effects of pH on ammonia-oxidation, which has been investigated by a number of researchers, are shown in Table 2.
Table 2. Effects of pH on ammonia oxidation
| pH | 8.0 | 7.0 | 6.5 | 6.0 | 5.5 |
| Amount of ammonia removed (mg/m3) | 346 | 329 | 230 | 96 | 83 |
As shown in Table 2, the amount of ammonia-oxidized falls remarkably at pH values below 6.5 while the process nearly stops at pH values below 6.0. When limestone is used as the filter media, the falling of pH will be limited at 6.2 by the neutralization of limestone. On the contrary, the synthetic resin filter media has no neutralizing capacity and therefore the pH should be adjusted at about 6.5 to 7.0. The suggested amount of base to prevent the rearing water from acidification is given below.
The following relation may be established between acidification equivalent weight (AEW/day) and the amount of water supplied, and the input of base (F g/day) can be calculated from the formula below:
A = 0.92 F × 10-3
For example, the daily inputs of base per 1 kg of crude feed may be:
34 g of calcium hydroxide
26 g of caustic lime
77 g of sodium bicarbonate
If the moisture content is calculated as 70 % of crude feeds, the inputs of base per kg of dry feeds should be 113 g calcium hydroxide, 87 g caustic lime and 257 g by sodium bicarbonate.
Experimental trials have shown that all the bases mentioned above will have no ill effects on rearing of the abalone. It is acknowledged that the stability of neutralization can be fully ensured by calcium hydroxide. The accumulation of organic substances and nitrous acid in case of using sodium bicarbonate is also identified. It is very important to find the correct point of neutralization when such bases are used. For easy and correct operation, the method of suspending calcium hydroxide in a tank fitted with a stirrer is widely used. As the inputs of such bases may vary to the volume of water inlet or its alkalinity, the variation of pH should be measured at the spot to determine the correct inputs of base.
Comparative purifying efficiencies of several selected filter media are given in Table 3. This table shows the surface area per volume of each filter media and the water quality data collected at the last stages of the experiment. The purifying capacity of synthetic resin filter media differs according to the type used; for example types C, D and E tend to purify better than type A, and E with an overall higher performance.
Table 3. Purification ability of various filter media
| Filter media | A | B | C | D | E |
| m2/m3 * | 135 | 200 | 120 | 150 | 275 |
| Item | |||||
| pH | 6.1 | 6.04 | 6.6 | 7.3 | 6.72 |
| BOD (ppm) | 6.5 | 8.6 | 18.2 | 16.4 | 7.9 |
| COD (ppm) | 48.8 | 63.8 | 60.2 | 68.8 | 45.1 |
| NH3-N (ppm) | 24.6 | 10.7 | 2.37 | 55.2 | 0.42 |
| NO2-N (ppm) | 1.39 | 2.82 | 4.44 | 13.6 | 0.27 |
| NO3-N (ppm) | 245 | 153 | 210 | 144 | 231 |
| Hardness CaCO3 ppm | 894 | 332 | 895 | 533 | 970 |
| Alkalinity mg EW/l | 0.34 | 0.44 | 0.45 | 1.44 | 0.41 |
| Plankton level ppm | 14.7 | 15.3 | 4.0 | 9.3 | 7.5 |
* Surface area/volume
A = 3–5 cm limestone
B = beehive-shaped hexagonal column of vinyl chloride plate
C = piled Saran fibre
D = rough entanglement of yarn-shaped polyprofilyn (1–2 um)
E = compressed mesh-shaped polyethylene film
No difference occurs in the number of bacteria per unit surface area of the above filter media, however the one with the largest surface area per volume obviously has a larger amount of purifying bacteria.
No relation can be established between the surface area per volume and the purifying ability of various filter media. It is believed that the purifying ability of various filter media with the same surface area per volume differs according to the ratio of active mud involved in the filtration process. For example, in the column-shaped filter media B and the fibre filter media D, the active mud is mainly deposited at the bottom. As a result their overall purifying ability cannot be effectively calculated. On the contrary, the limestone filter media A and the synthetic resin filter media C and E have the capacity to retain the active mud between the gaps of filter media itself. The nitrification contribution of active mud should not be disregarded in the purifying ability of a filter medium. Therefore, the accumulation of mud to a degree that the gaps in the filter medium do not become clogged helps the water purification process. Considering all these factors, the synthetic resin filter media used for purifying rearing waters may have the shape of cracked stones with a 200–300 m2/m3 surface area per volume and an optimal gap ratio.
A synthetic resin filter media is known to have a greater purifying ability than cracked stones, thus its accurate purification level can be further identified. In a number of experiments, a mesh-shaped synthetic resin filter media has been used to calculate the maximum purifying ability. The water quality variations are investigated and the purifying ability identified by varying the amount of the filter media and feeding quantity.
As shown in Table 4 purification is best when the daily fish feeding rate is 1.6 kg and a filtering surface of 0.4 m3. In other words, one square metre of filter media can purify 4 kg of feeds. The rearing yields are given in Table 5.
When the purifying capacity of limestone and mesh-shaped synthetic resin filter media are compared, the former has a purifying capacity of 1.2–1.5 kg feeds per cubic meter of filter media while 4 kg for the latter one. This means that the purifying capacity of synthetic resin filter media is three times more than that of limestone.
A rearing unit fitted with a circulating water filtration unit can run efficiently, however the water quality may fluctuate depending on rearing procedures and environmental parameters. Figure 6 shows the level of ammonia, nitrite and nitrate and other parameters during the filtration period (continuous line). The dotted line indicates the accumulation of the above parameters due to the malfunction of the filtering unit.
If water “purification” is properly carried out, the BOD, ammonia and nitrite will not accumulate, while only nitrate and COD will. The increase in COD is an indication of a gradual accumulation of organic substances throughout a long rearing period. The increase in COD becomes apparent when the water in the filtration tank becomes orange in colour and frequent foaming occurs, particularly after 2 weeks of culture. If such event occurs, the organic load will exceed the purifying capacity of the filter, and a rapid increase in BOD and ammonia will occur, as the dotted lines indicate in Figure 6.
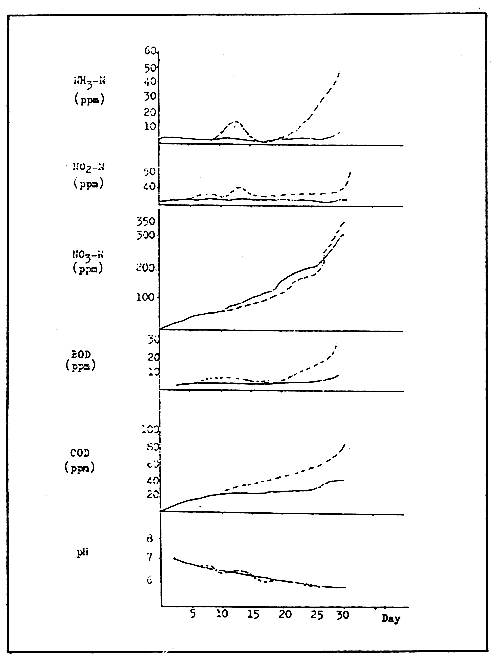
Figure 6. Water quality parameters during proper filtration (continuous line) and during malfunction of the filtering system (dotted line).
Table 4. Relation between the amount of filter media, feeding quantity and water quality at the end of the fish rearing stage.
| Test section | A | B | C |
| Amount of filter medium (m3) | 0.6 | 0.6 | 0.4 |
| Average Food supply (kg/day) | 1.4 | 1.8 | 1.6 |
| pH | 6.62 | 6.7 | 6.89 |
| BOD (ppm) | 11.1 | 3.9 | 10.2 |
| COD (ppm) | 54.8 | 59.8 | 47.5 |
| NH3+NH4+-N (ppm) | 0.41 | 0.37 | 0.39 |
| NO2-N (ppm) | 0.26 | 2.20 | 0.51 |
| NO3-N (ppm) | 273 | 343 | 336 |
| Hardness CaCO3 ppm | 1096 | 1446 | 1446 |
Table 5. Rearing yields of fish using different amounts of filter medium and daily feed input (Refer to Table 4).
| Test section | Start of culture | End of culture | ||||
| Filter type | ||||||
| A | B | C | A | B | C | |
| Number of fish | 683 | 1088 | 677 | 681 | 1083 | 669 |
| Total Weight (kg) | 56 | 99 | 84 | 86.1 | 131.1 | 119.7 |
| Ind. Weight (g) | 81.6 | 90.6 | 124.1 | 126.4 | 124 | 179.7 |
| Increase Weight (g) | 30.1 | 32.1 | 35.7 | |||
| Increase ratio (%) | 153 | 132 | 142 | |||
| Feed supplied (kg) | 42.5 | 50 | 56.1 | |||
| Feed efficiency (%) | 72 | 72.8 | 85.4 | |||
| Daily growth rate (%) | 1.46 | 1.12 | 1.09 | |||
| Daily feed intake (%) | 2.0 | 1.53 | 1.57 | |||
The permissible limits of chemical parameters are used as an indication for water quality deterioration in fish breeding. The permissible limits identified by some countries for ammonia is approximately 0.1 ppm and about 10 ppm for nitrite. Besides the control of water quality with respect to the above two parameters, attention should also be directed to the accumulation of nitrate and other organic substances. According to experiences made in rearing systems, the acceptable concentration may be 200 ppm for nitrate and 40 ppm for COD.
Filter tanks should be carefully designed and sized in order to efficiently handle waters from the rearing tanks of finfish and other aquatic organisms, over a given period of time. The bigger the filter tank, the more stable the water parameters in the breeding tank itself. However, in the culture of any aquatic organism the rearing equipment and facilities should be adequate in terms of their compatibility with the organisms and their economic feasibility. In order to design a filter tank, it is necessary to have a good understanding of the filtering capacity of the filter system, contamination and the quality of water used.
The norms may be decided based on the oxidation rate of ammonia in the filter media, therefore determining the purifying capacity of the system. In this respect, the amount of oxidation of nitrogen by bacteria in the filter media is 0.21 mg a day per 10 g of filter media, whereas the total daily nitrogen produced by 100 g of fish is 50 mg. Bearing this in mind, the quantity of filter medium required is 25 times (50/2.1) the weight of the fish being cultured (30 times to be on the safe side) in order to remove all of the nitrogen produced in the water. In other words, about 30 tons of filter medium are needed for breeding 1 ton of fish. If the ratio of filter medium is 2.7, the volume of sand would be about 11 m3. The gap rate of sand grains is about 50 % so that the volume will effectively be about 20 m3 when placed in a filter tank. However, since the filtering capacity of a filter medium varies depending on its surface, this norm is subject to variation according to the size of filter medium such as sand, broken stones, etc., compared to other media of the same weight.
When the rearing water flows through the filter tank, the level of dissolved oxygen will decrease due to bacteria oxidation in the filter medium. The level of oxygen consumption in the filter medium is calculated to determine the OCF (Oxygen Consumption Factor) to express the purifying capacity in the filter medium.
The depth of the sand bed, filtering rate and size of the sand grains, all of which affect the purifying capacity, have been studied in relation to the decrease of dissolved oxygen during the filtration process. As a result, the maximum purifying amount of any volume of a filter medium can be calculated by using the formula:

where:
| Ym | = | purifying amount of a filter tank of W m2/minute (OCF mg/min) |
| W | = | surface area of the filter medium (m2) |
| V | = | filtering velocity (cm/min) |
| D | = | depth of the sand bed (cm) |
| G | = | coefficient of sand diameter (110 times of the reciprocal of the sand diameter in mm) |
The above formula shows that the purifying capacity can be increased by enlarging the filter area rather than increasing the depth of the sand bed. Therefore, it is more effective to perform filtration uniformly in parallel than in serial.
On the other hand, the contamination of rearing water can be calculated from the load on the filter media (decrease of dissolved oxygen during filtration mg/min) when yellow porge is fed with mackerel flesh.
X = (B0.564 × 10-2) + 0.051 F
where:
| X | = | load on filter media (mg/min) |
| B | = | weight of yellow porge (g) |
| F | = | daily mean weight of mackerel flesh given (g) |
If the relation between the above Y and X is Y≥X, the purified amount and the amount of contamination are in equilibrium and rearing in this tank will perform well.
When rearing fish like eel which tend to produce considerable organic matter, it is better to consider the purifying amount in terms of DO consumption rather than the oxidation rate of ammonia. For this reason, the DO consumption of the filter medium (DO consumption by filtration multiplied by the amount of water in circulation) and change in ammonia level has been studied while rearing eels reared with different amount of feed. The DO consumption of the filter medium corresponds to the amount of the feed given (Fig. 7).
When 100 g of feed is given, about 1000 mg of DO is consumed per hour for purification, and when 150 g is given over 1700 mg of DO is consumed. Therefore, DO consumption increases with the increase in feed input. The load on the filter medium is affected more by the amount of feed than the number of fish cultured. However, when 200 g of feed is given, the consumption of DO in the filter medium is almost the same as when 150 g is given. Therefore it may be considered that the purifying capacity of the filter medium is almost at its limit when 150 g of feed is provided. At 200 g the load is greater than the purifying capacity of the filter. This may be ascertained by the fact that ammonia accumulates remarkably in the water in which 200 g of feed is given. Thus the amount of feed has a certain relation with DO consumption in the filter medium. If the above observations are true, the DO consumption can be roughly estimated based on the level of feed input.
As shown in Figure 8, feeding level has a proportionate relation with the DO consumption of the filter medium. About 1/90 DO (g) is consumed per hour in the filter medium to purify the contamination produced by the feed.
For example, if the DO consumption is about 11 g/hr, the water quality does not deteriorate when 1 kg of feed is provided a day. A filter tank in which DO is consumed at about 1/90 of any amount of feed per hour may be used for stable rearing for about one month. Therefore, the volume of the filter medium needed for the removal of contamination caused by any amount of feed can be calculated from the purifying capacity (DO consumption) per unit surface area of the filter medium.
Since the purifying action of a filter medium is carried out by the activity of bacteria on its surface, the purifying capacity is directly related to the surface area. Therefore, surface area is more important than the weight or volume of the filter medium. The DO consumption per unit area of the filter medium varies according to the amount of the circulating water through the filter tanks at any one time. The greater the volume the more DO is consumed in the filter medium. As shown in Figure 9, an inflection point appears between 12–24 1/min. Up to this point, the DO consumption of the filter medium rapidly increases with the increase of the circulating water; over this point, it increases more slowly. Therefore the optimum amount of circulating water for the purifying amount in this filter tank is 24 l/min.
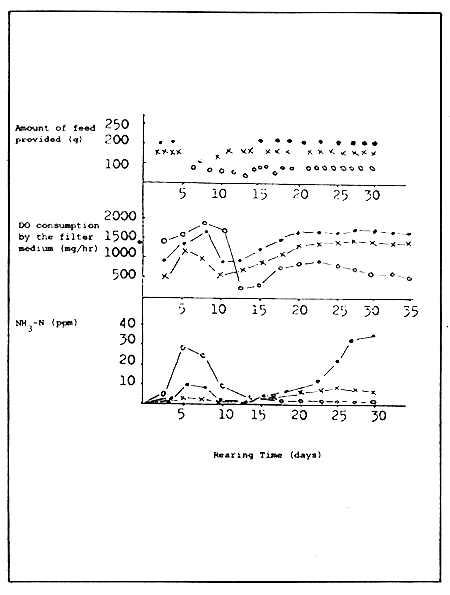
Figure 7. Dissolved Oxygen (DO) consumption by the filter medium and change in ammonia level in relation to the amount of feed provided.
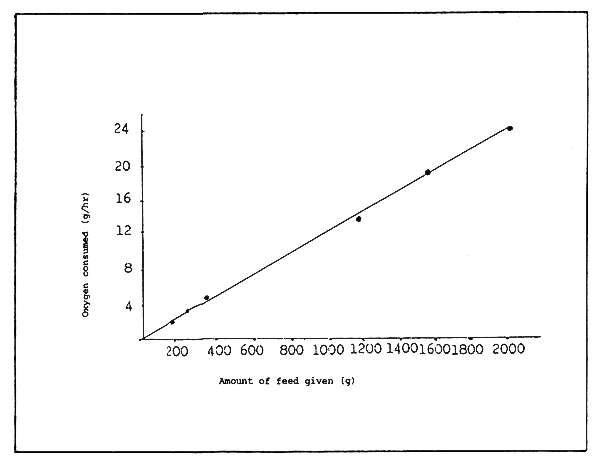
Figure 8. Relationship between the amount of feed provided (g) and dissolved oxygen (DO) consumption in the filter tank.
The purifying capacity is also related to the permanence time of the water in the filter medium. When the water circulation rate is 24 l/min, the permanence time is about 5 minutes. In this case, the DO consumption per cubic metre of filter medium 50 cm deep is approximately 80–90 mg/hr.
As shown in Figure 10, the more DO in the circulating water, the more oxygen consumption occurs in the filter medium. Since this result was from an experiment in the same filter tank, the difference could have been caused by the change in the activity of bacteria.
In extreme cases, the entire DO may be consumed during the filtration process. Since the purifying amount varies with the amount of DO, there is a difference between the upper and lower layers of the filter medium when the amount of DO decreases rapidly during filtration. On the contrary, less oxygen is consumed when the staying time is short, so that the whole filter bed takes part in filtration uniformly without causing differences in the amount between the upper and lower layers.
The relation between the depth of a filter medium and the purifying amount is an important factor in determining the type of the filter tank required. When the rearing seawater is treated through a sand bed 100 cm deep, the depth of sand bed through which half of the water volume was purified at different filtration rates and sand size, was calculated by applying the formula for determining the purifying amount: X = (B0.564 x 10-2) + 0.051 F.
As shown in Table 6, half of the entire volume of purified water was purified in the surface while the lower layer did not function due to low filtering velocity and small sand size. On the contrary, in case of high filtration velocity and large sand size, the whole filter bed uniformly takes part in the filtration process.
When rearing eels, in which the filter medium is usually of large size such as broken stone, the filtration rate is 10 cm/min and the depth of sand bed is 1 m. To make sure, the same load was taken on three filter tanks of the same volume, varying their respective depth to 25, 80, and 140 cm. The DO consumption was then measured.
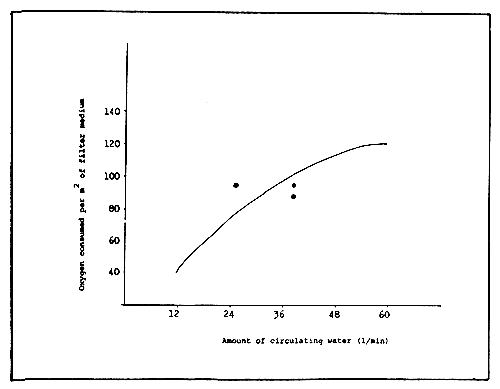
Figure 9. Relationship between the amount of circulating water (1/min) and oxygen consumed per unit area of the filter medium.
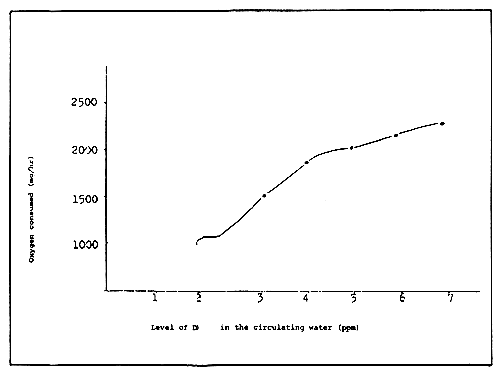
Figure 10. Relationship between the level of dissolved oxygen (DO) in the circulating water (ppm) and the amount consumed in the filter tank (mg/hr).
Table 6. The depth of sand bed through which half of the water volume was purified through a sand bed 100 cm deep
| Sand particle diameter (mm) | Filtering velocity (cm/min) | ||||
| 0.5 | 1.0 | 2.0 | 4.0 | 8.0 | |
| 10 | 29 | 36 | 42 | 46 | 48 |
| 5 | 20 | 29 | 36 | 42 | 46 |
| 2.5 | 13 | 20 | 29 | 36 | 42 |
| 1.25 | 11 | 13 | 20 | 29 | 36 |
| 0.625 | 4 | 11 | 13 | 20 | 29 |
As shown in Table 7, in case of a long permanence time of the culture water in the filter medium, the oxygen consumption is the same in any depth of the filter tank, but in case of short permanence time, the oxygen consumption is slightly less at 25 cm than at other depths. This implies that the depth of the filter bed should be maintained to a certain extent. In determining the type of a filter tank, the depth of the filter media should be considered.
Table 7. Relation between the depth of filter medium and DO consumption
| TIME (min) | Depth of filter medium (cm) | Filtering velocity (cm/min) | Oxygen consumed (mg/hr) |
| 2.2 | 25 | 11.3 | 1742 |
| 80 | 36 | 1904 | |
| 140 | 63.1 | 1904 | |
| 5 | 25 | 5 | 1491 |
| 80 | 16 | 1829 | |
| 140 | 28 | 1851 | |
| 10 | 25 | 2.5 | 1122 |
| 80 | 8 | 1177 | |
| 140 | 14 | 1174 |
About 2 % of the entire circulating water volume is reduced daily in a filter tank through evaporation, leakage, etc. which needs to be replaced daily. For effective use of water, new water should be added in as small quantity as possible and without affecting the purifying capacity or rearing yield. For this purpose the water quality of a rearing system was determined when fresh water was added at 2, 10, and 20 % daily. No water was added in the control (Table 8).
Table 8. Relation between input rate and water quality
| INLET RATE (%) | Parameters | ||||||
| pH | BOD (ppm) | COD (ppm) | NH3-N (ppm) | NO2-N (ppm) | NO3-N (ppm) | Hardness CaCO3 (ppm) | |
| 0% | 6.25 | 5.8 | 51.5 | 3.09 | 1.17 | 297 | 1166 |
| 2% | 6.50 | 4.3 | 47.8 | 13.6 | 1.88 | 243 | 940 |
| 10% | 6.94 | 6.1 | 26.7 | 17.6 | 1.06 | 118 | 391 |
| 20% | 6.91 | 12.5 | 17.3 | 8.25 | 0.56 | 59 | 218 |
At all input rates, the rearing system is not affected within a 35-day period. With regard to water quality, the fact that COD, NO3-N and hardness are in inverse proportion to the input volume, shows that water input has a great dilution effect. However, those parameters which do not accumulate under good filtration, such as BOD or ammonia, are hardly affected by the input level of fresh water.
Since a large volume of water is usually circulated, 2 % of the whole water volume is enough for input because the contamination load of the rearing water is treated in the filter tank before being diluted by the fresh input. In order to minimize the accumulation of COD or NO3-N and to stabilize the water quality, a 10 % input appears to be suitable.
Given the norms and filtering conditions for designing a filter tank, a filter tank for rearing 100 kg of eel for about a month, with a daily average input of 1.5 kg formulated feed can be designed. Limestones 3–5 cm in diameter are used as the filter medium. When 1.5 kg of feed is given, the amount of DO consumed for its treatment is 16.7 g per hour. If the staying time of water in the filter medium is assumed to be 5 minutes, the amount of DO consumed by 1 m2 surface area of filter media per hour is about 0.09 g. So if the amount of DO of the filter medium is put to 16.7 g/hr, 16.7 g/0.09 g = 186 m2 is the surface area needed. As 1 m3 surface area of broken stones that are 3–5 cm in diameter is 135 m2, the volume of filter medium corresponding to 186 m2 is 1.38 m3. If the stocking density of eel is 25 kg/m3, the water volume needed for rearing 100 kg is 4 m3. In these conditions, purification is smoothly performed when the volume of the filter medium amounts to 35 % of the rearing water, and it may be used for about a month without new water inlet. However, in rearing without new water inlet, there will be accumulation of COD or NH3-N although the purifying amount is enough. Thus new water inlet should be 10 % of the whole water volume. A filter bed with a depth of 50–100 cm is sufficient. If the depth is 70 cm, the above-mentioned 1.38 m3 of the filter media volume is 2 m2 in terms of filter tank area.
In case the water filters from the bottom upwards, there must be space of about 50 cm in the lower part of the filter bed. The total height of the filter tank should be two times the height of the filter media, i.e. about 1.4 m including the depth of the empty spaces. Therefore, a filter tank of about 2.8 m3 is needed. To maintain a permanence time of the water in the filter medium of about 5 minutes in the above tank, the level of circulating water should be 135 1/min and the water circulation rate should be once every 45 minutes. If the filtering conditions are determined to a certain extent, the size of the filter tank can be calculated easily on the basis of feeding quantity.
The efficiency of a design can be tested by studying the water quality change and rearing yield, while rearing 100 kg of eel in an experimentally designed water-circulation rearing system. The size of the experimental filter tank used in the test had the following characteristics:
The size of rearing tank was the following:
Other parameters:
After 30 days of rearing the food efficiency was 65 % and the daily growth rate was 0.85 % (Table 9).
Table 9. Result obtained in the rearing of eel in the tested filtering network
| START | number of fish | 1,082 |
| total mass | 100 kg | |
| mean body weight | 92.4 g | |
| END | number of fish | 1,072 |
| total mass | 129 kg | |
| mean body weight | 120.4 g | |
| number dead fish | 10 | |
| mass increase | 29 kg | |
| increase rate | 130 % | |
| feed intake | 45 kg | |
| feed efficiency | 65 % | |
| daily growth rate | 0.85 % | |
| daily feed intake rate | 1.3 % |
Table 10 shows there was no increase in BOD, ammonia and nitrate, and therefore water purification through this filter tank was enough for 1.5 kg of feed.
Table 10. Quality of rearing water at the end of the trial
| pH | BOD (ppm) | COD (ppm) | NH3-N (ppm) | NO2-N (ppm) | NO3-N (ppm) | alkalinity (ml/l) | hardness* (ppm) |
| 6.31 | 7.0 | 50.0 | 0.98 | 0.37 | 25.7 | 0.38 | 1,040 |
The hardness increased due to the calcium dissolving from the limestone filter medium, while pH and alkalinity dropped slightly.
The average DO consumption in the filter medium is about 17 g/hr per 1.5 kg of feed, being almost the same to the calculated value of 17.5 g/hr. The DO consumption of the filter media was greater than the amount of DO (13 g/hr) consumed by 130 kg of eel under stable conditions.
The results from this test shows that the filter tank design method described above is basically correct.
Standard values in water quality control
Biological management should be carried out in accordance with the standard values in water quality control. Contamination indices in biological management are: NH3-N, NO2-N, BOD, etc.
In addition to the above parameters, nitrites that tend to accumulate in the filters in high concentration and other organic matters that have difficulty in being biologically decomposed, should also be considered.
Table 11. shows the general tolerance limits in biological management.
Table 11. General tolerance limits in water quality control (ppm)
| Value / Indices | NH3-N | NO2-N | NO3-N | BOD | COD |
| Optimum value | <0.1 | <0.15 | <3.0 | 3–5 | 5–20 |
| Tolerance limit | 1.5 | 1.2 | 30.0 | 7–10 | 40 |
Small levels of ammonia in solution will react with Nessler reagent in the alkaline medium, to produce NH2Hg2OI which is a yellow compound.
2K2(HgI4) + NH3H2O + 3NaOH = NH2Hg2OI + 7NaI + 3H2O
Spectrophotometry is used since the color of the compound has a certain relation with the level of ammonia when the concentration of NH3-N ranges from 10–100 ug/l. This compound is reduced into the colloidal state and hardens gradually. As the NH4+ content increases, the color turns from yellow to reddish-brown and hardening speeds up. The Nessler reagent reacts not only with ammonium but also with free ammonia, to produce a colored compound.
30 % potassium sodium tartrate solution. Dissolve potassium sodium tartrate of normal purity in nitrogen-free distilled water to make a 15 % solution. Evaporate 50 % of the volume by heating the solution and get rid of ammonia in the reagent.
20 % NaOH solution. Prepare a 10 % solution with NaOH of normal purity. Heat the solution to evaporate half of its volume.
Nessler indicator. Dissolve 6 g HgCl2 in 50 ml ammonia-free distilled water and add KI solution (dissolve 7.4 g KI in ammonia-free distilled water) to sink it. Decant the solution and wash the precipitate 3 times with chilled ammonia-free distilled water. Add KI solution (dissolve 5 g KI in a small quantity of water) and NaOH (dissolve 20 g NaOH in a small quantity of water) to dilute the solution to 100 ml. Keep this solution in a dark place for 2–3 weeks and then siphon the clean liquid carefully out into a rubber-stopped brown bottle.
Ammonia-free seawater. Place in a beaker artificial seawater, the salinity of which is similar to that of the sample, and add some NaCO3 for alkalization. Evaporate the water to its former volume and add some HCl to remove the turbidity. Cool, and transfer to a well sealed clean container.
Standard solution of ammonium chloride. Dry NH4Cl of normal purity at 100 °C for an hour, weigh 3.280 g and dissolve it in a small quantity of distilled water. Transfer to a 1-litre capacity graduated flask, and dilute with ammonia-free distilled water and fix with 2 ml chloroform. This is the basic standard solution containing 1 mg of nitrogen. Dilute the solution 100 times to use as a standard solution for measuring the sample. The diluted standard solution contains 0.01 mg/ml of NH3-N. This solution may be preserved for a day or two.
Preparing a set of color standards. Place 0.04, 0.08, 0.16, 0.32, 0.40 ml of 100 times-diluted NH4Cl standard solution, respectively into different 50 ml graduated flasks and add 40 ml ammonia-free seawater and 1.25 ml 30 % potassium sodium tartrate solution and shake well. The concentrations of the color standards are 10, 20, 40, 60, 80 and 100 ug N/l.
In a second set of 50 ml graduated flasks, place 1.25 ml 30 % potassium sodium tartrate solution, moisten the inner walls of the flasks with the solution and add 5 ml 20 % NaOH solution. Shake and transfer the solution in the former flasks into the latter flasks. Shake well to avoid turbidity.
Then add 1 ml Nessler reagent and dilute with ammonia-free distilled water up to the top graduation. Five minutes later, transfer to the Nessler comparison tubes for colorimetry.
Measuring the sample. The same as preparing the color standards except the use of 40 ml ammonia-free distilled water instead of seawater.
Nitrite in the seawater reacts with para-amino benzol sulfonic acid a-naphthyl amine at a certain pH, to produce the scarlet color azo-dye. The concentration of NO2 is recorded by the intensity of the azo-dye color. The appearance of azo-dye undergoes two stages; first, nitrous acid reacts with para-amino benzol sulfonic acid producing diazo-compound and then in combination with a-naphthyl amine to produce the azo-dye.
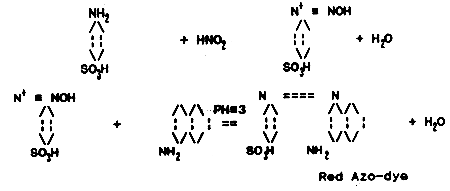
NaNO2 standard solution and its three variations:
a) NaNO2 basic solution. Weigh 4.927 g NaNO2 dried at 100 °C and dissolve in a small quantity of distilled water. Transfer to a clean 1-litre graduated flask and dilute up to the top graduation line. The solution can be preserved when 2 ml chloroform is added before dilution. The solution contains 1 mg/ml of NO2-N. This solution may be kept for 1–2 months. b) NaNO2 intermediate standard solution. Place 1 ml basic solution in 100 ml graduated flask and dilute up to the top graduation line. This solution contains 0.01 mg/ml of NO2-N and may be kept for 2–3 days.
c) NaNO2 practical standard solution. Place 1 ml intermediate standard solution in 100 ml graduated flask and dilute up to the top graduation line. This solution contains 0.0001 mg/ml NO2-N. It is to be used within 24 hours.
The above standard solutions should be sealed properly and kept in the dark.
2 % acetic acid solution. Dilute 24 mg pure-lump acetic acid with distilled water to 200 ml.
Para-amino benzol sulfonic acid. Pound 1 g of pure para-amino benzol sulfonic acid and dissolve in 30 ml 1:1 acetic acid (stir while heating). Add 270 ml distilled water and mix thoroughly.
α-naphthyl amine. Dissolve 0.2 g pure α-naphthyl amine in 40 ml distilled water while heating. Separate the purple precipitate from the colorless solution through filtration. Add 15 ml glacial acetic acid and 245 ml distilled water and stir. In case of chemically pure α-naphthyl amine, weigh 0.2 g, dissolve in a few drops of glacial acetic acid and add 300 ml 12 % acetic acid.
Place some NaNO2 practical standard solution in several 100 ml graduated flasks adjusting its concentration to range from 0–9 mg NO2-N/m3. Pour into these flasks artificial seawater of 90 ml total volume. Add 5 ml mixed reagent of para-amino benzol sulfonic acid and α-naphthyl amine solution, and add artificial seawater up to graduation and mix well.
Let it stand for half an hour. Draw a working diagram by measuring E-value with a photoelectric colorimeter or transfer to a color comparison tube for optical comparison method.
Collect approximately 90 ml seawater sample to be measured in 100 ml graduated flask, add 50 ml mixed indicator of para-amino benzol sulfonic acid solution and α-naphthyl amine solution, add seawater up to graduation, mix well and let stand for 30 minutes. Measure the E-value by using a photoelectric colorimeter or measure the content of standard solution which is similar to that of the seawater sample.
When zinc is put in a weak acid solution, nascent hydrogen is produced, which reduces nitrate to nitrite.
NO3- + 2H+ + Zn = NO2- + Zn++ + H2O
The produced nitrite reacts with p-amino benzol sulfonic acid and α-naphthyl amine. At this point red azo-dye appears, which can be used for colorimetry.
Zinc particles. Analytically pure zinc particles without arsenic.
Zinc powder. Analytically pure reagent.
12 % acetic acid solution.
0.32 N acetic acid solution. Place 161 ml 12 % acetic acid solution in 1000 ml graduated flask, fill with distilled water up to graduation and standardize the solution with NaOH. If the acetic acid solution is not of this concentration add moderate amount of acetic acid or water and standardize again.
Potassium nitrate standard solution. Weigh 0.361 g analytically pure KNO3, dissolve in 100 ml distilled water, place in 500 ml graduated flask, add 10–20 drops of chloroform and dilute with distilled water up to graduation (1 ml corresponds to 0.1 mg NO3-N). Dilute 5 ml of above solution to 100 ml when using.
p-amino benzol sulfonic acid. Dissolve 2 g p-amino benzol sulfonic acid in 400 ml acetic acid and keep in a brown bottle.
α-naphthyl amine. Place 40–60 ml distilled water in a beaker and dissolve 2.4 g α-naphthyl amine while heating. Remove particles not dissolved by using filter paper. Pour the solution into 400 ml 12 % acetic acid solution and keep in a brown bottle.
Griess reagent. Mix the above two solutions in the same volume before use.
Nitrite-free seawater. Collect seawater from the upper layer, pour into a glass bottle and keep in a place not exposed to direct sunlight. Two or three days later, when the water is nitrite-free, remove the suspended organic solids.
Draw a working diagram of a standard series. Place 0, 0.10, 0.20, 0.40 …. 1.40 potassium nitrate standard solution, respectively, in 250 Erlenmeyer flasks. The concentration is 0–140 mg NO3-N/m3. Pour 50 ml nitrogen-free seawater, or seawater with low nitrogen content and add 1.0 ml 0.32 N acetic acid and 80 mg zinc powder or 2.5 g zinc particles. Shake for 7 minutes for reduction and let stand for 2–3 minutes. (With zinc powder, let it sink but with zinc particles proceed further.) Pour this solution into 2 ml graduated vessels or color comparison tubes, mix well, let stand for 30 minutes and draw a density relationship graph of the nitrate concentration and the light.
Measuring the seawater sample. Pour 50 ml seawater in 250 ml Erlenmeyer flask and add 1.0 ml 0.32 N acetic acid and 80 mg zinc particles. Reduction or color-forming may be attained with the above-described method. Measure the light intensity with photo-electric calorimeter or compare with a standard series.
Determination of the BOD can be done as follows. Agitate a sample of water in a large container (provide aeration) and transfer to 2 clean glass bottles for oxygen measurement. Determine the dissolved oxygen immediately in one bottle. The other bottle should be measured after allowing it to stand for 5 weeks in a thermostat at 20 °C. BOD is the difference between the amount determined in the sampled water and the oxygen demand of a 1-litre water during its stay in the thermostat for 5 weeks.
For determining the actual level of BOD, collect a water sample in a 1.5 litre sealed glass beaker. The temperature of sampled water should be as near as possible to 0 °C. Transfer the sampled water to a large flask, heat up to 20 °C and shake well for a minute for oxygen saturation. Transfer the water into 2 glass bottles for oxygen measurement. Place one bottle in a thermostat at 20 °C while measuring the amount of oxygen in the second bottle. Measure the oxygen content in the former bottle five weeks later. The difference of oxygen contents in these two bottles is the BOD. The error of thermostat's temperature is deemed at ± 1 °C.
The degree of water oxidation may be determined based on the fact that potassium permanganate (KMnO4) consumes oxygen for the oxidation of organic substance.
In acid media, reductor potassium permanganate is reduced.
2KMnO4 + 3H2SO4 = 3H2O + 2MnSO4 + K2SO4 + 50
When excessive potassium permanganate solution is added to the sampled water, the extra potassium permanganate which does not take part in the oxidation of organic substance is decomposed (reduced by a certain amount of oxalic acid C2H2O4).
2KmnO4 + 5C2H2O4 + 3H2SO4 -- 8H2O + 1OCO2 + 2MnSO4 + K2SO4
2H2SO4 + K2MnO4 + 2H2C2O4 -- MnSO4 + 4CO2 + 4H2O + K2SO4
Titrate the remaining oxalic acid with a certain amount of KMnO4 solution after reducing the excess KMnO4.
The presence of oxides (iron sub-oxide, nitrous acid) increases the titration result of potassium permanganate.
Permanganic acid (MnO4) monomolecule in the alkaline media reacts with hydroxy monomolecule, producing free hydroxy. The hydroxy is unstable and therefore it soon decomposes producing nascent oxygen. A strong oxidizer as it is, this nascent oxygen reacts with the organic matter in water completely oxidating it.
KmnO4 + KOH = K2MnO4 + OH
2OH → H2O + (O),
i.e., 2KMnO4 + 2KOH + H2O → 2MnO4 + 4KOH + 3O
0.01 N oxalic acid (C2H2O4.2H2O) solution. Dissolve 0.6302 mg oxalic acid in water, the total volume to be 1 litre.
25 % sulfuric acid (H2SO4) solution.
50% caustic soda (NaOH). 0.01 N potassium permanganate (KMnO4) solution.
2KMnO4 + 3H2SO4 = 2MnSO4 + K2SO4 + 3H2O + 5O
In the acid solution, the bimolecular potassium permanganate produces a penta atom oxygen. Therefore, 0.01 N potassium permanganate solution will be:

If 0.316 g potassium permanganate is dissolved in 1 litre distilled water, 1 ml 0.01 N solution can separate 0.08 mg of oxygen.
a) In acid media. Pour 100 ml distilled water into a clean flask and add 5 ml 0.01 N potassium permanganate solution and 5 ml diluted sulfuric acid. Boil for 3–5 minutes to remove reductive substance sticking on the inner walls and wash the flask two to three times. Place in the flask 100 ml water sample by using a pipette, add 5 ml diluted sulfuric acid, and heat. When water begins to boil, add 10 ml 0.01 N potassium permanganate solution. Boiling should be for 10 minutes from the time it begins to boil. If, at the end of boiling, the liquid in the flask is reddish-pink, this means that enough of the potassium permanganate has been added for the oxidation of oxides contained in the water sample.
If the solution is colorless or of a distinct brown, do not go further, and dilute the sampled water with distilled water two to three times or add more potassium permanganate solution.
When its color is reddish-pink, add 10 ml 0.01 N oxalic acid solution into the flask. The color of the liquid in the flask disappears when shaken. When discoloration is completed, titrate excessive oxalic acid again with potassium permanganate solution and oxidize until the liquid is faint rosy-red when observed.
2KMnO4+5(C2H2O4.2H2O)+2H2SO4 = K2SO4+2MnSO4+18H2O2+10CO2
b) In alkaline media. Place a 100 ml water sample in a flask and heat until it boils. Add 0.5 ml caustic soda solution and 100 ml 0.01 N potassium permanganate solution. Boil for 10 minutes from the time it begins to boil. Cool the water to about 60 °C and add diluted sulfuric acid and 100 ml 0.01 N oxalic solution. When the liquid is completely discolored, titrate with the potassium permanganate solution until it becomes light pink.