![]()
![]()
Broom M.J. 1985. The biology and culture of marine bivalve of Genus Anadara. ICLARM Studies and Review 12:37pp.
Cole, H.A. 1972. The cockle and its fisheries. Fisheries Laboratory, Burnham on Crouch, Essex. Laboratory leaflet (new series), 34 pp.
Directorate General of Fisheries. 1983. Fisheries statistics of Indonesia, 1981. Department of Agriculture, Ministry of Agriculture, Indonesia, No.11,p.38.
Directorate General of Fisheries. 1984 Fisheries statistics of Indonesia, 1982. Department of Agriculture, Ministry of Agriculture, Indonesia, No.12,p.38.
Directorate General of Fisheries. 1985 Fisheries statistics of Indonesia, 1983. Department of Agriculture, Ministry of Agriculture, Indonesia, No.13,p.36.
Directorate General of Fisheries. 1986 Fisheries statistics of Indonesia, 1984. Department of Agriculture, Ministry of Agriculture, Indonesia, No.14,p.37.
Directorate General of Fisheries. 1987a Fisheries statistics of Indonesia, 1985. Department of Agriculture, Ministry of Agriculture, Indonesia, No.15,p.37.
Directorate General of Fisheries. 1987b International trade statistics of fisheries commodities. Department of Agriculture, Ministry of Agriculture, Indonesia, No.8, p.7.
Huschenbeth, E. and U. Harms. 1975 On the accumulation of organochlorine pesticides, PCB and certain heavy metals in fish and shellfish from Thai coastal and inland waters. Arch. Fischereiwiss, 25:109–122.
Pathansali, D. 1966. Notes on the biology of the cockle Anadara granosa Proc. Indo-Pac. Fish. Counc. 11:84–98.
Pathansali, D. and M.K. Soong. 1958. Some aspects of cockle (Anadara granosa L) culture in Malaysia. Proc. Indo-Pac. Fish. Counc. 8:26–31.
Phillips, D.J.H., and K. Muttarasin. 1985 Trace metals in bivalve molluscs from Thailand. Mar. Environ. Res. 15(3): 215–234.
Tiensongrusmee, B., and S. Pontjoprawiro. 1987 Seafarming resource map. INS/81/008/Manual7.
Toyo, T., I. Tesuji, N. Inoue. 1978. The mass culture of ark shell, Anadara and their problems in Yamaguchi Prefecture. Cult. Res. 7:51–66.
Tookwinas, S. 1985 Cockle farming in Thailand. National Institute of Coastal Aquaculture, Division of Brackishwater, Department of Fisheries, Ministry of Agriculture and cooperative, Bangkok, Thailand, 146pp.
Table 1. Volume and value of cockle production from 1979–1985
| Year | Volume (mt) | Value (Rp'million) |
| 1979 | 32 183 | 1 140 |
| 1980 | 32 383 | 1 245 |
| 1981 | 37 410 | 2 896 |
| 1982 | 29 335 | 3 059 |
| 1983 | 43 250 | 4 110 |
| 1984 | 48 926 | 6 147 |
| 1985 | 30 959 | 2 990 |
Table 2. Cockle production by location 1981–1985 (mt).
| Province | 1981 | 1982 | 1983 | 1984 | 1985 |
| Sumatra | |||||
D.I Aceh | 35 | 6 | 71 | 21 | 0 |
N.Sumatra | 32 143 | 24 092 | 35 119 | 36 273 | 19 050 |
Riau | 2 188 | 3 125 | 5 342 | 9 535 | 8 371 |
S.Sumatra | 140 | 211 | 261 | 269 | 466 |
Bengkulu | 4 | 6 | 8 | 21 | 41 |
Jambi | 268 | 382 | 421 | 330 | 392 |
| Java | |||||
DKI Jakarta | 0 | 359 | 223 | 282 | 270 |
W.Java | 1 179 | 179 | 189 | 103 | 7 |
C.Java | 0 | 122 | 144 | 14 | |
E.Java | 751 | 470 | 419 | 492 | 714 |
| Bali-Nusatenggara-Timor | |||||
W.Nusatenggara | 0 | 0 | 0 | 1 | 0 |
E.Nusatenggara | 30 | 46 | 71 | 132 | 83 |
| Kalimantan | |||||
W.Kalimantan | 0 | 0 | 514 | 742 | 800 |
C.Kalimantan | 165 | 28 | 50 | 0 | 0 |
S.Kalimantan | 48 | 0 | 122 | 126 | 126 |
E.Kalimantan | 143 | 46 | 56 | 243 | 308 |
| Sulawesi | |||||
S.Sulawesi | 2 | 2 | 32 | 36 | 41 |
| Maluku-Irian Jaya | |||||
Maluku | 2 | 71 | 73 | 75 | 101 |
Irian Jaya | 247 | 196 | 285 | 122 | 175 |
| Total | 37 410 | 29 313 | 43 206 | 48 926 | 30 959 |
Source : Directorate General of Fisheries, 1983, 1984, 1985, 1986, and 1987.
Table 3. Estimated capital investment of a 5-ha cockle farm.
| Investment | Initial cost (Rp million) | Life expectancy yr | Depreciated annual cost (Rp million) | |
| I. | Fixed assets | |||
| 1.Site acquisition | 1.0 | |||
| 2.Boat | 10.0 | 5 | 2.0 | |
| 3.Contingency (1–2)×10% | 1.1 | |||
| Total | 12.1 | 2.0 | ||
| II. | Working capital | 3.0 | ||
| III. | Total capital investment (I)+(II) | 15.1 | ||
Table 4. Estimated annual cost of production of a 5-ha cockle farm.
| Cost of production | Rp'000 | Percentage | ||
| I. | Fixed costs | |||
| 1. Depreciation | 2 000 | 21 | ||
| 2. | Cost of capital 20% interest | 3 000 | 31 | |
| Total fixed cost | 5 000 | 52 | ||
| II. | Variable costs | |||
| 1. Seed 1250 tin @Rp3000 | 3 750 | 38 | ||
| 2. Fuel and petrol | 120 | 1 | ||
| 3. Labor 12 man-month@ 60000 | 720 | 8 | ||
| 4. Maintenance | 50 | 1 | ||
| Total variable cost | 4 640 | 48 | ||
| III. | Total annual cost of production (I)+(II) | 9 640 | 100 | |
Table 5. Cost-benefit analysis of a 5-ha cockle farm.
| 1. Total cost of production | 9 640 | Rp'000 | |
| 2. Annual yield | 105 | Mt | |
| 3. Cost of cockle/kg (1)/(2) | 92 | Rp | |
| 4. Sale price/kg | 150 | Rp | |
| 5. Annual return (2)×(4) | 15 750 | Rp'000 | |
| 6. Return per Rp100 investment (4)/(3) | 163 | Rp | |
| 7. Taxable income (5)-(1) | 6 110 | Rp'000 | |
| 8. Depreciation | 2 000 | Rp'000 | |
| 9. Total annual cost less depreciation (1)-(8) | 7 640 | Rp'000 | |
| 10. Gross return (5)-(9) | 8 110 | Rp'000 | |
| 11. Taxes (7)×40% | 2 444 | Rp'000 | |
| 12. Total capital investment | 15 100 | Rp'000 | |
| 13. Net return (10)-(11) | 5 666 | Rp'000 | |
| 14. Payout period (12)/(13) | 2.67 | Yr | |
| 15. Capital recovery factor (13)/(12) | 0.38 | ||
| 16. NPV at 5th yr | 2 316 | Rp'000 | |
| 17. IRR @ 5 yrs | 28 | Per cent |
Table 6. Cash flow of a 5-ha cockle farm.
| Rp'000 | |||||
| Year | |||||
| 1 | 2 | 3 | 4 | 5 | |
| Cash at the beginning of the year | 0 | -8 990 | -2 880 | 1 938 | 8 854 |
| Investment | -15 100 | 0 | 0 | 0 | 0 |
| Production cost | -9 640 | -9 640 | -9 640 | -6 390 | -6 390 |
| Annual return | 15 750 | 15 750 | 15 750 | 15 750 | 15 750 |
| Cash in hand | -8 990 | -2 880 | 3 230 | 11 298 | 18 214 |
| Taxes (40%) | 0 | 0 | -1 292 | -2 444 | -2 444 |
| Cash at the end of the year | -8 990 | -2880 | 1 938 | 8 854 | 15 770 |
Table 7. Estimated capital investment of a 50-ha cockle farm.
| Investment | Initial cost (Rp million) | Life expectancy yr | Depreciated annual cost (Rp million) | ||
| I. | Fixed assets | ||||
| 1. | Site acquisition | 2 | |||
| 2. | Boat | 20 | 10 | 2 | |
| 3. | Land Transportation | (35) | 7 | 7 | |
| car (1) | 20 | ||||
| pick-up car (1) | 15 | ||||
| 4. | Contingency | ||||
| (1–3)×10% | 5 | ||||
| Total | 62 | 9 | |||
| II. | Working capital | 50 | |||
| III. | Total capital investment (I)+(II) | 112 | |||
Table 8. Estimated annual cost of production of a 50-ha cockle farm.
| Cost of production | Rp'000 | Percentage | ||
| I. | Fixed costs | |||
| 1. | Depreciation | 9 000 | 8 | |
| 2. | Cost of capital | |||
| 20% interest | 22 400 | 20 | ||
| 3. | Staff salaries | (22 800) | 20 | |
| farm manager (1) | 9 600 | |||
| clerk (1) | 3 600 | |||
| Labors (10) | 7 200 | |||
| boat operator (1) | 1 200 | |||
| driver (1) | 1 200 | |||
| 4. | Contingency | 10 000 | 9 | |
| Total fixed cost | 64 200 | 57 | ||
| II. | Variable costs | |||
| 1. | Seed 12500 tin @Rp3000 | 37 500 | 33 | |
| 2. | Fuel and petrol | 5 000 | 5 | |
| 3. | Maintenance | 5 000 | 5 | |
| Total variable cost | 47 500 | 43 | ||
| III | Total annual cost of production (I)+(II) | 111 700 | 100 | |
Table 9. Cost-benefit analysis of a 50-ha cockle farm
| 1. | Total cost of production | 111 700 | Rp'000 | |
| 2. | Annual yield | 1 050 | mt | |
| 3. | Cost of cockle/kg (1)/(2) | 106 | Rp | |
| 4. | Sale price/kg | 150 | Rp | |
| 5. | Annual return (2)×(4) | 157 500 | Rp'000 | |
| 6. | Return per Rp100 investment (4)/(3) | 142 | Rp | |
| 7. | Taxable income (5)-(1) | 45 800 | Rp'000 | |
| 8. | Depreciation | 9 000 | Rp'000 | |
| 9. | Total annual cost less depreciation (1)-(8) | 102 700 | Rp'000 | |
| 10. | Gross return (5)-(9) | 54 800 | Rp'000 | |
| 11. | Taxes (7)×40% | 18 320 | Rp'000 | |
| 12. | Total capital investment | 112 000 | Rp'000 | |
| 13. | Net return (10)-(11) | 36 480 | Rp'000 | |
| 14. | Payout period (12)/(13) | 3.1 | yr | |
| 15. | Capital recovery factor (13)/(12) | 0.33 | ||
| 16. | NPV at 5th yr | 81 993 | Rp'000 | |
| 17. | IRR @ 5 yrs | 57 | Per cent |
Table 10. Cash flow of a 50-ha cockle farm. Rp million
| Year | |||||
| 1 | 2 | 3 | 4 | 5 | |
| Cash at the beginning of the year | 0 | -66.2 | 12.2 | 62.1 | 118.8 |
| Investment | -112.0 | 0 | 0 | 0 | 0 |
| Production cost | -111.7 | -111.7 | -89.3 | -89.3 | -89.3 |
| Annual return | 157.5 | 157.5 | 157.5 | 157.3 | 157.5 |
| Cash in hand | -66.2 | -20.4 | 80.4 | 130.1 | 180.0 |
| Taxes (40%) | 0 | -8.2 | -18.3 | -18.3 | -18.3 |
| Cash at the end of the year | -66.2 | 12.2 | 62.1 | 111.8 | 161.7 |
Table 11. Percentage of net profit changes when the sale price of the cockle and the price of seed increase or decrease 10 per cent.
| System | Percentage of net profit changes |
| Sale price of cockle | |
small-scale | 17 |
big-scale | 26 |
| Price of seed | |
small-scale | 4 |
big-scale | 6 |
Table 12. Financial analysis.
| Size | Investment million | Net return per yr | NPV million | IRR |
| Small-scale | ||||
| 5 ha | 15.1 | 10.16 | 2.32 | 28 |
| Commercial scale | ||||
| 50 ha | 112.2 | 92.0 | 81.99 | 57 |
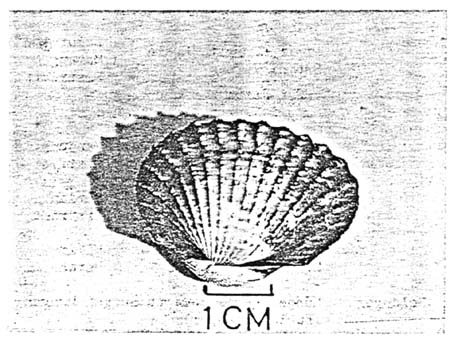
Fig.1. Cockle (Anadara granosa L.)
Fig.2. Diagrammatic representation of the wire collecting basket to collect spat of Anadara granosa.
(Source: Broom 1985)
Fig.3. Diagram of the wooden “mud sled”
(Source: Broom, 1985)
Fig.4. The gear used for harvesting cockle
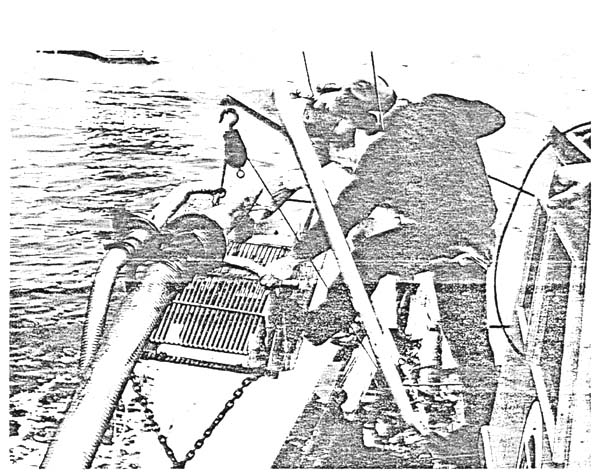
Fig.5. Hydraulic dredge for harvesting cockle (Source: Cole, 1972)
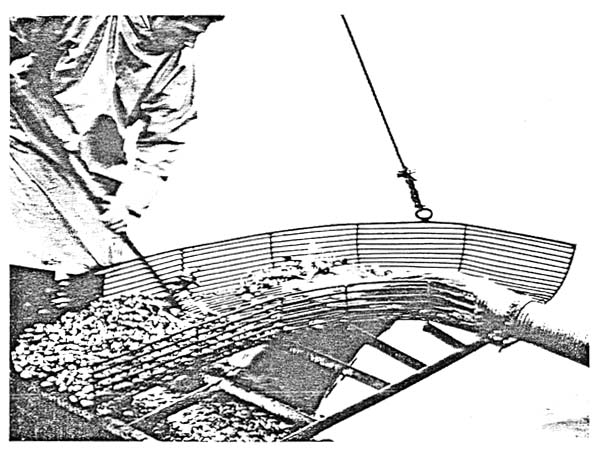
Fig.6. Hydraulic dredge - showing the delivery of the cockle to the collecting screen
(Source: Cole, 1972)
Fig.7. Growth in mean wet weight of different subpopulations within a natural population of A. granosa at Kuala Selangor, Malaysia. CD = chart datum.
 | Max density | < | 500/m2, 320 cm above CD, 1978 year class |
 | Max density | < | 500/m2, 320 cm above CD, 1977 year class |
| O | Max density | < | 500/m2, 270 cm above CD, 1978 year class |
| • | Max density | < | 500/m2, 200 cm above CD, 1978 year class |
| ■ | Max density | 500–1,000/m2, including Pelecyora trigona, 260 cm above CD, 1978 year class | |
| □ | Max density | > | 1,000/m2, 220–250 cm above CD, 1978 year class. |
(Source: Broom, 1985)
Fig.8. Predators of cockle
(Source: Tookwinas, 1985)

![]()
![]()