![]()
![]()
![]()
( in Metric tons )
| Brack ish water Fish Culture | Fresh Water Fish Pond Culture | Paddy Field Fish Culture | Cage Culture | Inland Open water Fishery | Total | |
| 1. Sumatra | 8,184 | 4,558 | 1,650 | 44 | 79,302 | 93,738 |
| 2. Lampung | 14 | 344 | 83 | 3,973 | 4,414 | |
| 3. Indonesia | 66,756 | 54,739 | 24,739 | 503 | 240,893 | 387,702 |
Source : Year Book of Fisheries Statistics 1974.
| Kinds of Fish | Crustaceans | ||
| 1. | Freshwater Fish | - common carp | - |
| Pond Culture | - puntius | - | |
| 2. | Paddy Field Fish | - common carp | - |
| Culture | - puntius | - | |
| 3. | Inland Open Water | - Snake head Fishery | - Fresh Water Giant shrimp/Lobster |
| - Fresh Water shrimp | |||
| 4. | Brackish Water | - mullets | - Tiger Prawn |
| Fish Pond Culture | - Barramundi | - Banana Prawn | |
Source : Year Book of Fisheries Statistics, 1974.
| No. | Regency/Municipality | Marine Fishermen | Inland Open Water Fishermen | Paddy Field Fish Farmers | Fresh Wa ter fish pond Farmers | Total |
| 1. | Regency of North Sumatra | 390 | 4,500 | 568 | 254 | 5,712 |
| 2. | Regency of Central Lampung | 779 | 17,772 | 187 | 752 | 19,510 |
| 3. | Regency of South Lampung | 794 | 850 | 1,550 | 1,723 | 4,917 |
| 4. | Municipality of Teluk Betung | 490 | - | - | -- | - |
| Total | 2,473 | 23,122 | 2,305 | 2,729 | 30,139 |
| Y e a r | Gross Domestic Product (In millioan Rp.) | % Increase |
| 1969 | 53,773.4 | 8.97% |
| 1970 | 58,602.7) | 14.87% |
| 1971 | 67,318.3) | 19.80% |
| 1972 | 80,647.4) | 8.38% |
| 1973 | 84,409.0) | 6.76% |
| 1974 | 93.318.0) |
Source : Regional Income of the Lampung Province, 1969–1974.
(in million Rp.)
| FIELDS OF UNDERTAKING | Y e a r | |||||
| 1969 | 1970 | 1971 | 1972 | 1973 | 1974 | |
| 1. Agriculture, Livestock, Forestry & Fisheries. | 28,414.6 | 31,833.0 | 35,670.0 | 42,560.2 | 45,667.4 | 45,127.6 |
A. Food crops | 11,907.2 | 13,794.4 | 17,063.7 | 18,848.0 | 31,549.1 | 21,247.0 |
B. Commercial crops | 8,944.6 | 10,628.9 | 8,561.2 | 12,696.8 | 11,696.8 | 11,317.2 |
C. Forestry | 1,061.3 | 1,077.9 | 1,294.0 | 2,079.8 | 1,840.0 | 8,991.2 |
D. Livestock | 5,348.5 | 5,195.5 | 6,615.3 | 7,589.7 | 8,098.4 | 8,991.2 |
E. Fisheries | 1,153.0 | 1,136.3 | 2,138.8 | 1,997.0 | 2,483.1 | 1,789.5 |
| 2. Mining & Extraction | - | - | - | - | - | - |
| 3. Industry | 2,976.3 | 3,030.0 | 3,047.6 | 3,624.1 | 4,624.5 | 5.549.2 |
| 4. Construction | 966.8 | 1,023.3 | 1,073.0 | 1,101.0 | 1,142.1 | 1,214.6 |
| 5. Electricity, Gas and Drinking Water | 119.8 | 123.7 | 148.9 | 158.5 | 171.3 | 183.0 |
| 6. Transportation & Communications | 2,368.7 | 2,623.8 | 2,471.1 | 2,475.3 | 3,028.4 | 3,652.2 |
| 7. Wholesale- and Retail Trade | 12,324.6 | 12,144.3 | 14,689.9 | 18,363.3 | 18,811.6 | 21,644.2 |
| 8. Banking and other Institutions | 902.1 | 1,002.4 | 1,134.6 | 1,116.7 | 1,228.9 | 1,286.2 |
| 9. House Rent | 3,476.2 | 4,345.0 | 5,214.6 | 6,320.3 | 7,900.4 | 9,480.5 |
| 10. Government | 1,113.8 | 1,466.2 | 2,646.8 | 3,322.6 | 3,354.3 | 3,392.5 |
| 11. Services | 1,084.5 | 1,111.0 | 1,212.8 | 1,405.4 | 1,480.1 | 1,788.0 |
| REGIONAL GROSS DOMESTIC PRODUCT | 53,777.4 | 58,602.7 | 67,418.3 | 80,674.4 | 87,409.0 | 93,318.0 |
Source : Regional Income of the Lampung Province (1969 – 1974).
| Kind of Transmigration | Family Heads Persons | North Lampung | Central Lampung | South Lampung | Total |
| Transmigration | Family Heads | 818 | - | - | 818 |
| Persons | 3,730 | - | - | 3,730 | |
| Spontaneous Transmigration | Family Heads | 113 | 16 | 13 | 142 |
| Persons | 420 | 83 | 72 | 595 | |
| T o t a l | Family Heads | 931 | 16 | 13 | 960 |
| Persons | 4,150 | 83 | 72 | 4,305 |
Source : Transmigration Directorate Office of the First Grade Region of the Lampung Province.
( In metric ton -percentage )
| Shrimp Production | |||||||
| Indonesia | Sumatra | Lampung | |||||
| Total | Pct. | Total | Pct. | Total | Pct.to Production Indonesia. | Pct. Sumatra Production | |
| 1971 | 46,797 | 100 | 29,963 | 64.0 | 1,687 | 3.6 | 5.6 |
| 1972 | 60,085 | 100 | 26,048 | 43.4 | 1,159 | 1.9 | 4.4 |
| 1973 | 71,060 | 100 | 27,556 | 38.8 | 1,422 | 2.0 | 5.2 |
| 1974 | 68,450 | 100 | 29,739 | 43.4 | 1,381 | 2.0 | 4.6 |
| 1975 | 75,795 | 100 | 29,988 | 39.6 | 151 | 0.2 | 0.5 |
| Average | 100 | 45.8 | 1.9 | 4.1 | |||
Source : Directorate General of Fisheries.
| Year | Marine Shrimp | Inland Open Water Shrimp | Brackish Water Shrimp culture | Amount | ||||
| Total | Pct. | Total | Pct. | Total | Pct. | Total | Pct. | |
| Indonesia | ||||||||
| 1973 | 54,488 | 76.7 | 7,204 | 10.1 | 9,368 | 13.2 | 71,060 | 100 |
| 1974 | 51,574 | 75.3 | 6,467 | 9.5 | 10,409 | 15.2 | 68,450 | 100 |
| 1975 | 60,391 | 79.7 | 5,801 | 7.6 | 9,603 | 12.7 | 75,795 | 100 |
| Average | 77.2 | 9.1 | 13.7 | 100 | ||||
| Sumatra | ||||||||
| 1973 | 22,141 | 80.4 | 3,039 | 11.0 | 2,376 | 8.6 | 27,556 | 100 |
| 1974 | 24,575 | 82.6 | 2,637 | 8.9 | 2,527 | 8.5 | 29,739 | 100 |
| 1975 | 25,641 | 85.5 | 1,342 | 4.5 | 3,005 | 10.0 | 29,988 | 100 |
| Average | 82.8 | 8.1 | 9.1 | 100 | ||||
| Lampung | ||||||||
| 1973 | 1,100 | 77.3 | 315 | 22.2 | 7 | 0.5 | 1,422 | 100 |
| 1974 | 1,029 | 74.5 | 350 | 25.3 | 2 | 0.2 | 1,381 | 100 |
| 1975 | 38 | 25.2 | 105 | 69.5 | 8 | 5.3 | 151 | 100 |
| Average | 59.0 | 39.0 | 2.0 | 100 | ||||
Source : Directorate General of Fisheries.
( in metric ton percentage)
Year | Production Giant Fresh Water (Prawn) | |||||||
| Indonesia | Sumatra | Lampung | To | |||||
| Total | Pct. | Total | Pct. | Total | Pct. | Pct. to Production Indonesia | Pct. to Production Sumatra | |
| 1973 | 4,304 | 100 | 1,536 | 35.7 | 210 | 4.9 | 13.7 | |
| 1974 | 3,065 | 100 | 1,377 | 44.9 | 130 | 4.2 | 9.4 | |
| 1975 | 2,516 | 100 | 870 | 34.6 | 80 | 3.2 | 9.2 | |
| Average | 100 | 38.4 | 4.1 | 10.8 | ||||
Source : Directorate General of Fisheries.
| Year | Fisheries Production | Shrimp Production | ||||
| Marine Fishery | Inland open water Fisheries | Culture | Total | Total | Pct. | |
| 1971 | 820,447 | 285,745 | 138,363 | 1,244,555 | 46,797 | 4 |
| 1972 | 836,289 | 301,412 | 131,208 | 1,268,909 | 60,085 | 5 |
| 1973 | 888,518 | 239,306 | 139,402 | 1,267,226 | 71,060 | 6 |
| 1974 | 948,566 | 240,893 | 146.809 | 1,336,268 | 68,450 | 5 |
| 1975 1) | 994,000 | 243,000 | 153,000 | 1,390,000 | 75,795 | 5 |
Source : Directorate General of Fisheries.
(in metric ton - percentage )
| Year | Export Volume of Fishery Products Indonesia | Export Volume of Fresh Shrimp Indonesia | ||
| Total | Percentage | Total | Percentage | |
| 1968 | 19,717 | 100 | 2,461 | 12 |
| 1969 | 21,426 | 100 | 5,129 | 24 |
| 1970 | 22,060 | 100 | 6,874 | 31 |
| 1971 | 30,756 | 100 | 16,696 | 54 |
| 1972 | 41,156 | 100 | 22,620 | 55 |
| 1973 | 52,178 | 100 | 28,146 | 54 |
| 1974 | 54,953 | 100 | 32,110 | 58 |
| 1975 | 40,713 | 100 | 24,152 | 59 |
Source : Adapted by LMFEUI. from Central Bureau of Statistics.
(in metric ton - percentage )
| Year | Shrimp Production Indonesia | Export Volume of Fresh Shrimp Indonesia | |||
| Head on | Percentage | Headless | Head on 1) | Percentage | |
| 1971 | 46,797 | 100 | 16,696 | 33,392 | 71 |
| 1972 | 60,085 | 100 | 22,620 | 45,240 | 75 |
| 1973 | 71,060 | 100 | 28,146 | 56,292 | 79 |
| 1974 | 68,450 | 100 | 32,110 | 64,200 | 94 |
| 1975 | 75,795 | 100 | 33,272 2) | 66,556 | 88 |
| Average | 81 | ||||
Source : Adapted by LMFEUI from Central Bureau of Statistic figures
1). Proportion head on to headless = 50 pct : 50 pct.
2). 24152 metric ton ( in Netto) bruto : 24152×

(in metric ton-headless)
| Y e a r | Export Fresh Shrimp | Export Processed Shrimp |
| 1970 | 6,874 | 459 |
| 1971 | 16,696 | 333 |
| 1972 | 22,620 | 791 |
| 1973 | 28,146 | 641 |
| 1974 | 32,110 | 611 |
| 1975 | 33,278 | 969 |
Source : Central Bureau of Statistic - Jakarta.
(in tons-percentage)
| Y E A R | Indonesian Fresh Shrimp Exports by Countries of Destination | |||||||||||
| Total | Singapore | Hongkong | Japan | U.S.A | Benelux | |||||||
| Volume | % | Volume | % | Volume | % | Volume | % | Volume | % | Volume | % | |
| 1970 | 6,374 | 100 | 418 | 6 | 385 | 6 | 5,243 | 76 | 83 | 1 | 11 | 0.2 |
| 1971 | 16,696 | 100 | 369 | 2 | 431 | 3 | 14,613 | 88 | 534 | 73 | 0.4 | |
| 1972 | 22,620 | 100 | 625 | 3 | 1,230 | 5 | 17,883 | 79 | 1,552 | 7 | 486 | 2 |
| 1973 | 28,146 | 100 | 676 | 2 | 1,091 | 4 | 23,855 | 8 | 1,545 | 3 | 149 | 0.2 |
| 1974 | 32,110 | 100 | 1,384 | 4 | 1,296 | 4 | 25,464 | 79 | 3,036 | 9 | 445 | 1 |
| 1975 | 24,152 | 100 | 903 | 4 | 1,296 | 5 | 20,494 | 85 | 614 | 3 | 555 | 2 |
| Average | 3.5 | 4.5 | 82 | 4.7 | 1 | |||||||
Source : Processed by the Management Institute of the Economic Faculty of the University of Indonesia, from data of the Central Bureau of Statistics.
(in metric tons-percentages)
| Y e a r | IMPORT VOLUME (METRIC TONS) | |||||||||||
| U.S.A | HONGKONG | SINGAPORE | J A P A N | |||||||||
| Total | From Indonesia | Total | From Indonesia | Total | From Indonesia | Total | From Indonesia | |||||
| Total | % | Total | % | Total | % | Total | % | |||||
| 1970 | 129,500 | 83 | 0.66 | 15,300 | 383 | 2.50 | 13,600 | 418 | 3.07 | 122,800 | 5,243 | 4.27 |
| 1971 | 120,800 | 534 | 0.44 | 18,900 | 431 | 2.28 | 14,500 | 369 | 2.54 | 184,700 | 14,613 | 7.91 |
| 1972 | 137,400 | 1,552 | 1.13 | 18,900 | 1,230 | 6.51 | 18,100 | 265 | 3.45 | 209,000 | 17,888 | 8.56 |
| 1973 | 125,000 | 1,545 | 1.24 | 21,000 | 1,091 | 5.20 | 17,200 | 676 | 3.93 | 239,100 | 23,855 | 9.98 |
| 1974 | 135,700 | 3,036 | 2.27 | 22,200 | 1,296 | 5.84 | 20,400 | 1,384 | 6.78 | 253,700 | 25,464 | 10.04 |
Source : Processed by the Management Institute of the Economic Faculty of the University of Indonesia, from data of Directorate General of Fisheries and the Central Bureau of Statistics.
| Item | Unit | 1971 | 1972 | 1973 | 1974 | 1975 | Average | |
| 1. | Shrimp Production | |||||||
| a. Head on | m.t. | 46.797 | 60,085 | 71.060 | 68,450 | 75,795 | ||
| b. Headless | m.t. | 23,398 | 30,042 | 35,530 | 34,225 | 37,897 | ||
| 2. | Shrimp Export/Headless | |||||||
| a. Fresh Shrimp | m.t. | 16,696 | 22,620 | 28,146 | 32,110 | 33,278 | ||
| b. Processed shrimp | m.t. | 333 | 791 | 461 | 611 | 969 | ||
| 3. | Populations | Thousand | 120,148 | 123,115 | 126,038 | 129,082 | 132,110 | |
| 4. | Consumption gram/per capita x) | capita | 52 | 54 | 53 | 12 | 28 | 40 |
Source : Processed by the Management Institute of the Economic Faculty of the University of Indonesia, from data of the Directorate General of Fisheries and the Central Bureau of Statistics.
(in U.S.$./METRIC ton)
| (1). | Kinds of Shrimp with shell on and headless : | |||
| a. | Size A | ( 1 through 25 pieces/1b ) | US$.7,750/mt. | |
| b. | Size B | (26 through 40 pieces/1b ) | US$.5,190/mt. | |
| c. | Size C | (40 through 70 pieces/1b ) | US$.4,590/mt. | |
| d. | Size D | (71 through 100 pieces/1b) | US$.3,690/mt. | |
| e. | Size E | (100 pieces upwards /1b) | US$.1,690/mt. | |
| (2) | Kinds of Shrimp peeled and headless | |||
| a. | Size A | ( 1 through 40 pieces/1b ) | US$.3,875/mt. | |
| b. | Size B | ( 41 through 100 " /1b ) | US$.2,440/mt. | |
| c. | Size C | ( 101 through 200 " /1b ) | US$.2,060/mt. | |
| d. | Size D | ( 201 upwards/1b | UC$.1,690/mt. | |
Source : Department of Trade
= 1 1b. = 454.9 grams.
(metric ton)
| Year | Supply Projection |
| 1976 | 84,380 |
| 1977 | 91,020 |
| 1978 | 97,660 |
| 1979 | 104,300 |
| 1980 | 110,940 |
| 1981 | 117,580 |
Source : LMFEUI - Adapted from Appendix IV.1.
Yi = 51.18 + 6.64 Xi
(1.6227)
R2 = 0.8481
(in percentages )
| Y e a r | Shrimp Fishery Supply | ||
| Marine catch 1) | Inland open Water catch 2) | Brackish water fish pond culture catch 3) | |
| 1976 | 77.2 | 9.1 | 13.7 |
| 1977 | 77.7 | 9.3 | 14.0 |
| 1978 | 78.2 | 9.5 | 14.3 |
| 1979 | 78.7 | 9.7 | 14.6 |
| 1980 | 79.2 | 9.9 | 14.9 |
| 1981 | 79.7 | 10.1 | 15.2 |
Source : Calculation of the Management Institute of the Economic Faculty of the University of Indonesia, on the basis of Appendix IV.2.
(in metric ton)
| Y e a r | Projection |
| 1976 | 40,93 |
| 1977 | 45,939 |
| 1978 | 50,942 |
| 1979 | 55,949 |
| 1980 | 60,951 |
| 1981 | 65,955 |
Source : Based on Appendix IV.8.
in which :
Yi = 899,083 + 5,004.333 Xi (379.066)
R2 = 0.9667
(in metric ton ).
| Y e a r | Projection |
| 1976 | 997 |
| 1977 | 1,106 |
| 1978 | 1,215 |
| 1979 | 1,324 |
| 1980 | 1,433 |
| 1981 | 1,543 |
Source : Based on Appendix IV.8.
Yi = 450.6 + 102.2 Xi (58.504)
R2 = 0.5373
(in tons -head thousand persons)
| Y e a r | Shrimp Consumption per-capita (in grams) 1) | Projection of population of Indonesia (in thousand Persons) 2) | Projection of Indonesia Shrimp Consumption (in tons headless) 3) |
| 1976 | 40 | 135,190 | 5,408 |
| 1977 | 40 | 138,341 | 5,534 |
| 1978 | 40 | 141,578 | 5,663 |
| 1979 | 40 | 144,912 | 5,796 |
| 1980 | 40 | 148,349 | 5,934 |
| 1981 | 40 | 151,895 | 6,076 |
Source : Calculation by the Management Institute of the Economic Faculty of the University of Indonesia, on the basis of Appendix IV.9.
1) See Appendix IV.9. ( average figures in the period of 1971–1975 )
2) Central Bureau of Statistics - Jakarta
| M O N T H | Year | ||||
| 1973 | 1974 | 1975 | |||
| 1. | January | 1 | 505 | 213 | 206 |
| 2 | 21 | 14 | 14 | ||
| 2. | February | 1 | 112 | 381 | 185 |
| 2 | 11 | 22 | 14 | ||
| 3. | March | 1 | 119 | 302 | 145 |
| 2 | 16 | 19 | 9 | ||
| 4. | April | 1 | 165 | 241 | 316 |
| 2 | 13 | 17 | 10 | ||
| 5. | May | 1 | 156 | 373 | 350 |
| 2 | 12 | 19 | 19 | ||
| 6. | June | 1 | 20 | 146 | 122 |
| 2 | 3 | 15 | 10 | ||
| 7. | July | 1 | 9 | 204 | 135 |
| 2 | 4 | 8 | 10 | ||
| 8. | August | 1 | 35 | 490 | 272 |
| 2 | 4 | 14 | 13 | ||
| 9. | September | 1 | 1 | 478 | 328 |
| 2 | 1 | 20 | 14 | ||
| 10. | October | 1 | 193 | 190 | 247 |
| 2 | 19 | 14 | 15 | ||
| 11. | November | 1 | 193 | 185 | 417 |
| 2 | 7 | 17 | 18 | ||
| 12. | December | 1 | 638 | 614 | 275 |
| 2 | 12 | 17 | 13 | ||
| T o t a l | 1 | 2,033 | 3,817 | 2,998 | |
| 2 | 103 | 196 | 159 | ||
Explanation : 1. Raifall (mm)
2. Number of rainydays
Source : Public Works and Electric Power Service of Lampung Province.
(BJKi VI left and right hand channels)
| M o n t h | Y E A R | |||||
| 1971 | 1972 | 1973 | 1974 | 1975 | ||
| January | 1 | - | 426.4 | - | 553.4 | 288 |
| 2 | - | 25 | - | 19 | 22 | |
| February | 1 | - | 249.7 | - | 450.8 | 205 |
| 2 | 16 | - | 17 | 19 | ||
| March | 1 | - | 467 | - | 209.9 | 160.7 |
| 2 | - | 20 | - | 15 | 23 | |
| April | 1 | - | 167 | - | 117 | 156.6 |
| 2 | - | 13 | - | 9 | 13 | |
| May | 1 | - | 141 | 290.1 | 50.1 | 51.5 |
| 2 | - | 16 | 16 | 8 | 13 | |
| June | 1 | - | 46.1 | 362.8 | 263.6 | 191.4 |
| 2 | - | 7 | 15 | 13 | 11 | |
| July | 1 | 107.6 | 8,9 | 72.6 | 79.7 | 102.1 |
| 2 | 14 | 2 | 11 | 14 | 15 | |
| August | 1 | 153.2 | 76.7 | 272.7 | 89.2 | 177.5 |
| 2 | 13 | 7 | 17 | 15 | 18 | |
| September | 1 | 22.1 | 5 | 385.6 | 281.7 | 114.0 |
| 2 | 4 | 3 | 18 | 15 | 17 | |
| October | 1 | 109.1 | 0.5 | 168.0 | 79.1 | 348.5 |
| 2 | 14 | 1 | 18 | 11 | 16 | |
| November | 1 | 92.2 | 93.0 | 170.2 | 147 | 94.1 |
| 2 | 15 | 8 | 12 | 15 | 11 | |
| December | 1 | 437.5 | 491.6 | 296.6 | 160.6 | 183.9 |
| 2 | 20 | 14 | 14 | 23 | 17 | |
| 1 | 921.7 | 2,172.9 | 2.018.6 | 2,481.9 | 2,073.3 | |
| 2 | 80 | 132 | 117 | 174 | 185 | |
Explanation : 1. Rainfall (mm)
2. Number of Rainy days.
Source : Public Works and Electric Power Service of Lampung Province
1. Tanks and Ponds1)
Sea-water Accomodation Tank
To accomodate sea-water, in order that dirt can settle down before the sea-water is used for the hatchery. The accomodation volume is 48 cubic metres.
The construction cost is estimated at Rp. 4,000,000.--.
Fresh water Accomodation Tank
To accomodate fresh water. As the fresh water is obtained from a drilled well, therefore for the continuity of fresh water supply, an accomodation tank should be provided, with a volume of 48 cubic metres. The construction cost is estimated at Rp. 4,000,000.--
Hatchery Tanks or Rearing Ponds
To hatch the eggs. Its volume is 1 cubic metre or 1,000 litres. Each tank can be used for hatching around 20 – 30 gravied shrimp (from “Giant Fresh water Prawn Culture”, S. Rachmatun Soepanto).
The hatching period is approximately 1 – 2 days. Each gravied shrimp can produce 20,000 – 100,000 eggs. If at an average each gravied shrimp can lay 50,000 eggs, then each tank can produce approximately 1 million eggs within a period of two weeks. The number of tanks required is 8 units.
Their estimated construction cost per unit is Rp. 200,000.--.
Larve Tanks
The hatched eggs are transferred to the larve tanks. The tank volume is 2×6×1 cubic metres or 12 cubic metres. With a density of 100 pieces per litre, in each tank 1.2 million larve can be cultivated. The larve are cultivated here for approximately 30 – 50 days. The number of tanks required is 6 units.
The estimated construction cost is Rp. 1,000,000. per unit. The mortality-rate here is sufficiently high, namely approximately 70 – 90 per cent or averagely 80 percent.
Juvenile Tanks
After the larve stadium has been passed, the larve are called juveniles and are transferred to the juvenile tanks. The tank volume is 2×6×1 cubic metres or 12 cubic metres. In these tanks the salt-water content is gradually reduced, so that, after 3 days the juveniles will already live in fresh water. The juveniles are cultivated here for approximately 7 days. The density of the cultivated juveniles is around 30 pieces per litre; each tank can accomodate 600,000. juveniles.
As the mortality-rate of the juveniles is high, it is estimated, that only 3 units juvenile tanks are required. Their estimated construction cost is Rp. 1,000,000.-- per unit.
Adaptation Ponds
The growth of the above juveniles is very fast. The further stadium is transferring/ moving the juveniles to the adaptation ponds. The ponds are made of concrete with measurements of 2×6 ×0.3 cubic metres or 3.6 cubic metres.
The total cultivation period of the juveniles in the juvenile tanks and adaptation ponds is approdiximately 1 month. The number of adaptation ponds is estimated at 5 units. The average mortality rate is 50 pct., namely in the juvenile tanks and the adaptation ponds.
Seedlings ready for scattering are called fingerlings, measuring one finger.
The estimated construction cost is Rp. 500,000.-- per unit.
Green water Tanks or Alga Tanks
Are tanks for producing alga, or tanks for producing larve and juvenile feed.
Alga water is a culture of one-cell alga plankton for the entire growth of alga.
In the tanks fertilizers should be provided : 20 grams TSP, 20 grams Urea, 20 – 50 grams Organic, namely for every 1 cubic metre of alga water.
The alga water is used after 7 days. The tank measurements are 2 × 2 × 1 cubic metres. The number of tanks required is 4 units. Their estimated construction cost is Rp. 400,000.-- per unit.
Mixing Water Tank
To obtain a mixture of freshwater and salt-water with the required proportion. This water is mixed again with alga water, so that the mixture will become of rather dark light green colour.
The tank measurements are 3 × 2 × 1 cubic metres; 1 unit is sufficient. The price is estimated at Rp. 500,000.--.
Gravied shrimp Storage Pond
Is needed for the cultivation of gravied shrimp. The proportion between the gravied shrimp and the male shrimps is 4 : 1.
With sufficient feed and proper cultivation, each gravied shrimp can lay eggs once in every 2 months. The scatter density of gravied shrimp in this pond is approximately 3 shrimps per square metre pond.
In order to cultivate gravied shrimp and male shrimps, approximately 2,500 square metres of ponds are required, and also ponds for tests/ trials.
On the sides of this pond, cemented bricks should be provided, bud the bottom should be of ordinary soil. For the areal-extent of the cultivation-and trial ponds, approximately 15,000 square metres will be reserved. The estimated construction cost is Rp. 8,600,000.--.
2. Equipments
Salt water Pumps
to pump sea-water/ salt water.
the pump capacity is approximately 500 litres/ minute.
the pump power is 5 HP.
the number of pumps required is 2 units.
Fresh Water Pumps
to pump fresh water, for pumping water from under the ground as well as for circulation pump.
the pump capacity is approximately 300 – 500 litres/ minute.
the number of pumps required is 3 units.
Blowers
In order to obtain a sufficient oxygen content in the water, so that the larve as well as the juveniles will not lack in oxygen, airation should be provided in each tank. Airation is pressured air produced by a Blower and blown into the water.
The requirement is, that the air produced should be clean. 2 blowers are required, one of which for reserve.
The blower energy is 2 KW. The capacity is 3 litres per second, the pressure need not to be too high.
The blowers should be placed centrally, in order to be able to airate all the ponds as required.
Generator Sets
In order to obtain electricity, generator sets should be provided, with a capacity of 10 KVA.
The number required is 2 units, one of which for reserve.
Shrimp feed making machines
In order to ensure the continuity and quality of the shrimp feed, shrimp feed making machines should be provided.
The machines consist of a Blender and a Mixer. The capacity should be adjusted to the requirements.
Pipe Installation and fittings
Are used for water channels and pressurized air. The material used should be non-corrosive, so that PVC pipes should be used.
Laboratory- and Office Equipments
Laboratory-and office equipments are required for smooth operations. Standard equipments for seedling activities should be provided.
Fishery-and Tank Maintenance Equipments.
Nets are required for the catching of shrimp seedling-stock.
Tank- and pond maintenance equipments should also be provided.
3. Buildings
Glass roofed house building
In order to protect the hatching tanks, the larve tanks, the juvenile tanks, etcetera, against rain, a glass roofed house should be built.
The construction is as follows : reinforced concrete piles/ columns; concrete floor; iron/ steel frame; with an aluminium roof frame; glass roof of 5 mm. thickness.
The building extent is 300 square metres. The estimated construction cost is Rp. 35,000 per square metre.
Laboratory and Office
A laboratory- and office building of 200 square metres extent should be built with a simple construction. The construction cost is Rp. 45,000.-- per square metre.
Warehouse
A warehouse is required for the storage of equipments, feed, fertilizer, etcetera.
The building extent is approximately 50 square metres. The construction cost is Rp. 40,000.-- per square metre.
Building for Machinery and Shrimp Feed Making
This building can be combined with the warehouse. The building extent is approximately 15 square metres. The construction cost is Rp. 40,000.-- per square metre.
Power House
The power house is used to protect the generator sets and blowers. The building extent is approximately 20 square metres. The construction cost is Rp. 40,000.-- per square metre.
Housing
For the housing of the Management and staff of this Culture Institute, a complex should be built, consisting of :
f.1. House for the Management
The building extent is 70 square metres. The construction cost is Rp. 50,000 per square metre. The number is 1 unit.
f.2. Housing for Staff
The building extent is 50 square metres.
The construction cost is Rp. 50,000 per square metre. The number is 3 units.
f.3. Personnel Housing and Guard House
The building extent is 100 square metres. Consisting of 4 coupled houses. The construction cost is Rp. 30,000.-- per square metre.
f.4. Fence encircling the Project
The construction is as follows : barbed wire, concrete poles.
The length is estimated at 800 metres.
The construction cost is Rp. 3,000.-- per square metre.
f.5. Roads within the Project
The construction is Macadam.
The extent is estimated at 1,000 square metres.
The construction cost is Rp. 3,000.-- per square metre.
4. Vehicles.
Vehicles are required for the Hatchery Operations, namely :
| a. | 1 unit 2 ton mini truck | : | Rp. 3,000,000.-- |
| b. | 1 unit jeep | : | Rp. 4,000,000.-- |
5. Other Equipments
Plastic tubes/ cylinders and accessories are required for the transportation of juveniles to the commercial ponds.
The number is 20 units. The price is Rp. 10,000.-- per unit.
Deep Wells
Fresh water is obtained from deep wells. Minimally one deep well is required with a depth of 150 metres.
The cost for drilling the well with its installation is Rp. 2,500,000.--.
A. Results of tests on quality of water at way Urang
| Riverwater | Sea Water | ||
| P.H | 7 | Salinity | 34.65 |
| DMA | 1.3 | Air Temperature | 30°C |
| Salinity | 0.45 | Water Temperature | 27°C |
| Air Temperature | 33°C | Colour of Water | clear |
| Water Temperature | 29°C | ||
| Colour of Water | clear |
The tests Were conducted at 13.30 hours.
B. Results of tests on quality of water at way Jepara
| At the way Jepara Lake | At the Irrigation Channel | ||
| ( BJKI VI ) | |||
| P.H. | 7 | P.H. | 8 |
| DMA | 1.05 | DMA | 1.05 |
| Air Temperature | 33°C | Air Temperature | 31°C |
| Water Temperature | 28°C | Water Temperature | 27°C |
| Colour of water | clear, | Colour of Water | brownish. |
| brownish | |||
The tests were conducted at 14 :30 hours.
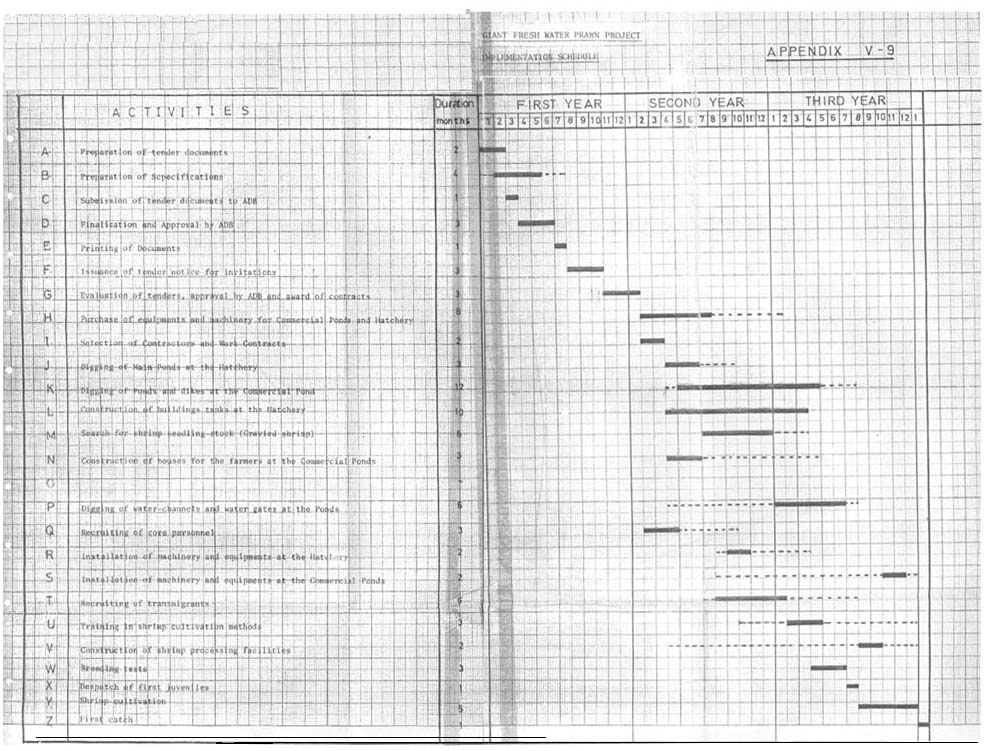
| A. | Preparation of tender documents | (2) |
| B. | Preparation of Specifications | (4) |
| C. | Submission of tender documents to ADB | (1) |
| D. | Finalization and Approval by ADB | (3) |
| E. | Printing of Documents | (1) |
| F. | Issuance of tender notice for invitations | (3) |
| G. | Evaluation of tenders, approval by ADB and award of contracts | (3) |
| H. | Purchase of equipments and machinery for Commercial ponds and Hatchery | (6) |
| I. | Selection of Contractors and Work Contracts | (2) |
| J. | Digging of Main Ponds at the Hatchery | (3) |
| K. | Digging of Ponds and dikes at the Commercial Ponds | (12) |
| L. | Construction of buildings and tank at the Hatchery | (10) |
| M. | Search for shrimp seedling-stock (Gravied shrimp) | (6) |
| N. | Construction of houses for the farmers at the Commercial Ponds | (3) |
| P. | Digging of water-channels and water gates at the Ponds | (6) |
| Q. | Recruiting of core personnel | (3) |
| R. | Installation of machinery and equipments at the Hatchery | (2) |
| S. | Installation of machinery and equipments at the Commercial Ponds | (2) |
| T. | Recruiting of transmigrants | (6) |
| U. | Training in shrimp cultivation methods | (3) |
| V. | Construction of shrimp processing facilities | (2) |
| W. | Breeding tests | (3) |
| X. | Despatch of first juveniles | (1) |
| Y. | Shrimp cultivation | (5) |
| Z. | First catch | (1) |
Activities : See Appendix V-7
 | Notes :
|
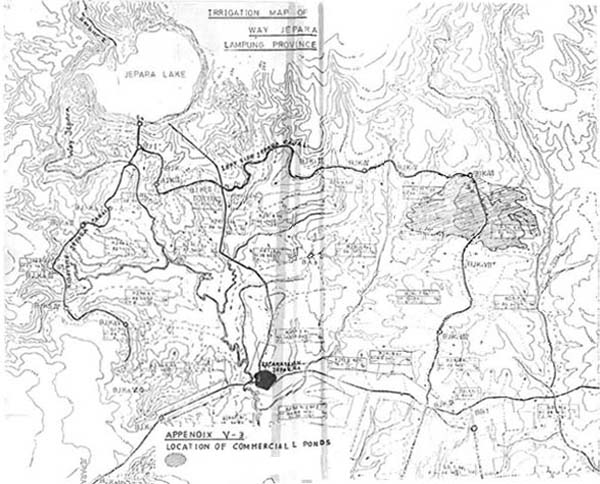
PROPOSED GENERAL LAY OUT OF COMMERCIAL POND
(one 18 ha. Block for 3 ha. Family unit each)
 | Notes :
|
(1) Ponds
The areal-extent of a pond for each family-head is 3 hectares.
In order to construct the ponds, digging and pilling of soil are required, as well as construction of dikes and local channels.
If the average digging depth is 1 metre, then the total quantity of soil to be dug/ moved, is 30,000 cubic metres.
The digging/ moving cost is estimated at Rp. 250. per cubic metre.
(2) Water Channels
A main channel for flowing the water from the irrigation channel to the ponds, should be constructed. Its length is estimated at 9,000 metres.
The average construction cost of the channels is Rp. 2,500.-- per metre.
(3) Water gates
It is estimated, that each family-head will require two main water gates.
The estimated construction cost is Rp. 100,000.--.
(4) Houses for farmers
The land extent for housing to be provided is 24 × 25 square metres = 600 square metres.
The extent of each house to be constructed is approximately 60 square metres.
The house construction is simple, the building is made of planks, the roof of zinc, the floor of soil, with a well.
The estimated construction cost for the houses is Rp. 300,000.-- per unit.
(5) Shrimp Catching Equipments
2 nets valued at Rp. 50,000.--.
(6) Small Weighing Scales
Suspension scale type.
With a capacity of 110 kilograms.
The price per unit is Rp. 15,000.--.
(7) Building for Shrimp Processing
Space for washing-, cutting-off the heads- and sortation of the shrimps, before they are marketed, with a building measurement of 9 × 5 square metres, and an estimated construction cost of Rp. 40,000.-- per square metre.
(8) Insulated rooms and their building
The areal-extent of the insulated rooms is 2 × (2 × 3) square metres of 2 × 6 square metres, with a cost of approximately Rp. 50,000.-- per square metre.
The building required has a measurement of 5 × 6 square metres, with a construction cost of Rp. 40,000.-- per square metre.
(9) Artesian well and installation
Water for the shrimp processing is taken from an artesian well. A water reservoir for water storage, should be constructed.
A water pump is also required. The estimated construction cost of this water installation is Rp. 2,500,000.--.
(10) Generating Set
One unit with a capacity of 5 KVA will be used.
The price is approximately Rp. 2,500,000.--, including the installation cost.
(11) Insulated Trucks
2 units of 2 tons each will be used. The price per unit is Rp. 3,500,000.--.
(12) Feed Making Machine
One set will be used with a price of Rp. 2,500,000.--.
Appendix V. 12.
(13) Office Building
An office building for the Primary Fisheries Cooperative should be constructed.
The areal-extent is approximately 25 square metres with an estimated construction cost of Rp. 40,000.-- per square metre.
On the basis of a test conducted by the Directorate General of Fisheries at Singaparna, the weight increases of giant fresh water prawn are as follows :
| - 8 – 30 days age | : | the average weight is 1.2 grams. |
| - 30 – 60 days age | : | the average weight is 2.1 grams. |
| - 60 – 90 days age | : | the average weight is 10.5 grams. |
| - 90 – 120 days age | : | the average weight is 20.5 grams. |
The additional feed quantities provided per day should be changed according to the body-weight of the shrimps.
Based on a test conducted by the Inland Fisheries Research Institute at Singaparna, the feed supply is as follows :
| - in the Ist. month | : | 40 pct. of the total weight of the scattered population. |
| - in the IInd. month | : | 15 pct. of the estimated weight of the population. |
| - in the IIIrd. month | : | 4 pct. of the estimated weight of the remaining population. |
| - in the IVth. month | : | 3 pct. of the estimated weight of the still-living population. |
| - in the Vth. month | : | 2 pct. of the estimated weight of the remaining population. |
On the basis of the above data, and by estimating the monthly mortality, the shrimp feed requirement for the Commercial Ponds can be calculated.
Ist. Alternative with an estimated catch of 1,350 kilograms/ hectare/year.
| Month | Feed Quantity provided (pct. of body weight) | Mortality-rate (pct) | Average weight per shrimp (grams) | Number weight of shrimp (in thousand pieces) | Total weight of shrimp (kgs) | Feed Quantity per day (kgs) | Feed Quantity per month (kgs) |
| I | 30 | 35 | 1.2 | 32.5 | 39 | 11.7 | 351 |
| II | 15 | 25 | 2.1 | 24.3 | 31.1 | 7.7 | 231 |
| III | 4 | 10 | 10.5 | 21.9 | 230 | 9.2 | 276 |
| IV | 3 | 9 | 20.5 | 20 | 410 | 12.3 | 369 |
| V | 2 | 5 | 28 | 19 | 532 | 10.6 | 318 |
| VI | 2 | 5 | 35 | 18 | 630 | 12.6 | 378 |
The feed quantity provided for a pond of 1 hectare for 6 months is 1,923 kilograms, or in 1 year : 3, 846 kilograms.
The estimated feed quantity to be provided for ponds with an areal-extent of 90 hectares is 346,140 tons.
IInd. Alternative with an estimated catch of 2,000 kilograms/ hectare/year.
| Month | Feed Quantity provided (pct. of body weight) | Mortality-rate (pct) | Average weight per shrimp (grms) | Number of shrimp (in thousand pieces) | Total weight of shrimp (kgs) | Feed Quantity per day (kgs) | Feed Quantity per month (kgs) |
| I | 30 | 30 | 1.4 | 35 | 49 | 14.7 | 441 |
| II | 15 | 15 | 2.5 | 30 | 75 | 11.3 | 339 |
| III | 4 | 10 | 15 | 27 | 405 | 16.2 | 486 |
| IV | 3 | 9 | 27.5 | 24.5 | 673 | 20.3 | 609 |
| V | 2 | 5 | 34 | 23.5 | 799 | 16.0 | 480 |
| VI | 2 | 5 | 45 | 22.3 | 1000 | 20.0 | 600 |
The feed quantity provided for a pond of 1 hectare for 6 months is 2,955 kilograms, or in one year : 5,910 kilograms.
The estimated feed quantity to be provided for ponds with an areal-extent of 90 hectares is 531.9 tons.
| No. | I t e m s | Unit | Rp. 000 |
| A. | Land | 7 has | 3.500 |
| B. | Hatchery pond | ||
| 1. Sea water reservoir | 1 Unit | 4.000 | |
| 2. Fresh water reservoir | 8 Units | 4.000 | |
| 3. Rearing tank | 8 Units | 1.600 | |
| 4. Juvenile tank | 3 Units | 3.000 | |
| 5. Larva tank | 6 Units | 6.000 | |
| 6. Adaptation tank | 5 Units | 2.500 | |
| 7. Alga tank | 4 Units | 1.600 | |
| 8. Gravied shrimp pond | 1 Unit | 8.600 | |
| 9. Water mixing tank | 1 Unit | 500 | |
Sub Total | 31.800 | ||
| C. | Buildings | ||
| 1. Glass roofed house (room) | 1 Unit | 10.500 | |
| 2. Laboratory & office | 1 Unit | 9.000 | |
| 3. Storage | 1 Unit | 2.000 | |
| 4. Machine house | 1 Unit | 1.400 | |
| 5. Housing for staffs | 9.000 | ||
| 6. Work shops | 1.000 | ||
| 7. Roads | 3.000 | ||
| 8. Fence | 2.400 | ||
| 9. Artesian well | 2.500 | ||
Sub Total | 40.800 | ||
| D. | Machinery and equipments | ||
| 1. Diesel genset | 2 Units | 10.000 | |
| 2. Compressor/blower | 1 Unit | 2.000 | |
| 3. Pelletizer machinery | 1 Unit | 500 | |
| 4. Salt water pump | 1 Unit | 1.000 | |
| 5. Fresh water pump | 1 Unit | 900 | |
| 6. Pipes installation | 2.000 | ||
Sub Total | 16.400 | ||
| E. | Vehicles | ||
| 1. Mini truck (1 Unit) | 3.000 | ||
| 2. Jeep (1 Unit) | 4.000 | ||
Sub Total | 7.000 | ||
| F. | Equipments | ||
| 1. Laboratory equipments | 7.000 | ||
| 2. Office equipments | 3.000 | ||
| 3. Hatchery equipments | 2.500 | ||
| 4. Workshop equipments | 1.000 | ||
| 5. Housing equipments | 2.000 | ||
| 6. Transportation equipments | 200 | ||
Sub total | 16.200 | ||
| G. | Pre Operating Expenses (exluded interest) | 74.920 | |
Total Investment Cost | 190.620 |
| No. | I t e m s | Quantity | Rp. 000 |
| A. | Land | 105 has | 52.500,- |
| B. | Buildings | ||
| 1. Genset Building | 30 Units | 640,- | |
| 2. Pond farmers' housing | 1 Unit | 9.000,- | |
| 3. Insulated romm | 1 Unit | 1.200,- | |
| 4. Fresh water reservoir | 1 Unit | 1.500,- | |
| 5. Shrimp processing units | 1 Unit | 1.800,- | |
| 6. Artesian well | 1 Unit | 2.500,- | |
| 7. Office and pelletizer | 1.000,- | ||
| 8. Ponds | 225.000,- | ||
| 9. Canals | 22.500,- | ||
Sub total | 265.140,- | ||
| C. | Machinery and equipments. | ||
| 1. Diesel Generator set | 2.500,- | ||
| 2. Pumps | 250,- | ||
| 3. Insulated room | 1.200,- | ||
| 4. Pelletizer machinery | 2.500,- | ||
Sub total | 6.450,- | ||
| D. | Equipments. | ||
| 1. Shrimp catching nets | 30 Units | 1.500,- | |
| 2. Gates | 30 Units | 3.000,- | |
| 3. Scales | 30 Units | 450,- | |
| 4. Shrimp processing units | 1.500,- | ||
| 5. Office equipments | 500,- | ||
| 6.950, | |||
| E. | Vehicles | ||
| - Insulated truck | 2 Units | 7.000, | |
| F. | PreOperating expenses (exluded interest) | 5.280,- | |
Total Investment Costs | Rp. 343.320, |
(in thousands Rp.)
| No. | Items | Investment Value | Life Estimation | Estimate of Residual Value | Maintenance Cost | Insurance Cost | Equipments Cost | Depreciation Cost | Marketing Alternative I | Marketing Alter nativeII |
| A. | Land | |||||||||
| B. | Buildings | 52.500 | - | 52.500 | - | - | - | - | - | - |
| 1. Diesel Genset Buildings | 640 | 10 years | 40 | 12,8 | 4 | - | 60 | 76,8 | - | |
| 2. Pond Farmers' housing | 9.000 | 10 years | 1.000 | 180 | - | - | *) | 1.025 | - | |
| 3. Insulated Room | 1.200 | 10 years | 200 | 24 | 6 | 100 | 130 | |||
| 4. Fresh water reservoir | 1.500 | 20 years | - | 30 | - | - | 75 | 112,5 | - | |
| 5. Shrimp processing Unit | 1.800 | 10 years | 100 | 36 | - | - | 170 | 215 | ||
| 6. Artesian Well | 2.500 | 20 years | 100 | 50 | - | - | 120 | 1.825 | - | |
| 7. Office Buildings | 1.000 | 10 years | 100 | 20 | - | - | 90 | 115 | - | |
| 8. Ponds | 225.000 | 50 years | 125.000 | 4.500 | - | - | 2000 | 6.500 | - | |
| 9. Water works | 22.500 | 50 years | 2.500 | 450 | 400 | 850 | ||||
| C. | Machinery, Equipments & Vehicles | |||||||||
| 1. Generating Set | 2.500 | 8 year | 100 | 125 | 25 | - | 300 | 450 | - | |
| 2. Pumps | 250 | 8 year | 50 | 12,5 | 25 | 40 | ||||
| 3. Insulated room | 1.200 | 8 years | 60 | 6 | 150 | 216 | ||||
| 4. Insulated Trucks | 7.000 | 8 years | 600 | 300 | 140 | - | 800 | - | 1.220 | |
| 5. Pelletizer machines | 2.500 | 8 year | 100 | 125 | 25 | - | 300 | 450 | ||
| D. | Equipments | |||||||||
| 1. Shrimp catching nets | 1.500 | 2 year | - | - | - | 500 | - | 500 | - | |
| 2. Water gates | 3.000 | 2 year | - | - | - | 500 | - | 500 | - | |
| 3. Scales | 450 | 10 years | 50 | - | - | - | 40 | 40 | - | |
| 4. Shrimp processing Units | 1.500 | 18 years | 300 | 150 | 150 | 300 | ||||
| 5. Office Equipments | 500 | 8 year | 100 | 50 | 40 | 90 | ||||
| E. | Pre Operating Expanses | 5.280 | 5 year | - | - | - | - | 1.056 | 1.056 | - |
| 6.235 3 | 1.206 | 1.000 | 5.876 | 12.630 | 2.081 |
Note : In Alternative I, shrimps are sold in ponds. In this case particular tools are not used.
In alternative II, shrimps are sold in Jakarta and the additional investment will be
Rp. 1,200 + Rp. 1,800 + Rp. 1,200 + Rp. 7,000 + Rp. 1,500 = Rp 12,700
*) Depreciation of the farmers' house is not calculated since it is given to them.
| No. | Items | Unit | Rp. 000 | Life Estimation | Residual Value | Maintenance Cost | Insurance Cost | Equipments Cost | Depreciation Cost |
| A. | Land | 3.500 | Unlimited | 3.500 | |||||
| B. | Hatchery Ponds | ||||||||
| 1. Sea Water reservoir | 1 Unit | 4.000 | 15 year | 400 | 80 | 20 | 240 | ||
| 2. Fresh water reservoir | 8 Unit | 4.000 | 20 year | 1.000 | 80 | 20 | 150 | ||
| 3. Rearing tank | 8 Unit | 1.600 | 15 year | 100 | 32 | 8 | 100 | ||
| 4. Juvenile tank | 3 Unit | 3.000 | 15 year | 60 | 15 | 200 | |||
| 5. Larva tank | 6 Unit | 6.000 | 15 year | 120 | 30 | 400 | |||
| 6. Adaption tank | 5 Unit | 2.500 | 20 year | 500 | 50 | 12.5 | 100 | ||
| 7. Alga tank | 4 Unit | 1.600 | 15 year | 100 | 32 | 8 | 100 | ||
| 8. Gravied shrimp pond | 1 Unit | 8.600 | 20 year | 1.600 | 172 | 43 | 350 | ||
| 9. Water mixing tank | 1 Unit | 500 | 20 year | 10 | 2,5 | 25 | |||
| C. | Machinery & equipments | ||||||||
| 1. Diesel Genset | 2 Unit | 10.000 | 8 year | 1.000 | 500 | 100 | 1.125 | ||
| 2. Compressor/Blower | 1 Unit | 2.000 | 8 year | 100 | 20 | 250 | |||
| 3. Pelletizer | 1 Unit | 500 | 8 year | 100 | 25 | 5 | 50 | ||
| 4. Sea water pump | 2 Unit | 1.000 | 8 year | 50 | 10 | 125 | |||
| 5. Fresh water pump | 3 Unit | 900 | 8 year | 100 | 18 | 9 | 100 | ||
| 6. Pipes installation | 2.000 | 8 year | 40 | 20 | 250 | ||||
| D. | Buildings | ||||||||
| 1. Glass roofed house | 1 Unit | 10.500 | 8 year | 500 | 210 | 52,5 | 1.250 | ||
| 2. Laboratory/office | 1 Unit | 9.000 | 10 year | 1,000 | 180 | 45 | 800 | ||
| 3. Storage | 1 Unit | 2.000 | 10 year | 200 | 40 | 10 | 180 | ||
| 4. Machinery buildings | 1.400 | 10 year | 150 | 28 | 7 | 125 | |||
| 5. Staffs' housing | 9.000 | 10 year | 1.000 | 180 | 45 | 800 | |||
| 6. Workshop | 1.000 | 10 year | 100 | 20 | 5 | 90 | |||
| 7. Roads | + 1000 m2 | 3.000 | 10 year | 500 | 60 | 15 | 250 | ||
| 8. Fense | 2.400 | 10 year | 48 | 12 | 240 | ||||
| 9. Fresh Water Well | 2.500 | 20 year | 100 | 50 | 12,5 | 120 | |||
| E. | Vehicles | ||||||||
| 1. Mini trucks | 1 Unit | 3.000 | 8 year | 600 | 150 | 30 | 300 | ||
| 2. Jeeps | 1 Unit | 4.000 | 8 year | 800 | 200 | 40 | 400 | ||
| F. | Equipments | ||||||||
| 1. Laboratory equipments | 7.000 | 8 year | 1.000 | 350 | 140 | 750 | |||
| 2. Office -"- | 3.000 | 8 year | 600 | 150 | 300 | ||||
| 3. Hatchery -"- | 2.500 | 4 year | 100 | 125 | 500 | ||||
| 4. Workshop -"- | 1.000 | 8 year | 200 | 100 | 100 | ||||
| 5. Housing -"- | 2.500 | 8 year | 100 | 125 | 300 | ||||
| 6. Transportation " (plastic tube) | 200 | 3 year | 20 | 100 | |||||
| G. | Pre Operating expenses excluded interest | 74.920 | 5 year | 18.730 | |||||
| T o t a l | 190.620 | 3,385 | 737 | 600 | 28.300 | ||||
| Items | Price Per Kgs | Year I | Year II | Year III | Year IV | Year V | Year VI | Year VII | ||||||||
| Kgs | Rp. | Kgs | Rp. | Kgs. | Rp. | Kgs. | Rp. | Kgs. | Rp. | Kgs. | Rp. | Kgs. | Rp. | |||
| A. | Hatchery. | |||||||||||||||
| 1. Gravied Shrimp pnds. | ||||||||||||||||
| Broiler Starter | Rp. 100,- | 1.800 | 180 | 1.800 | 180 | 1.800 | 180 | 1800 | 180 | 1800 | 180 | 1.800 | 180 | 1.800 | 180 | |
| Urea Fertilizer | 60,- | 300 | 18 | 300 | 18 | 300 | 18 | 300 | 18 | 300 | 18 | 300 | 18 | |||
| Manure (dung) | 10,- | 600 | 6 | 600 | 6 | 600 | 6 | 600 | 6 | 600 | 6 | 600 | 6 | |||
| 2. Larva and Juvenille | ||||||||||||||||
| Plancton & fish | 4.500 | 4.500 | 4.500 | 4.500 | 4.500 | 4.500 | ||||||||||
| powder | 4.704 | 4.704 | 4.704 | 4.704 | 4.704 | 4.704 | ||||||||||
| B. | Commersial Pond | |||||||||||||||
| 1. Broiler Starter | ||||||||||||||||
| Alternative I | Rp. 400,- | 103.842 | 10.384 | 207.684 | 20.768 | 242.298 | 24.229 | 276.912 | 27.691 | 311.526 | 31.153 | 346.140 | 34.684 | |||
| Alternative II. | Rp. 100,- | 159.510 | 15.957 | 319.140 | 31.914 | 372.330 | 37.233 | 372.330 | 37.233 | 425.520 | 42.552 | 531.900 | 35.190 | |||
| 2. Manure (dung) | Rp. 10,- | 27.000 | 270 | 27.000 | 270 | 27.000 | 270 | 27.000 | 270 | 27.000 | 270 | 27.000 | 270 | |||
| 3. UreaFertilizer | Rp. 60,- | 13.500 | 810 | 13.500 | 810 | 13.500 | 810 | 13.500 | 810 | 13.500 | 810 | 13.500 | 810 | |||
| Total Alt. I. | 11.464 | 21.848 | 25.309 | 28.771 | 32.233 | 35.694 | ||||||||||
| Total Alt. II. | 17.037 | 32.994 | 38.313 | 38.313 | 43.632 | 54.270 | ||||||||||
| Persons | Monthly Salary per person | Monthly Salaries | Salaries per annum | |||
| I. | Hatchery | |||||
| A. | Executive & Administration | |||||
| 1. Management | 1 | 80,000 | 80,000 | 960,000 | ||
| 2. Division Heads | 1 | 60,000 | 60,000 | 720,000 | ||
| 3. Section Heads | 3 | 40,000 | 120,000 | 1,440,000 | ||
| 4. Administrations Perseonil | 2 | 30,000 | 60,000 | 720,000 | ||
| 5. Consumen labourert | 12 | 20,000 | 240,000 | 2,880,000 | ||
| Sub-Total | 19 | 560,000 | 6,720,000 | |||
| B. | Operation | |||||
| 1. Division Heads | 5 | 60,000 | 300,000 | 3,600,000 | ||
| 2. Section Heads | 8 | 37,500 | 300,000 | 3,600,000 | ||
| 3. Staffs | 12 | 32,500 | 390,000 | 4,680,000 | ||
| 4. Drivers | 2 | 30,000 | 60,000 | 720,000 | ||
| 5. Assistant driver | 1 | 20,000 | 20,000 | 240,000 | ||
| Sub-total | 28 | 1070,000 | 12,840,000 | |||
| Total | 47 | 1630,000 | 19,560,000 | |||
| II. | Primary Fisheries Cooperative | |||||
| A. | Executive & Administration | |||||
| 1. Manager | 2 | 60,000 | 120,000 | 1,440,000 | ||
| 2. Division Heads | 1 | 40,000 | 40,000 | 480,000 | ||
| 3. Section Heads | 3 | 30,000 | 90,000 | 1,080,000 | ||
| 4. Administration Personnel | 2 | 25,000 | 50,000 | 600,000 | ||
| Sub-total | 8 | 300,000 | 3,600,000 | |||
| B. | Operation | |||||
| 1. Division Heads | 2 | 50,000 | 100,000 | 1,200,000 | ||
| 2. Section Heads | 4 | 30,000 | 120,000 | 1,440,000 | ||
| 3. Driver | 2 | 30,000 | 60,000 | 720,000 | ||
| 4. Technical Personnel | 2 | 25,000 | 50,000 | 600,000 | ||
| 5. Assistant Driver | 2 | 20,000 | 40,000 | 480,000 | ||
| Sub-total | 12 | 370,000 | 4,440,000 | |||
| Total | 20 | 670,000 | 8,040,000 | |||
(in thousand Rupiahs).
| I t e m s | Month 1 – 12 | Month 13 – 16 | Month 17 – 20 | Month 21 – 24 | Month 25 – 28 | Month 29 – 32 | Last Month to 32 | Total. | |
| A. | HATCHERY | ||||||||
| 1. Pre Operating Expenses | 400 | 100 | 100 | 100 | 100 | 37.600 | 36.520 | 74.920 | |
| 2. Land | 3.500 | - | -- | - | - | 3.500 | |||
| 3. Buildings | - | 20.400 | 20.400 | - | - | 40.800 | |||
| 4. Rearing Tank | - | -- | 31.800 | 31.800 | |||||
| 5. Machines & Equipments | 16.400 | 16.400 | |||||||
| 6. Vechicles | 3.000 | 4.000 | 7.000 | ||||||
| 7. Tools. | 16.200 | 16.200 | |||||||
| Total | 6.900 | 20.500 | 20.500 | 31.900 | 32.700 | 41.600 | 36.520 | 190.620 | |
| B. | COOPERATIVE | ||||||||
| 1. Pre Operating Expenses | 3(0 | 4.500 | 120 | 120 | 120 | 120 | - | 5.280 | |
| 2. Land | 52.5(0 | 52.500 | |||||||
| 3. Buildings | 70.880 | 70.880 | 70.880 | 44.500 | 8.00 | 265.140 | |||
| 4. Machines & Equipments | 3.450 | 3.000 | 6.450 | ||||||
| 5. Vechicles | 7.000 | 7.000 | |||||||
| 6. Tools | 6.950 | 6.950 | |||||||
| Total | 52.800 | 75.380 | 71.000 | 71.000 | 48.070 | 7.070 | 18.000 | 343.320 | |
(000 rupiah)
| Description | Total Juvenile | ||
| 9,000,000 Unit | 18.000,000 Unit | ||
| 1. | Food Stuff | Rp. 4,704.- | Rp. 9,408.- |
| 2. | Gravied shrimp | 500.- | 1,000.- |
| 3. | Labor Cost | 365.- | 730.- |
| Direct Costs | Rp. 5,569.- | Rp. 11,138.- | |
| 4. | Fuel & Lubrication | Rp. 1,429.- | Rp. 1,429.- |
| 5. | Maintenance | 3,385.- | 3,385.- |
| 6. | Insurance expence | 737.- | 737.- |
| 7. | Tools | 600.- | 600.- |
| 8. | Wages & Salaries | 19,560.- | 19,560.- |
| 9. | Research & Development | 1,800.- | 1,800.- |
| 10. | Administration expense | 1,440.- | 1,440.- |
| Out of pocket cost | Rp. 34,520.- | Rp. 40,089.- + | |
| 11. | Depreciation & Amortization expense | Rp. 28,300.- | Rp. 28,300.- |
| Total Cost | Rp. 62,820.- | Rp. 68,389.- | |
| A. | Direct Cost per Unit | 0.62 | 0.62 |
| B. | Out of pocket cost per unit | 3.84 | 2.28 |
| C. | Total Cost per Unit | 6.98 | 3.80 |
| *) The capital consists of: | : | |
Investment | : | Rp. 190,620,000.- |
Working Capital | : | Rp. 34,520,000.- |
| Rp. 225,140,000.- | ||
Rounded up | Rp. 226,000,000.- |
Note: The juvenile is sold to the cooperative at the price of Rp. 4.-- and the cooperative sold to the member at the price of Rp.4.50
(in thousands rupiahs)
| Description | Year I | Year II | Year III | Year IV | Year V | Year VI | ||||||
| Alt.I | Alt.II | Alt.I | Alt.II | Alt.I | Alt.II | Alt.I | Alt.II | Alt.I | Alt.II | Alt.I | Alt.II | |
| Sales (c.o.d. Jakarta) | 52,853 | 78,300 | 105,705 | 156,600 | 123,323 | 182,700 | 140,940 | 208,800 | 158,558 | 234,900 | 176,175 | 261,000 |
| Cost of Sales : | ||||||||||||
| - Sales Revenue (if goods sold in Lampung | 43,740 | 64,800 | 87,480 | 129,600 | 102,060 | 151,200 | 116,640 | 172,800 | 131,220 | 194,400 | 145,800 | 216,000 |
| - Processing Cost, Ice consumption, packing and transportation expense | 5,103 | 7,560 | 10,206 | 15,120 | 11,907 | 17,640 | 13,608 | 20,160 | 15,309 | 22,680 | 17,100 | 25,200 |
| 48,843 | 72,360 | 97,686 | 144,720 | 113,967 | 168,840 | 130,248 | 192,960 | 146,529 | 217,080 | 162,900 | 241,200 | |
| Increase in Marginal income | 4,010 | 5,940 | 8,019 | 11,880 | 9,356 | 13,860 | 10,692 | 15,840 | 12,029 | 17,820 | 13,275 | 19,800 |
| Increase in Marketing Expenses. | ||||||||||||
| Maintenance Insurance and depreciation expense of Equipment | 2,081 | 2,081 | 2,081 | 2,081 | 2,081 | 2,081 | 2,081 | 2,081 | 2,081 | 2,081 | 2,081 | 2,081 |
| Salaries expense (4 men) | 1,920 | 1,920 | 1,920 | 1,920 | 1,920 | 1,920 | 1,920 | 1,920 | 1,920 | 1,920 | 1,920 | 1,920 |
| Sub Total | 4,001 | 4,001 | 4,001 | 4,001 | 4,001 | 4,001 | 4,001 | 4,001 | 4,001 | 4,001 | 4,001 | 4,001 |
| Additional profit (before | 9 | 1,939 | 4,018 | 7,879 | 5,355 | 9,859 | 6,691 | 11,839 | 8,028 | 13,819 | 9.274 | 15,799 |
| Interest expense (12% × Rp. 12 Rp. 12,700,000) | 1,524 | 1,524 | 1,524 | 1,524 | 1,524 | 1,524 | 1,524 | 1,524 | 1,524 | 1,524 | 1,524 | 1,524 |
| let Additional profit or loss | (1,515) | 415 | 2,592 | 6,355 | 3,831 | 8,355 | 5,167 | 10,315 | 6,504 | 12,295 | 7,750 | 14,279 |
( thousand Rupiahs).
| Descriptions | Year I(50%) | Year II(60%) | Year III(70%) | Year IV(80%) | Year V(90%) | Year VI(100%) | ||||||
| Alt. I | Alt. II | Alt. I | Alt. II | Alt. I | Alt. II | Alt. I | Alt. II | Alt. I | Alt. II | Alt. I | Alt. II | |
| - Harvest | 1215 kg. | 1800 kg. | 2430 kg. | 3600 kg. | 2835 kg. | 4200 kg. | 3240 kg. | 4800 kg. | 3645 kg. | 5400 kg. | 4050 kg. | 6000 kg |
| - Food Consumens | 346 kg. | 5317 kg. | 6923 kg. | 10638 kg. | 8077 kg. | 12411 kg. | 9230 kg. | 14184 kg. | 10384 kg. | 15957 kg. | 11538 kg. | 17730 kg. |
| - Juvenil Consumens | 300.000 | 300.000 | 300.000 | 300.000 | 300.000 | 300.000 | 300.000 | 300.000 | 300.000 | 300.000 | 300.000 | 300.000 |
| Rp.1.458 | 2.160 | 2.916 | 1.320 | 3.402 | 5.040 | 3.888 | 5.760 | 4.374 | 6.480 | 4.860 | 7.200 | |
| Sales. | ||||||||||||
| - Cost | ||||||||||||
- Juvenile | 1.350 | 1.350 | 1.350 | 1.350 | 1.350 | 1.350 | 1.350 | 1.350 | 1.350 | 1.350 | 1.350 | 1.350 |
- Food | 381 | 585 | 762 | 1.170 | 888 | 1.365 | 1.015 | 1.560 | 1.142 | 1.755 | 1.269 | 1.950 |
- Fertilizer | 36 | 36 | 36 | 36 | 36 | 36 | 36 | 36 | 36 | 36 | 36 | 36 |
- Pond Rent (to the Cooperative) | 740 | 740 | 740 | 740 | 740 | 740 | 740 | 740 | 740 | 740 | 740 | 740 |
- Minimum of living Cost (Treated cost labor Cost) | 180 | 180 | 180 | 180 | 180 | 180 | 180 | 180 | 180 | 180 | 180 | 180 |
| Total | 2.587 | 2.891 | 3.063 | 3.476 | 3.194 | 3.671 | 3.321 | 3.866 | 3.502 | 4.061 | 3.575 | 4.256 |
| Net Profit/loss | (1. 12) | (731) | (147) | 844 | 208 | 1.369 | 567 | 1.894 | 872 | 2.419 | 1.285 | 2.944 |
| Net Profit (during the first year juvenile is given free) | 221 | 619 | (147) | 844 | 208 | 1.369 | 567 | 1.894 | 872 | 2.419 | 1.285 | 2.944 |
| Estimate Membership Contribution) | - | - | - | - | - | 750 | - | 1.000 | 500 | 1.500 | 750 | 2.000 |
| Net Profit for the Farmer | 221 | 619 | (147) | 844 | 208 | 619 | 567 | 894 | 372 | 919 | 535 | 944 |
GRAVIED SHRIMP = Induk Udang.
![]()
![]()
![]()