
 |
THA/75/012/WP 7 WATER QUALITY CONDITIONS AS DISEASE RELATED STRESSORS IN CLARIAS POND CULTURE |
by
Vijai Srisuwantach, Rangsarn Soungchomphan and Pathipath Sae-Eng
Programme for the Development of Pond Management Techniques
and Disease Control (DoF - UNDP/FAO THA/75/012)
Thailand
The “Programme for the Development of Pond Management Techniques and Disease Control (THA/75/012)” was implemented in Thailand during 1979–82 as a joint project by the Department of Fisheries (DOF) and UNDP/ FAO. The purpose of the project was to improve DOP support services for Clarias farming through strengthening:
the skills of Fisheries staff in aquaculture disciplines such as disease diagnosis and treatment, pond management and extension,
the research on solutions for problematical aspects of Clarias culture,
the system of relaying problems from the farms to DOF and of transferring improved technologies, and
the equipment and facility base of DOF for working on aquaculture problems.
Although the UNDP/FAO participation was structured to terminate in August 1981, DOF committed continuation of the project to at least August 1982.
This report is one of several Working Papers prepared on various aspects of the project. A list of titles of reports completed in the series is annexed.
Inquiries concerning the subject matter of any particular report should be directed to the author,
c/o The Director
National Inland Fisheries Institute
Kasetsart University Campus
Bangkhen, Bangkok
Thailand
National Inland Fisheries Institute
Bangkok, Thailand
1981
Hyperlinks to non-FAO Internet sites do not imply any official endorsement of or responsibility for the opinions, ideas, data or products presented at these locations, or guarantee the validity of the information provided. The sole purpose of links to non-FAO sites is to indicate further information available on related topics.
This electronic document has been scanned using optical character recognition (OCR) software. FAO declines all responsibility for any discrepancies that may exist between the present document and its original printed version.
3.5 Water Condition Measurements
4.2 Transparency and Suspended Solids
1. Lay-out sketch of the Jalernphorn Farm
2. Temperature conditions of the air and of the water of the ponds
4. Nonfiltrable residue of water
8. Total ammonia nitrogen and un-ionized ammonia
10. Specific growth rate and growth in weight of fish in the two study ponds
WATER QUALITY CONDITIONS AS DISEASE RELATED
STRESSORS IN CLARIAS POND CULTURE1
Vijai Srisuwantach2
Rangsarn Soungchomphan2
Pathipath Sae-Eng3
Quality characteristics of water in two Clarias culture ponds were monitored through a grow-out cycle then assessed as stressors relating to disease and mortality. The two ponds were part of a small-scale commercial fish farm growing Clarias and Ophicephalus. The culture system was representative of the Clarias practice in Thailand where distressed fish and relatively high mortalities are typical.
The two Clarias ponds, about 1,000 m2 each, were stocked with 0.6 g. fingerlings at the rate of 77 and 78/m2 on March 1, 1980. The fish were fed a mixture of ground trash fish and rice bran (9:1) then harvested after 5 months giving yields of 3,931 (3.73 kg/m2) and 5,088 kg (5.3 kg/m2) from pond No. 1 and pond No, 2, respectively. Correspondingly, average weights of harvested fish were 122 and 144 g, food conversion ratios were 6.4 and 4.9, and survival rates were 40.3 and 47.4%. Two incidences of relatively high mortalities were observed at the same time in each pond; the first occurred 49 to 53 days after stocking and the second was during the period 120 to 150 days after stocking. Pathological examination of the distressed and dead fish revealed that they were highly infested with Aeromonas sp. bacteria.
Water conditions in the ponds were characterized by low Secchi disc transparency (av. 9 and 10 cm. through the grow-out period), very little DO (av. late afternoon values over the last 3 months of 0.8 and 1.3 mg/1), generally high CO2 values (in excess of 20 mg/1 through about 60 days of the cycle), high BOD (av2. 8.5 and 8.8 g O2/m3/day), and high un-ionized ammonia (2.2 and 3.0 mg/1, av. through the first 60 days).
3 Fisheries Biologist, Suphanburi Fisheries Station, Suphanburi Province, Thailand.
The occurences of high concentrations of un-ionized ammonia and CO2 along with the low concentrations of DO were considered to be likely environmental stressors relating to fish mortalities. Although actual feeding rates were not determined, plausible rates based on postulated mortalities indicated the fish were underfed during the first 80 days thereby adding the possibility of inadequate nutrition as another stressor in a typical Clarias culture system in Thailand.
The walking catfish (Clarias batrachus Linnaeus), locally known as “pla duk dan”, is an important food fish cultured in Thailand where farming of the species was initiated about 20 years ago. One of the problematical aspects of the culture system is the high incidence of mortality of which all the causes are not yet confirmed. Some studies on the pathology of Clarias in Thailand indicate, however, that much of the moratlity is due to fish succumbing to Aeromonas diseases (Areerat, 1979). Since the Aeromonas pathogens are normal inhabitants of the pond water and mud (Lewis and Bender, 1961) then infestations and even the diseases may be endemic. Succumbing to the diseases thus may occur when the fish are first weakened by environmental stressors or other factors such as malnutrition.
The study herein was undertaken to investigate both the performance of some water quality parameters in typical Clarias ponds and the role of various water conditions as disease related stressors. Field data were collected through a grow-out cycle (March-July, 1980) of Clarias in two ponds on the Jalernphorn Farm in Suphanburi Province. This farm is representative of small-scale commercial aquaculture operations that produce Clarias. The highest concentration of Clarias farms by provinces in Thailand is in Suphanburi Province.
The two study ponds were the only ones in the Jalernphorn Farm complex of 22 ponds (Fig. 1) that were used in 1980 for rearing Clarias. They had been used for either Clarias or Ophicephalus culture over the previous 7 years. Ophicephalus were raised in all other ponds of the complex during the study.
The ponds in the complex were arranged in two banks with 11 ponds per bank. The plan for the farm illustrated that the ponds in one bank were slightly smaller than the ponds in the other bank. The corresponding measurements shown were 20 × 55 m giving a surface area of 1,100 m2 (0.11 ha) and 25 × 63 m with an area of 1,575 m2 (0.15 ha). The two Clarias ponds were in the bank of smaller ponds. Field measurements, however, indicated that the actual sizes of the Clarias differed from the information in the plan; the area of pond No. 1 was 1,044 m2 (0.104 ha) and of pond No. 2 was 960 m2 (0.096 ha).
All ponds were constructed by shallow excavation and using the spoil to create embankments. Each was designed to hold a maximum water depth of 1.2 m.
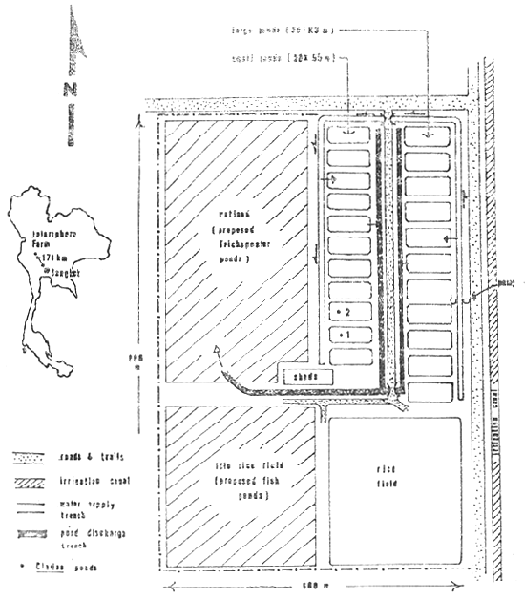
Figure 1: Lay-out sketch of the Jalernphorn Farm. Not to scale.
Supply water was obtained by pumping from an irrigation canal adjoining the farm into a holding pool. From there the water was pumped into a distribution trench that ran adjacent to the banks of ponds. Water was then pumped from the trench into individual ponds.
Discharge from the ponds was released through gates into a discharge trench. This system, however, only allowed water to be drawn off from the surface of the ponds.
Both Clarias ponds were stocked on March 1, 1980 with seed fish averaging 0.6 g in weight and 4.6 cm in length. Pond No. 1 (0.104 ha) was provided with 770,000 fingerlings (77/m2) and pond No. 2 (0.096 ha) with 780,000 fingerlings (78/m2). These fingerlings were purchased from a producer who raised them in the Chacheongsao area of Thailand some 250 km from the Jalernphorn Farm.
The usual practices employed by the farm were used to manage the Clarias crops. The ponds were initially filled to 30 cm then stocked. Within two weeks the water depth was increased to 1.2 m and was maintained at this level through the balance of the grow-out cycle.
A relatively small exchange of water was made daily in each pond. Over a period of about 3 hours, usually during mid-day, water was pumped into the ponds with discharge being released through the surface outlets. When fish appeared distressed or afflicted by disease volumes of water equivalent to the capacities of the ponds was added in an attempt to impart a complete exchange. With the installed discharge system, however, most of the exchange likely only occurred at surface levels.
Feed comprised minced trash fish mixed with rice bran in the proportion of 9:1. Feeding was twice a day, once in the early morning and once in the late afternoon. The amount of a daily ration was determined judgemetally by the farm operator who kept a record of the feed applied.
Sample lots of 50 fish were collected from each pond, anaesthetized, weighed and measured at 10 day intervals through the production cycle. The fish were returned to their respective ponds after the sampling.
Specific growth rates of the fish were calculated from data on the changes of body weight over given time intervals according to the method of Brown (1957) as follows:
 | |
| where: | |
| WT = final weight | |
| Wt = initial weight | |
| T = final time | |
| t = initial time | |
| G = specific growth rate expressed as per cent per unit of time. | |
Pond No. 1 was harvested on August 7 and pond No. 2 on July 30. Numbers were determined which allowed estimates of mortality. Data on the weight of fish yielded contributed to estimates on production, growth and food conversion.
A number of physical, chemical and biological conditions of the water in the ponds was measured every 10 days through the approximately 150 day crop cycle. Most parameters were assessed twice a day, once at 0600 and again at 1700 hours. Some measurements were made in the field and in other cases samples were fixed then analysed in laboratories either at the Suphanburi Fisheries Station or at the National Inland Fisheries Institute, Bangkok.
Total suspended solid (nonfiltrable residue) was filtered in the field. Samples for ammonia nitrogen (NH3-N) were preserved with conc. HCL. Both these parameters were analysed at the National Inland Fisheries Institute (NIFI) in Bangkok.
pH was measured on unfiltered samples using a portable pH meter with glass combination type electrode (Horizon Ecology Co., 5995–30).
CO2 and DO was determined by titration with 0.1 NaOH and the azide modification of the Winkler method respectively (American Public Health Association 1976).
Filter for nonfiltrable residue was dried in an oven maintained at a temperature of 103°–105°C for overnight (APHA 1976).
NH3-N was determined on unfiltered samples by a spectrophotometer (Spectronic 88, Bausch and Lomb) using the phenol-hypochlorite method (Stainton et al., 1977). The concentration of un-ionized ammonia was calculated according to method by Trussell (1972) modified by Colman (1980) for tropical temperatures.
Primary production was measured using the light and dark bottle oxygen method of Gaarder and Gran (1972). Two sets of dark and light bottles (250 ml/BOD bottles) were incubated in situ at the level of 10 cm below the water surface for 10 hrs. (7.00 a.m. to 5.00 p.m.). After incubation, oxygen concentrations were compared at the start of incubation. The readings of two replicate samples were averaged. Oxygen increase in the light bottle was interpreted as a measure of net photosynthesis while oxygen decrease in the dark bottle was taken as a measure of respiration or BOD (Boyd 1979), the sum of these changes represented gross photosynthesis.
Total solar radiation was recorded by means of a bimettalic actinograph (SIAP SO 2,800) mounted on a tower at Suphanburi Fisheries Station, within 20 km of study ponds. Temperature was measured with a YSI telethermometer.
Light transparency of the water in the ponds was measured with a 25 cm diameter Secchi disc.
Data on rainfall in the study area were obtained from the Suphanburi Meteorological Station.
The average daily rainfall in the area of the Jalernphorn Farm through the study period ranged from 0.03 to 4.55 mm/day (Table 1). The period of maximum rainfall was in July.
| Month | Daily rainfall per month (mm/day) | Number of rainy days |
| March | 0.03 | 1 |
| April | 0.25 | 3 |
| May | 1.18 | 8 |
| June | 4.42 | 22 |
| July | 4.55 | 14 |
Air Temperatures recorded (Fig. 2) at the farm varied from 23 to 29 °C in the early morning and from 32 to 43 in the late afternoon.
The temperature of the pond water (Fig. 2) ranged from 26 to 32°C in early morning measurements and from 30 to 35°C in late afternoon measurements in both ponds.
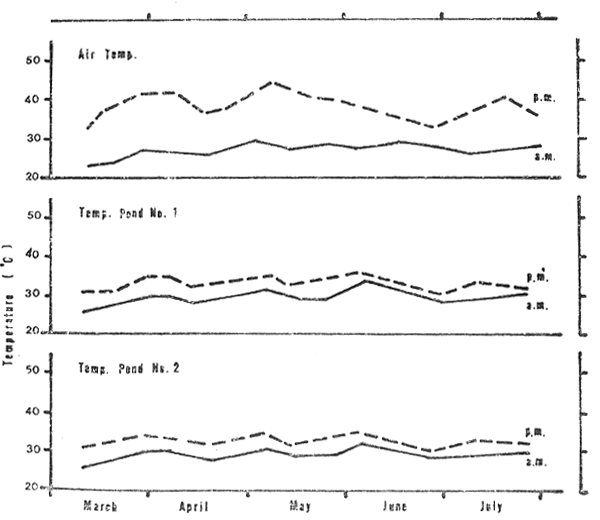
Figure 2: Temperature conditions of the air and of the water of the ponds as recorded early in the morning (a.m.) and late in the afternoon (p.m.) from March through July 1980.
Secchi disc transparencies (Fig. 3) were relatively low throughout the study period. They ranged from 4 to 16 cm in pond No. 1 and from 4 to 20 cm in pond No. 2.
The nonfiltrable residue or the suspended solids in the water (Fig. 4) ranged from 50 to 800 mg/1 (mean 300 mg/1) in the case of pond No. 1 and from 72 to 789 mg/1 (mean 275 mg/1) in pond No. 2. The highest concentrations in both cases were observed in the fourth months of the growing cycle.
Fluctuations in pH (Fig. 5) were similar in both ponds. The early morning values were comparatively low, ranging from 6.0 to 7.8 in pond No. 1 and from 6.0 to 7.6 in pond No. 2, throughout the production cycle. Late afternoon values were markedly high during the first two months (9.1 to 9.6 in pond No. 1 and 6.6 to 9.8 in pond No. 2) and relatively low during the last three months (6.4 to 7.8 in pond No. 1 and 6.6 to 7.6 in pond No. 2).
The absence of late afternoon CO2 (Fig. 6) was found in the first month. High concentration of CO2 occurred both in the early morning (2 to 35 mg/1 in pond No. 1 and 3 to 38 mg/1 in pond No. 2) for the rest of the growing period.
Early morning DO (Fig. 7) was low (0 to 3 mg/1) in both ponds throughout the growing period. Late afternoon DO was high (10 to 22 mg/1 in pond No. 1 and 11 to 16 mg/1 in pond No. 2) in the first month. It tended to decrease in the second month and was never more than 3 mg/1 for the rest of the growing period.
Ammonia concentration (Fig. 8) ranged from 0.4 to 16.6 mg/1 in both ponds. Maximum values occurred on day 79. High un-ionized ammonia (0.5 to 5.9 mg/1 in pond No. 1 and 0.3 to 5.1 mg/1 in pond No. 2) occurred in the first two months (Fig. 8).
High gross primary production (Fig. 9) was found in the first 9 days (7.6 gO2/m3/d in pond No. 1 and 3.2 gO3/m3d in pond No. 2). The gross production rate dropped down after day 19 and remained less than 1.0 g/O2/m3/d for the rest of the growing period.
BOD (Fig. 9) was high throughout the growing season. It ranged from 3.6 to 11.6 gO2/m3/d in pond No. 1 and 4.6 to 14.9 gO2/m3/d in pond No. 2.
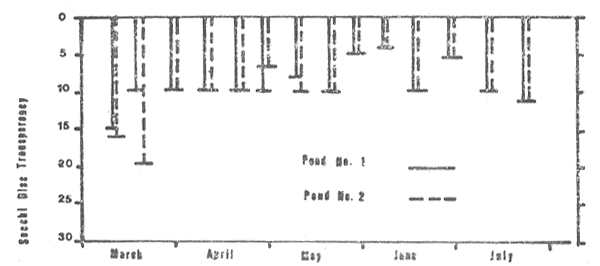
Figure 3: Secchi disc transparencies (p.m. measurements only) in the two study ponds, March through July 1980.
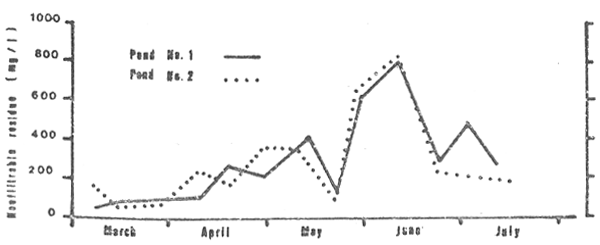
Figure 4: Nonfiltrable residue of water in the two study ponds (p.m. measurements only), March through July 1980.
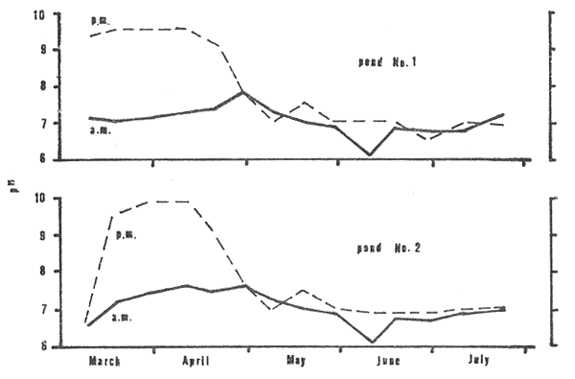
Figure 5: pH as recorded in the morning (a.m.) and the late afternoon (p.m.) from March through July 1980.
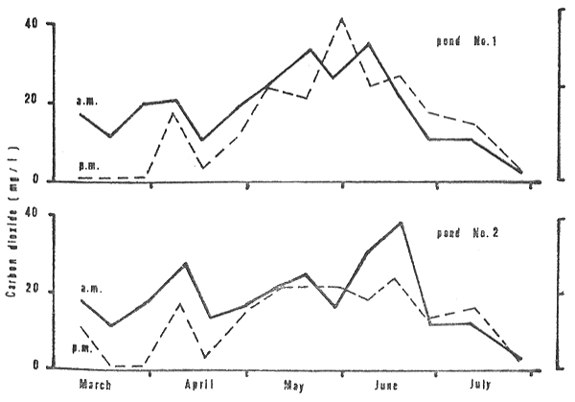
Figure 6: Carbon dioxide, morning (a.m.) and late afternoon (p.m.) measurements, in the two study ponds, March through July 1980.
Noteable incidences of mortality, where relatively large numbers of fish died in a discrete time period, were observed twice in each pond. The outbreaks occurred simultaneously in each pond, from day 49 to 53 and from day 120 to 150. Samples of distressed and dead fish were submitted to the pathology unit of the National Inland Fisheries Institute who reported that the fish were highly infested with Aeromonas sp., bacteria.
Primary data with respect to production assessment are presented in Table 2.
Actual feeding rates were not determined since the mortality between each sampling period was unknown. Rations, however, were increases regularly, except when the fish were distressed, with the amount being determined intuitively by the farm operator. Factors such as the size of the fish, the feeding response and their apparent state of health were determinants affecting the decision on how much food to deliver at anyone time. The amount of food applied in various periods through the grow-out cycle along with the size of the fish (as measured) in each period are presented in Table 3.
Specific growth rates and growth curves of the fish were similar in both ponds and are illustrated in Fig. 10. The former peaked markedly twice in the grow-out cycle, the first time at about day 9 and the second time around day 59. The weight of the fish increased slowly over the first 40 to 45 days then comparatively faster over the balance of the cycle. The fish reached an average weight of 122 g in 160 days and 144 g in 152 days in ponds No. 1 and No. 2 respectively. Corresponding yields were 3,931 and 5,088 kgs.
The survival rates were 40.3% in pond No. 1 and 47.4% in pond No. 2 with corresponding stocking densities of 77 and 78/m2. These rates were significantly higher than those reported in similar studies on Clarias farming operations; Sitasit (1968) showed a survival of 37% when fish were stocked at a density of 180/m2 and Sae-Eng (1979) estimated a survival of 8 to 25% when fish were stocked at densities of 262 to 562/m2.
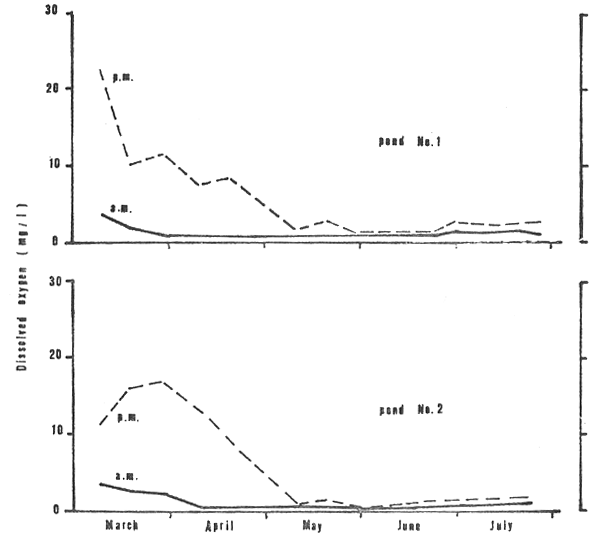
Figure 7: Dissolved oxygen, morning (a.m.) and late afternoon (p.m.), in the two study ponds, March through July 1980.
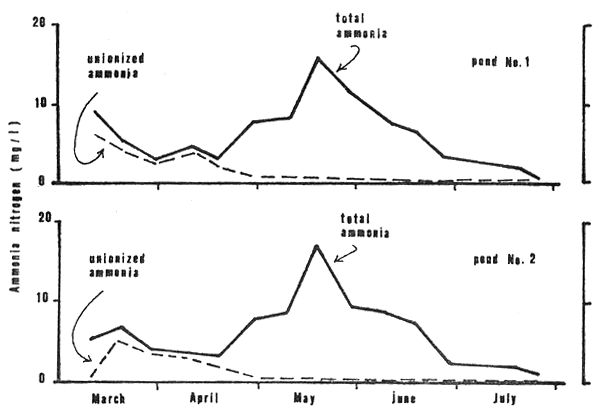
Figure 8: Total ammonia nitrogen and unionized ammonia in the study ponds, late afternoon measurements only, March through July, 1980.
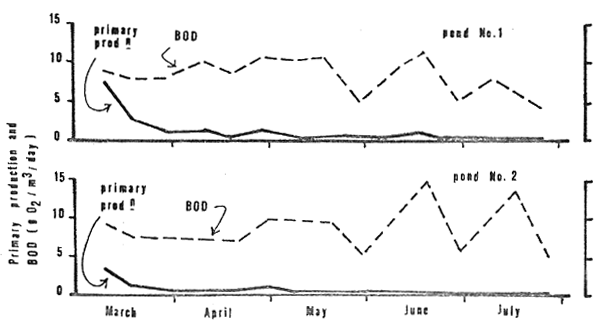
Figure 9: Primary production and BoD in the two study ponds, March through July 1980.
| Pond No. 1 | Pond No. 2 | |
| Size of ponds (m2) | 1,040 | 960 |
| No. fish stocked | 80,000 | 75,000 |
| Stocking rate (no./m2) | 77 | 78 |
| No. fish harvested | 32,240 | 35,520 |
| Harvest rate (no./m2) | 31 | 37 |
| Culture days | 160 | 152 |
| Survival rate (%) | 40.3 | 47.4 |
| Weight of fish stocked: | ||
total (kg) | 3,931 | 5,088 |
av/fish (g) | 122 | 144 |
kg/m2 | 3.78 | 5.3 |
| Weight gain: | ||
per fish (g) | 121.4 | 143.3 |
per m2 (kg) | 3.73 | 5.25 |
per fish/day (g) | 0.76 | 0.94 |
per m2/day (kg) | 0.023 | 0.034 |
| Food input: | ||
total weight (kg) | 25,000 | 25,000 |
total/m2 (kg) | 24.0 | 26.0 |
av/day/m2 (kg) | 0.15 | 0.17 |
| Food Conversion Ratio (FCR) | 6.4 | 4.9 |
| Crop investment: | ||
seed fish (US$0.85/100) | $680 | $638 |
feed (US$0.15/kg) | $3,750 | $3,750 |
| Revenue from fish sales @US$1.5/kg | $5,897 | $7,632 |
| Return to labour, management, operational costs, amortization etc: | ||
total crop | $1,467 | $3,244 |
per m2 | $1.41 | $3.37 |
| Period | Day of grow-out cycle | Total feed in per day (kg) | Fish weight at beginning of each period (g) | |||
| per pond | per m2 | |||||
| Pond no.1 | Pond no.2 | Pond No.1 | Pond No.2 | |||
| Mar.1-Mar.8 | 1–8 | 7.7 | 0.007 | 0.008 | 0.6 | 0.6 |
| Mar.9-Mar.18 | 8–18 | 12.0 | 0.011 | 0.013 | 2.1 | 2.5 |
| Mar.19-Mar.28 | 19–28 | 12.0 | 0.011 | 0.013 | 3.8 | 5.7 |
| Mar.29-Apr.7 | 29–38 | 31.6 | 0.030 | 0.033 | 5.1 | 5.7 |
| Apr.8*-Apr.17 | 39–48 | 40.0 | 0.038 | 0.041 | 10.2 | 7.6 |
| Apr.18*-Apr.27 | 49–58 | 58.0 | 0.055 | 0.60 | 9.9 | 7.4 |
| Apr.28-May 7 | 59–68 | 130.0 | 0.125 | 0.135 | 42.7 | 38.7 |
| May 8-May 17 | 69–78 | 216.0 | 0.207 | 0.225 | 51.2 | 49.6 |
| May 18-May 27 | 79–88 | 294.0 | 0.282 | 0.306 | 61.7 | 58.1 |
| May 28-June 7 | 89–99 | 316.4 | 0.304 | 0.329 | 87.9 | 85.1 |
| June 8-June 17 | 100–109 | 360.0 | 0.346 | 0.375 | 97.4 | 96.9 |
| June 18*-June 27 | 110–119 | 360.0 | 0.346 | 0.375 | - | - |
| June 28*-Jul.8 | 120–130 | 220.0 | 0.211 | 0.229 | - | - |
| Jul.9-Jul.22* | 131–144 | 200.0 | 0.192 | 0.208 | - | - |
| Jul.23-Jul.29 | 145–151 | 150.0 | 0.144 | 0.156 | - | - |
| Jul.30-Aug.6 | 152–159 | 150.0 | 0.144 | - | 120.0 | 160.0 |
* incidence of relatively large mortalities.
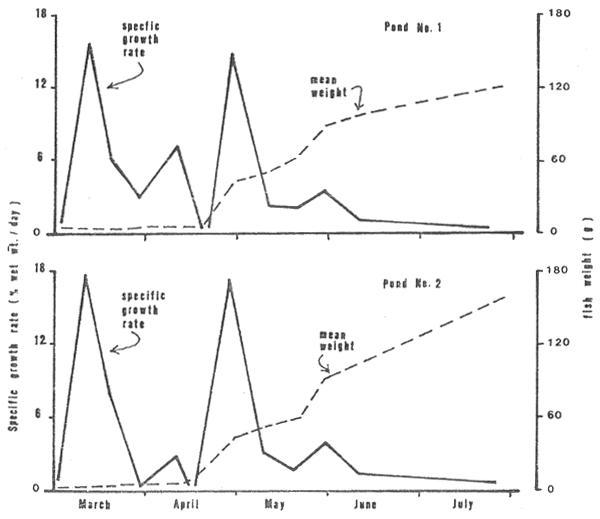
Figure 10: Specific growth rate and growth in weight of fish in the two study ponds, March through July 1980.
Relatively large mortalities are characteristic of the Clarias pond culture system in Thailand. Pathogens such as Aeromonas spp., are generally present, hence, sitting the stage for infectious diseases and resultant mortalities to occur particularly when the fish are stressed and readily succeimb to such diseases (Anon, 1980). Adverse concentrations of un-ionized ammonia, CO2 and possbly oxygen were noteable through parts of the rearing period in the Jalernphorn farms; apart from serving as likely stressors some of these concentrations could have been direct causes of death. In addition, nutritional and density stresses may have also been in play through a part of the rearing cycle.
Two incidences of mortality were particularly evident at the same time in each of the Jalernphorn ponds. The first occurred from about days 45 to 55 and the second from days 115 to 130 (Table 3). They were apparent not only by the presence of floating carcasesses but also by the behaviour of the fish which was generally lethargic even to the point where many would not take feed.
From the outset total ammonia levels prevailed at 3 to 7 mg/l through the first 60 days then increased thereafter (Fig. 8). During days 0 to 60, however, pH values were high, frequently 9+ in daylight hours (Fig. 5), and allowed the release of un-ionized ammonia (NH3) fractions which occurred at concentrations ranging from 2.5 to 6.3.0 mg/l in days 10 to 50 (Fig. 8). The European Inland Fisheries Advisory Commission (1973) states that the toxic levels of NH3 for short-term exposures usually lie between 0.6 and 2.0 mg/l whereas Robinette. (1976) determined that the 24-h TL50 for channel catfish was 2.36 mg/l and Colt et al., (1975) gave the 96-hour LC50 for NH3 to channel catfish as 3.8 mg/l at 30°C. Although toxic levels of NH3 have not been established for Clarias, reference to the above probably indicates concentrations that could be deleterious.
Lloyd and Herbert (1960) showed that the toxicity of NH3 decreases with increasing CO2. From days 30 to 40, CO2 levels rose to around 20 mg/l (Fig. 6) which may have reduced the effect of NH3 at this time. Through the balance of time in the first 60 days, however, CO2 levels ranged considerably lower. The circumstance of high NH3 and low CO2 occurred through much of the first 2 months of rearing. The first incidence of mortality, days 45 to 55, was probably related to the NH3 concentrations. Toxic levels may have been attained at times while prolonged exposure to sublethal concentrations, even as low as 0.12 mg/l in the case of channel catfish as reported by Robinette (loc. cit), likely stressed the fish rendering them vulnerable to infectious diseases.
Concentrations of NH3 through the last 90 days of rearing ranged from 0.01 to 0.5 mg/l and adverse effects were likely less pronounced than in the first 60 days. Although toxic levels were not approached, chronic effects of exposure to sub-lethal concentrations over a long period of time may have had an impact in reducing growth (Hampson 1976) and contributing to the second incidence of mortality.
Clarias, although capable of breathing atmospheric oxygen, still must eliminate about 90% of the metabolic CO2 into the water via the gills and the skin (Singh 1976). The exchange is possible in so far as CO2 concentrations in the water are low enough to allow the flow in a direction from the fish to the water. High concentrations of CO2 in the water will, however, interfere with or even prevent the exchange. As threshold concentrations are approached respiratory stress occurs and a slow-down in metabolism may even be triggered as shown by Singh (loc. cit.). Reduced growth and decreased disease resistance are probable consequences.
The minimum concentrations of CO2 that Clarias can tolerate are undetermined. Because of its physiological adaptations for living in hypoxic and hypercarbic waters, the species undoubtedly has a comparatively high tolerance for CO2 but threshold levels also must occur. In the rearing period from days 60 to 120 CO2 concentrations were consistently in the range of 20 to 40 mg/l (Fig. 6). The hypothesis is advanced that these levels were in the order of threshold levels and the prolonged exposure had chronic affects which were deleterious. Fish weakened by the exposure, perhaps coupled with the chronic affects of sub-lethal NH3 concentrations, succumbed to diseases which manifested in mortalities during the second incidence in days 115 to 130.
Low dissolved oxygen in the water was a prevalent condition throughout the rearing cycle (Fig. 7). Levels close to zero in both the early morning and late afternoon persisted from day 70 onward when photosynthesis had virtually ceased (Fig. 9). High turbidity (Fig. 4), probably caused by fish stirring-up bottom muds, restricted light penetraion and photosynthetic activity. Oxygen depletion occurred as the oxygen demand exceeded supply. Metabolism of the fish and of bacteria decaying organic materials were major contributors to the demand. The average BOD of the study ponds (0.35 and 0.37 mg O2/l/hr) was higher than that of intensive fish culture ponds (0.29 mg O2/l/hr) as reported by Schroeder (1975).
The survival of Clarias is not dependent upon oxygen in the water since it is equiped to obtain oxygen by gulping air (Brown 1957). While inadequate dissolved oxygen is not in itself lethal, it may seriously affect the health of the fish and facilitate the spread of disease. Meyer (1970) for example indicates that the role of low dissolved oxygen levels in promoting bacterial infections is often unsuspected. The second incidence of disease in the Jalernphorn ponds occurred following a long period of extremely low O2 concentrations (Fig. 7). During the last 60 days of rearing the pond water was highly turbid and hypoxic, conditions unfacourable for gaseous exchange across the gills thus limiting the uptake of O2 from whatever was available in the water. The fish were therefore forced to resort to resort to aerial respiration.
Hughes (1976) states that the frequency of air breaths is related to the O2 and CO2 content of the water and increases as O2 decreases. With the low levels of O2 that occurred then the requirement for aerial respiration was undoubtedly high demanding considerable energy to complete the vertical trips. Whether or not these conditions created respiratory stress can be moot since the energy for the exercise was at the expense of growth and production in the aquaculture system. On the other hand, high levels of CO2 may have stimulated a reduction in metabolism, as discussed above, and lessened the demand for O2 with both the CO2 and O2 levels interacting as a stressor. Whatever prevailed it is apparent that production in the system was minimized during the last 60 days due to both retarded performance of the fish, as perhaps indicated by the reduced slope of the weight curves in Fig. 10, and mortalities.
Fundamental laws governing the growth rate of animals, which decreases as age increases, prescribe that the amount of food required increases as the size increases, but the percentage required decreases (Brown 1957). The feeding practice in the study ponds, however, was structured as a constant rate based on about 5% of feed (by weight) per day of the body weight of the fish. In the grow-out stage of Clarias culture the fish are advanced from fingerlings to sub-adults or occasionally adults. Equating this phase of development to established practices in rearing channel catfish (Swingle 1968) and trout (Buterbaugh and Willoughby 1967) indicates that feeding rates should be 2 to 2.5 times higher through the beginning of the phase than at the latter part of the phase.
In practice, the amount of feed delivered to the study ponds was subject to some adjustment as determined judgementally by the farm operator. Deviations from the base rate of 5% were, however, relatively small except in the case that diseased fish were given little food. There thus was a tendency to under-feed young fish and incite nutritional stresses while overfeeding older fish and contributing to water degradation and NH3 and CO2 stresses. Each may have had manifestations in promoting disease and deaths in both incidences of mortality and in reducing the performance of fish.
Comparative data on the growth rate of C. batrachus are limited as is reference to indicate performance expectations under various circumstances. The average growth rates of 4.98 and 5.07% wet weight and the average daily increment in weight per fish of 0.76 and 0.94 g from the study ponds are similar to those of reported for Clarias from other operations in Thailand (viz., 0.9 g/day by Eng 1979 and 1.0 g/day by Sitasit 1968). These similarities may reflect the performance that is allowed in the Clarias culture system in Thailand with its present practices which includes limitations brought about by the various stressors.
Teng and Chua (1978) among others have demonstrated that survival decreases as stocking density increases. The principal is also demonstrated to hold in Clarias operations in Thailand. Eng (1979) showed that survivals were about 10% and 20% when stocking rates were 560 and 260/m2, respectively. Sitasit (1968) reported a survival rate of 30 to 40% against stocking densities of 180/m2 while survival in the study ponds was 40 to 50% when 77 fish/m2 were stocked.
Clarias as with most other fish undoubtedly have a tolerance limit for crowding. This may not manifest as a social mechanism until fish start to reach maturity and seek breeding space since there are known instances in Thailand where immature fish are reared successfully at densities of 600 or more/m2 when water can be frequently exchanged. In most cases, however, a relationship between optimal yield and a particular density is apparent. This may be a carrying capacity function which links the development of adverse chemical conditions in the water to the number of fish present.
Brown (1957) reports that crowding can induce “size hierarchies” within a fish population. When this happens larger fish eat more food than smaller ones are are therefore more effective competitors by a factor related to size. At harvesting, the Clarias from the Jalernphorn Farm ranged from 18 to 34 cm in length. About 11% was in the size group 19–21 cm, 39% was in the 23–25 cm group, 41% in the 27–29 cm group and 9% in the 31–33 cm group. This spread appears to simulate a normal distribution indicating that adverse crowding effects did not occur at the densities in the study ponds.
The authors wish to thank Drs. A. Fedoruk and J. Colman for reviewing the manuscript. N. Phutamnong provided field assistance and N. Oonprasert helped with suspended solid analyses. We also thank S. Mobandit for the facilities at Suphanburi Fisheries Station camp, T. Jangploy for reproducing the figures and both D. Phornmongkhol and W. Kate-Pasook for typing the manuscript. Special thanks is given to Jalernphorn Farm for providing study ponds.
Anon. 1980.
Treatment wastewater in sewage stabilization ponds with consurrent
production of fish. Second and final report; submitted to the
International Development Research Center. 71 p. (mimeo).
American Public Health Association 1976.
Standard methods for the examination of water and wastewater.
14thed. APHA, New York, N.Y. 1193 p.
Areerat, S., 1979.
Swelling of the lateral body wall in the area near the pectoral fins
of pla-duk (Clarias batrachus). Tech. Rep. National Inland Fish
Inst., Dept. Fisheries, Bangkok, No. 1 (1979): 9p. (Thai).
Boyd, C.E., 1979.
Water Quality in warmwater fish ponds. Craftmaster Printers, Inc.
Opelika, Alabama. 359 p.
Brown, M.E., 1957.
The physiology of fishes (Vol 1). Academic Press, Inc., New York
447 p.
Burrpws, R.E., and B.D. Combs, 1968.
Controlled environments for salmon propagation. Prog. Fish-Cult.
30: 123–136.
Buterbaugh, Galen L. and Harvey Willoughby, 1967.
A feeding guide for brook, brown and rainbow trout. Prog. Fish-Culturist,
29 (4): 210–215.
Colt, J., G. Tchobanaglous and B. Wong, 1975.
The Requirements and Maintenance of Environmental Quality in Intensive
Culture of Channel Catfish. Dept. Civil Eng., Univ. Calif., Davis.
119 pp.
Eng, P., 1979.
Studies on water chemical changes in catfish (Clarias sp.) ponds.
Tech. Rep. Suphanburi Fisheries Station. 24 p. (Thai).
European Inland Fisheries Advisory Commission (EIFAC) 1970.
Water Quality criteria for European freshwater fish, report on ammonia
and inland fisheries. EIFAC Technical Paper, No. 11, FAO, Rome. 11p.
Gaarder, T., and H.H. Gran. 1927.
Investigations of the production of plankton in the Oslo Fjord, Rapp.
et. Proc. - Verb., Cons. Int. Explor. Mer., 42: 1–48.
Hampson, B.L., 1976.
Ammonia concentration in relation to ammonia toxicity during a
rainbow trout rearing experiment in a closed freshwater - seawater
systems. Aquaculture. 9: 61–70.
Hughes, G.H., 1976.
Respiration of amphibious verterbrates. Acad. Press, London. 402 p.
Knepp, G.L., and G.F. Arkin., 1973.
Ammonia toxicity levels and nitrate tolerance of channel catfish.
Prog. Fish-Cult. 32: 221–224.
Lewis, W.M. and M. Bender, 1961.
Free-living ability of a warm-water fish pathogen of the genus
Aeromonas and factors contributing to its infection of the golden
shiner. Prog. Fish-Cult. 23: 124–126.
Liao, P.B. and R.D. Mayo, 1972.
Salmonid hatchery water reuse systems. Aquaculture 1: 317–335.
Lloyd, R. and D.W.M. Herbert, 1960.
The influence of carbon dioxide on the toxicity of un-ionized ammonia
to rainbow trout (Salmo gairdnerti). Ann. Appl. Biol., 48: 399–404
Meyer, F.P., 1970.
Seasonal fluctuations in the incidence of disease of fish farms.
In a symposium on diseases of fishes and shellfishes, ed. S.F.
Snieszko, p. 21–29 special publication No. 5 Washington, D.C.:
American Fisheries Society.
Robinette, H.R., 1976.
Effect of selected sublethal levels of ammonia on the growth of
channel catfish (Ictalurus punctatus). Prog. Fish-Cult. 38: 26–29.
Schroeder, G.L., 1975.
Nighttime material balance for oxygen in fish ponds receiving organic
wastes. Bamidgeh. 27: 65–74.
Singh, B.N., 1976.
Balance between aquatic and aerial respiration; pp. 125–164., in
Hughes, G.M. ed. (1976) “Respiration of Amphibious Vertebrates”,
Acad. Press, London. 402 p.
Sitasit, P., 1968.
Study on the chemical condition of water in pla-duk ponds at Samutprakarn
province. Annual Tech. Rep. Aquaculture Division, Dept.
Fisheries, Bangkok. p 107–139.
Stainton, M.P., M.J. Capel, and F.A. J. Armstrong, 1977.
The chemical analysis of freshwater. Fish. Res. Board Can. Misc.
Spec. Publ. 25: 125p.
Swingle, H.S., 1968.
Estimation of standing crops and rates of feeding fish in ponds.
FAO Fisheries Rept. 44, Vol. 3: III/E-10, P. 416–423.
Teng, S.K. and T.E. Chua, 1978.
Effect of stocking density on the growth of estuary grouper,
Epinephelus salmonides Maxwell, cultured in floating net-cages.
Aquaculture. 15: 273–287.
Trussell, R.P., 1972.
The percent un-ionized ammonia in aqueous ammonia solutions at
different pH levels and temperatures. J. Fish. Res. Bd. Canada.
29: 1505–1507.
The Programme for the Development of Pond Management
Techniques and Disease Control
(DoF-UNDP/FAO THA/75/012)
REPORTS
THA/75/012/WP 1 Report on Aquaculture Training Undertaken at the International Center for Aquaculture, Auburn University, U.S.A. Chanchai Sansrimahachai
THA/75/012/WP 2 Third Semi-Annual Report (Sept. 1/80-Feb. 28/81) of Progress on the “Programme for the Development of Pond Management Techniques and Disease Control (DoF-UNDP/FAO THA/75/012)”. Alex N. Fedoruk
THA/75/012/WP 3 Management in Clarias Culture, Thailand. James Muir
THA/75/012/WP 4 Collecting Clarias Fry from Natural Waters. Montree Muangboon
THA/75/012/WP 5 Preliminary List of Diseases of Cultured Clarias in Thailand. National Inland Fisheries Institute, Thailand and Institute of Aquaculture, Stirling, Scotland.
THA/75/012/WP 6 Electrophoretic Analysis of Tilapia from the Dusit Palace Stock, Thailand. Brendan McAndrew