![]()
![]()
![]()
A.J. DeBoer1
INTRODUCTION
This paper reviews literature dealing with the economic analysis of feedstuff production and utilization in Asia. Topics include concentrate feeding, utilization of crop residues and by-products, fodder subsidies, fodder conservation, grazing systems, fodder crop production, and feed supplements. Examples are utilized from other countries with similar conditions.
This topic is of relevance due to the growing demand for animal products, the inability of most Asian countries to achieve self-sufficiency in animal products, low productivity of most Asian livestock production systems, large differences in resource endowments and animal product preferences between countries within the region, differences in socio-cultural attitudes towards animal keeping and animal product consumption, differences in types of feedstuffs available and their relative costs, and government policies and programmes. All of these factors demand sound economic analysis to help guide the Asian livestock/feedstuffs sector.
ECONOMIC FORCES UNDERLYING TRENDS IN FEEDSTUFF PRODUCTION AND UTILIZATION
In order to provide some historical background, recent developments are reviewed. The increased attention given to the livestock sector is a result of several forces (DeBoer, 1982). These include the need to move into higher value products as basic needs in cereals are being met, higher income elasticities of demand for animal products, increased supplies of crop residues and by-products resulting from “green revolution” technologies, income potential for landless labourers or smallholders by engaging in livestock enterprises, and increased labour use through livestock production.
Despite these efforts, the recent APO report by Simpson (1987) documents the slow development which has occurred in most areas, particularly in cattle and swamp buffalo2 numbers and productivity.
Conversely, poultry production and, to a lesser extent, swine production, has shown steady increases in production in most countries of Asia during the past 20 years. Simpson (1987) summarized the most recent data from the 12 countries responding to the APO survey questionnaire. The livestock population data covered the period 1970 – 1984. For all countries in the region, cattle numbers increased 0.4 percent per annum, buffalo numbers increased 0.9 percent per annum, swine production increased 2 percent per annum, and poultry numbers increased 4.5 percent per annum.
Reasons for these large differences in growth rates of animal populations have been explained by DeBoer (1976) by distinguishing between ruminants and nonruminants produced in the traditional or modern sectors. Prior to the 1950s, most Asian livestock were produced under scavenger conditions for draft power and subsistence consumption. Because so few inputs were purchased outside the farm, the farmers' supply of animal products depended heavily upon individual and communal land resources. In the absence of technical advances in animal production, continued expansion of animal product supplies would eventually have come up against a land constraint.
The ruminant and nonruminant production systems then began to diverge. Nonruminant production was more influenced by modern production technologies. This trend was accelerated by two factors: the dramatic increases in productivity achieved in pit and poultry production because of relatively straightforward technology transfers from temperate regions and a gradual expansion of international trade in feedstuffs, including P.O. 480 commodities. These two factors encouraged and rapid growth of swine and poultry industries utilizing predominantly industrialized forms of production clustered around major urban markets, which were often points of entry for imported importance of land resources as a limiting factor governing output of pork, poultry meat, and eggs. Supplies of these products became more dependent upon the availability of foreign exchange to finance feedstuff imports and the grows of domestic markets to absorb the increased output.
The ruminant animal industries in Asia experienced no comparable increases in productivity or in easily accessible feed supplies and thus continued to depend heavily upon domestic land resources as the major input. This sector retained its location specific character because large quantities of low-cost roughages were needed that could only be supplied economically from local resources. The swine and poultry industries, by contrast, are not as location-specific because they are less dependent on local land resources. Because the animal feedstuffs used in the expanding modern sector of these industries are traded internationally and exhibit fairly uniform prices within Asia, and because the productivity levels within these industries are covering we find much more uniform production costs and prices within the region for pig and poultry products.
Table 1. Checklist for Costs Involved in Production of Ruminants a and Pigs
| Type of Cost | Form of Cost |
| I. PRIMARY COST | |
A. Variable costs | |
1. Feed Cost | |
Concentrates | Cash |
Grass and hay | Cash/noncash |
Minerals/supplements | Cash |
Grain | Cash/noncash |
Water | Cash/noncash |
2. Operating Cost | |
Medicines/vaccines | Cash |
Veterinary services | Cash |
Breeding fees | Cash/noncash |
Housing/beddings | Cash/noncash |
Supplies | Cash |
Milk hauling/marketing | Cash/noncash |
Transportation | Cash/noncash |
Depreciation | Noncash |
Repairs | Cash/noncash |
Utilities | Cash |
Taxes, interest | Cash/noncash |
Hired labour | Cash |
Other labour (family/exchange) | Noncash |
Stock replacement | Cash/noncash |
B. Fixed Costs | |
Housing Construction | Cash/noncash |
Beginning stock | Cash |
Land rent | Cash/noncash |
| II. SECONDARY COSTS | |
Destruction of crops | Cash/noncash |
Trampling of land | Noncash |
Noise, disease carrier | Noncash |
Foul odor (animal and/or manure) | Noncash |
Threat to safety of small children | Noncash |
Note: a Large and small ruminants.
Table 2. Checklist of Benefits from Production of Ruminants a and Pigs
| Type of Benefit | Form of Benefit |
| I. PRIMARY BENEFIT | |
Milk | Cash/noncash |
Meat | Cash/noncash |
Work capacity | Cash/noncash |
Hides/skins/wool | Cash/noncash |
Manure | Cash/noncash |
Horn and/or hooves for feeds | Cash/noncash |
Horn and/or hooves for art | Cash/noncash |
Meat and milk by-products | Cash/noncash |
Transport | Cash/noncash |
Capital asset | Cash |
Breeder/reproduction | Cash/noncash |
| II. SECONDARY BENEFIT | |
Urine | Noncash |
Weeding/grazing | Noncash |
Aesthetic value | Noncash |
Religious value | Noncash |
Pet value | Noncash |
Entertainment and sports | Noncash |
Research | Noncash |
Note: a Ruminants - large ruminants, e.g., cattle and swamp small ruminants, e.g., goat and sheep.
Table 3. Checklist of Benefits Derived from Production of Ducks and Chickens
| Type of Benefit | Form of Benefit |
| I. PRIMARY BENEFIT | |
Meat | Cash/noncash |
Eggs | Cash/noncash |
Feathers | Cash/noncash |
Manure | Cash/manure |
Breeder/reproduction | Cash/noncash |
Bills and bones for feeds | Cash/noncash |
Game, i.e., cockfighting | Cash/noncash |
| II. SECONDARY BENEFIT | |
Aesthetic value | Noncash |
Pet value | Noncash |
Research | Noncash |
SOME ECONOMIC CONCEPTS USEFUL FOR ECONOMIC ANALYSIS OF FEEDSTUFFS
Most Asian livestock are produced on mixed farms rather than on specialized livestock units. Economic analysis of these units involves the use of methods that account for the economic consequences on the farm unit of a change made in the livestock activity. The specific technique will depend upon the purpose of the analysis but will usually involve partial budgeting, whole-farm budgeting, or linear programming.
This section draws heavily upon a training manual (Amir and Knipscher, 1987) under preparation by Winrock International.
Notion of Costs and Benefits
It is important that costs and benefits of adding technology be identified through on-farm performance. Often, this is relatively simple, especially the identification of cash inputs. First, try to get estimates of input costs in the village setting. This would increase labour rates, transportation costs and marketing costs such as taxes. However, noncash inputs such as family labour, forages, and household wastes are different to cost. Moreover, experience shows that it is easier and perhaps more relevant to develop budgets for herds than to estimate cost per animal. Tables 1 to 3 show the relevant costs and benefits that need to be considered in deriving partial budgets, gross margins and cost of production estimates. Valuation of benefits is crucial because benefits tend to be overvalued leading to erroneous conclusions.
Analytical Tools
Several approaches are available to quantify the economic benefits of new feeding systems. In general, these can be grouped under:
Partial farm analysis includes partial profit budgeting, gross margins analysis and parametric budgeting.
Input-output budgets include marginal analysis and benefit-cost analysis.
Whole-farm analysis covers financial analysis, whole-farm budget/cost and returns and farm programming. Simplified programming and linear programming fall under farm programming.
Budgeting is perhaps the simplest tool at the disposal of the analyst to derive preliminary estimates of profitability of single interventions. A budget is the summation of all expected products [or increased inventories] times their respective price less the summation of all items used in production. Budgeting allows the comparison and weighing of different plans against each other and provides a rationale for choosing the one that appears the best.
The partial budget models require the identification of important variable costs and benefits of the technology. After the identification, the change in cost as a result of adopting the technology is deducted from the expected gain in benefits. If the benefits remain positive and assure and adequate rate of return, the technology is considered profitable. This approach is useful for analyzing the effect of single interventions. However, caution is suggested to use realistic price and yield assumptions.
Among the general types of budgets such as gross margin, parametric budgets and enterprise budgets, partial budgeting has special significance. It is widely used to determine the profitability of a single intervention.
Partial budgets may involve from one to four elements: a) added costs; b) added returns, c) reduced costs, and d) reduced returns.
Situations Where Appropriate
Partial budgets are useful for the following types of trials:
Break-Even Budget Analysis and Parametric Budgets
Budgeting is concerned with predicting the consequences of alternative course of action and constitutes the simplest approach to farm system simulation. However, since events in the future are difficult to predict, many of the planning coefficients used in budgets are uncertain. In some cases, one particular planning coefficient may be a major source of uncertainty. A useful variant of partial budgeting in this case is Break-even Budgeting. In this method, the budget is drawn to establish the value of the selected coefficient at which the gains and losses are equal. The value so determined is known as the break-even value.
The notion of replacing a selected planning coefficient in a budget can be extended to more than one coefficient. Such budgets are called Parametric Budgets and are designed to show the effect on (extra) profit of variations in the selected planning coefficients. Thus, break even budgets are really a special category of parametric budgets.
Gross Margin Budgets
The gross margin analysis technique can assist farm manages when calculating profitability of alternative plans. The Gross Margin, (GM) is the difference between the gross income of a farm activity and its variable costs (or returns above variable costs). By adding gross margins of all activities on the farm, we obtain total gross margin. Gross margins are usually expressed per unit of some common resource. GM per head of animal is used to measure efficiency of production in animal activities.
General Cost of Production
The General Cost of Production (GCP) measure provides a summary of cost and returns of an enterprise, i.e., crop, livestock, poultry, for a specific period of time, usually a season or year.
1. All relevant variable costs associated with production of a commodity are identified and valued at the market price in nominal terms (prices not corrected for inflation).
2. Land, labour, cost of capital and services of management are valued at existing rates. In the cost of capital, credit charges on loaned capital as well as an appropriate depreciation allowance is used.
3. Both cash and non-cash returns received by the farmer are valued at nominal prices.
4. The returns minus cost provides an estimate of accounting profit. Other ratios can be used to express returns to different factors of production.
The GCP is a simple and extensively employed tool in developing countries to estimate profitability of different crops and livestock. It is useful in identifying relevant cost and returns on the farm and hence, a starting point for the farm manager in deciding his farm plan. Government agencies utilize this information on a year-to-year basis to review price and input subsidy policy. Moreover, the tool can be applied at different levels of sophistication. Some use the concept without getting involved in detailed computations of rates of depreciation and valuing in-kind payments.
The approach is restrictive in the sense that cost of production estimates are derived for a specific farm and managerial level. Since no two farms are the same, it becomes difficult to compare profitability amongst farms. Moreover, as input/output prices change, the estimates have to be revised frequently.
Input-Output Budgeting
Considerable data are generated through animal experiments that relate the level of farm yield or output to different levels of inputs. This is particularly true for inputs such as feeds, medicines, labour and equipment that are used in animal production. Animal feeding experiments often generate data relating feed inputs or stocking rate of livestock output. The basis of these procedures is partial farm budget analysis as discussed in the previous section. When applied to the analysis of input-output data, such partial budgeting is known as input-output budget analysis. The input-output alternatives being compared will usually relate to the different treatments used in an experiment or set of comparable experiments. However, data on differing input-output combinations may also be available from farm surveys and such data may also be appraised via input-output budget analysis.
Benefit-Cost Analysis
Benefit-Cost Analysis (BCA) is a form of "Input-output analysis" that is similar to gross margins analysis. Cash and non-cash costs and benefits are included in deriving the appropriate ratios. In BCA, there are four measures of profitability: i) Total Net Benefits (TNB); ii) Net Cash Benefits (NCB); iii) Benefit-Cost Ratio (BCR); and iv) Return to Capital (RTC).
The concepts of BCA are illustrated in Figure 1.
1. The Total Net Benefit (TNB) gives the over-all farm or socalled economic profit.
2. The Net Cash Benefit (NCB) shows the amount of cash returns above cash costs.
3. The Benefit-Cost Ratio (BCR) reflects the proportion of overall benefits derived from a single unit of over-all cost spent for the enterprise.
4. The Return to Capital (RTC) is the ratio of cash returns to capital inputs.
Whole-farm Analysis
Whole-farm economic analysis and planning involves examining the implications of reallocating farm resources. The planner is concerned with the evaluation of consequences of changes in either farm methods of production or in farm organization. Sometimes, the changes will be minor, like trying a new forage. However, these changes can be quite radical, as when land of little or no agricultural value is brought into intensive production in some land development scheme.
In whole-farm economic analysis, the farm is considered as a complete entity. The whole crop and livestock production programme overall basis. If profit budgets are to be prepared, they are constructed taking account of all farm income and expense items. On the other hand, in partial farm analysis, some aspects of the farm production system are taken as given and the budget analysis is conducted considering only those aspects of the farm that are directly affected by the proposed change.
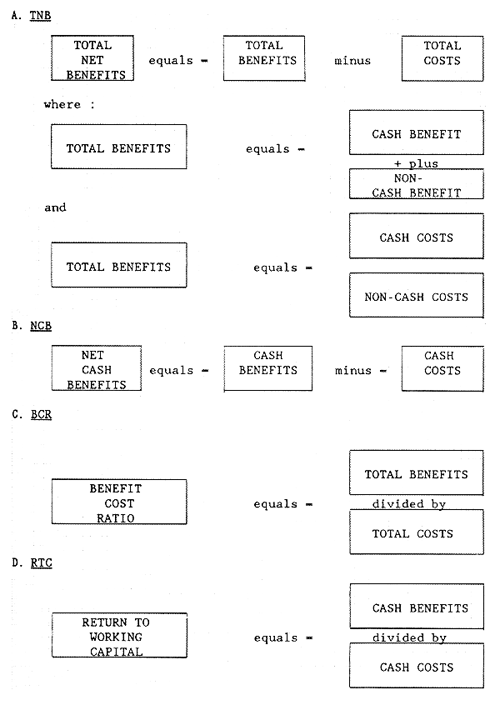
Figure 1. Concept and Procedure for Determining Four Types of Profitability Measures
Table 4. Cost and Returns Analysis for Different Types of Animal Technologies
(Unit: Indonesian Rs.)
| Item | Assumption | Traditional a | Low Cost b | High Cost c |
| Fixed Costs | ||||
Building | 8 years | 5000 | 15625 | 15625 |
Animals | 4% | 7500 | 7500 | 7500 |
| Variable Cost | ||||
Feed and other | 0 | 750 | 0 | 21000 |
Mineral/month | 250 | 0 | 12000 | 33168 |
Medicine/month | 200 | 0 | 14400 | 20400 |
| Non-cash Costs | ||||
Labour (25 minutes/day/head) | 0 | 23125 | 25125 | |
| Total Cash Costs | 750 | 49525 | 99693 | |
| Returns d | 85750 | 145000 | 217800 |
Source: Malyadi, et. al. (1986)
Note: a Assumes meat production of 52 kg.
b Assumes meat production of 88 kg'
1 US$ = 1,100 Indonesian Rps.
Whole-farm Budgets and Cost and Returns Tables
Whole farm budgets are drawn up to show the anticipated consequences, in terms of selected measures of performance, of some proposed farm plan. The budget is constructed on a whole-farm basis to allow for calculation of overall performance measures. The Cost and Returns Table is a common approach to constructing whole-farm budgets. This concept is illustrated in Table 4. From there it can be seen that Cost and Returns analysis accounts for both cash and non-cash costs as well as both fixed and variable costs. This is unlike in the case of partial budgets where fixed costs are not included in the analysis. Also, compare this approach with the Generalized Cost of Production discussed earlier in this section.
Financial Analysis and Its Use
Financial analysis (FA) is a form of evaluation that emphasizes the time value of money for on-farm animal trials. In agricultural undertakings, it is important to know whether the initial investments would pay off in the future. Huge cost outlays are imperative in the establishment period of a livestock enterprise, while the income generated usually comes much later. By discounting all costs and benefits for the whole projected duration of the activity, present values can be readily compared. In this way, the farmer can best decide the use of his available capital. However, because of its financial nature, non-marketable inputs and outputs are excluded from the analysis.
PARTIAL BUDGETS
This technique has found widespread use in the analysis of forage production, use of agro-industrial by-products for animal feeding, analysis of specific livestock enterprises, and examination of alternative feeding systems.
Partial budgets were used by Mallorie (1987) to examine potential cost reductions by using non-conventional feed resources for feeding dairy animals in Pakistan. Swamp buffalo feeding for various types of dairying systems was the basis for the study. A summary table prepared by Mallorie is reproduces here as Table 5.
In a more detailed study, also in Pakistan, Mallorie and Ali (1987) prepared detailed budgets for straw treatment and molasses feeding.
Table 5. Benefits, Constraints and Recommendations for Improved Systems of Feeding Dairy Animals, Pakistan, 1987
| Innovation | Advantage/Benefits | Savings Over Conventional Rations | Constraints to Adoption | Main Recommendation | |
| Percent | Greatest potential | ||||
| Compound feeds | Balanced Nutrients Cheaper ingredients | Landless | Manuf. and distrib. cost | Demonstrate to landless Improve mixture of conventional concentrates | |
| Treated straw | Increase in nutrients | 4–25 | Irrigated farms | Treatment cost, Effort | On-farm trials Develop machinery Contractor service Cheaper chemicals |
| Fodder silage | Conservation of fodder improved palatability | Barani/northern areas | Supply of surplus fodder Labour input, Losses | Investigate existing conservation practices On-farm trials Develop machinery | |
| Sugar beet pulp silage | Fill gap in fodder supply, reduce feed cost | 8–54 | NWFP farms and landless | Capital to buy silage Wastage possible future cost increase | Loans to buy pulp Demonstrate ensiling method Press pulp to reduce Trials of muel silages |
| Banana plant silage | Utilise banana plants and supplement fodder | 0–21 | Sind farmers and landless | Low nutrient density Labour to make Social-manure as feed | Trials of mixed silages Try other mixtures and methods to reduce cost On-farm trials |
| Molasses liquid/ molasses-urea | Utilize cheap feed ingredient | 19–36 | Barani | Limits on intake transport/distribution | On-farm-trial/demonstration Pilot/commercial manufacture and distribution |
| Molasses blocks | Carrier for feed supplements | All over Pakistan Cost of hardner | On-farm-trial/demonstration Pilot/commercial manufacture | ||
| Poultry litter maize silage | Reduce feed cost reduce land requirement | 11–21 | Barani farms | Social-manure as feed | On-farm-trial/demonstration |
Source: Mallorie, 1987.
Straw Treatment
Ammonia treatment results in an increase in protein and energy levels. The typical nutrient content of ammonia treated and untreated straw is estimated as:
| CP | CF | Ca | TP | Ash | TDN | TDN+CP | ||
| Wheat | - untreated | 3.5 | 41.1 | 0.21 | 0.07 | 7.8 | 40 | 43. |
| - treated | 7.5 | 38.0 | 0.21 | 0.07 | 8.0 | 46 | 53. | |
| - improvement | 4.0 | 3.1 | - | - | - | 6 | 10 | |
| Rice | - untreated | 4.0 | 35.1 | 0.21 | 0.08 | 17.0 | 38 | 42 |
| - treated | 8.0 | 33.5 | 0.21 | 0.08 | 17.0 | 45 | 53 | |
| - improvement | 4.0 | 4.6 | - | - | - | 7 | 11 |
Although treatment substantially increases the level of protein and energy, treated straw still has a low nutrient density relative to other forages.
Caustic soda treatment may add a little more energy (say, 8– 10 percentage points) but no protein. However, urea can also be added as a source of non-protein nitrogen. Treatment with 3 percent caustic soda plus 1.5 percent urea may result in the following analysis:
| Wheat | - untreated | 3.5 | 41.1 | 0.21 | 0.07 | 7.8 | 40 | 43. |
| - treated | 7.7 | 39.0 | 0.21 | 0.07 | 8.5 | 50 | 55. | |
| - improvement | 4.2 | 2.1 | - | - | - | 10 | 14. |
There may be additional benefits from feeding treated straw that are not apparent from the chemical analysis. The Mallorie and Ali (1987) study presented results of trials where calves grew significantly faster on a ration, including treated wheat straw although the nutrient analysis for all 3 rations was similar.
Cost of Straw Treatment
Treatment adds substantially to the cost of straw. Economic value depends on the value of nutrients in treated straw relative to untreated straw, fodder crops, and concentrates. The cost of straw treatment is calculated as:
| $ per mt of straw | Cost per kg of extra TDN and CP | |
| Anhydrous ammonia | $19.41 | $0.19 |
| Urea | 8.18 | 0.08 |
| Caustic soda plus urea | 20.00 | 0.14 |
The cost of anhydrous ammonia and caustic soda in Pakistan is high relative to world markets. The domestic price of anhydrous ammonia in that country is around $0.59 per kg; in Denmark it is delivered to the farm at total price of $0.14 per kg. The international price of caustic soda is about one quarter the cost of the Pakistan price. If the prices of these materials were reduced to something approaching international levels then both systems would become cheaper than urea treatment.
Economics of Feeding Treated Straw
The economics of feeding treated straw depends on: i) cost of treatment; ii) cost of straw; and iii) improvement in nutrients.
Cost of nutrients - As a treatment cost of $8.82/mt DM (urea treatment) treated straw is a more expensive source of nutrients than untreated straw but becomes more competitive as the cost of straw rises. However, treated straw is, unless straw prices are high, a cheaper source of nutrients than green fodder and concentrates (Table 6).
Cost of treatment - If straw costs $0.10/kg DM ($8.87/mt as is) then treated straw rations are cheaper up to a treatment cost of $0.0159 to $0.0206 per kg DM depending on the TDN level. This is about the cost of treatment with anhydrous ammonia. As straw is a greater proportion of low density rations, savings are greater with the 50% TDN feed: urea treatment reduces cost from $0.045 to $0.037/kg DM, a 14 percent saving.
Sodium hydroxide treatment - Sodium hydroxide treatment at $0.022/kg DM is considerably more expensive than urea treatment but it adds additional TDN. Although the cost per unit of extra TDN is higher, this is offset by the increase in nutrient density. This allows a greater proportion of straw to be used in rations as shown below.
| Percent of | TDN | ||
| 60% | 55% | 50% | |
| Untreated straw | 40 | 60 | 80 |
| Concentrates | 60 | 40 | 20 |
| NaOH-treated straw | 45 | 75 | 100 |
| Concentrates | 55 | 25 | 0 |
With sodium hydroxide treatment costing $22.35/mt of DM, rations with 50 percent and 55 percent TDN are cheaper than ureatreated straw if straw costs less than $32.35/mt DM. If straw prices are higher, the larger proportion of straw in NaOH rations raises the cost. If the price of sodium hydroxide was reduced by half to $235/mt, then treatment cost falls to $20.59/mt DM and it is a cheaper form of treatment at all straw prices.
Table 6. Cost of Straw Treatment
| Item | $/mt straw | |
| Anhydrous ammonia (gas) | ||
3% ammonia @ $0.59/kg | 17.65 | |
10% handling and labour | 1.76 | |
| $19.41 | ||
| Urea treatment (based on 8 tonne batch) | ||
5% urea @ $ 0.15/kg | 7.53 | |
Plastic sheet (used 5 times) | 0.12 | |
Labour, 4 men × 4 hours $ 0.24 | 0.47 | |
| $8.12 | ||
| Caustic soda | ||
3% caustic soda @ 0.47/kg | 14.12 | |
Treatment costs (extra 50 % on cost of hire of threshing machine) | 3.65 | |
| Sub-total | 17.76 | |
Plus 1.5% urea @$0.15/kg | 2.24 | |
| Total | $20.00 |
Source: Mallorie and Ali (1987).
Summary of Benefits and Constraints
At present only urea (and possibly sodium hydroxide) appear to be cost effective. If prices of anhydrous ammonia and sodium hydroxide could be reduced, straw treatment would become a much more attractive system for adoption by farmers.
Utilization of Molasses
Availability of molasses - Molasses is primarily a source of energy and is widely used in many countries as a supplement for low quality fodder.
Growing cattle can consume up to 3 kg of molasses per day in liquid form but intake in lactating cows is limited by physiological factors. A safe intake level might be two kg per day in winter and one kg per day in summer. If molasses is incorporated in silage or a complete feed, it may be possible to increase the maximum safe intake.
Cane molasses, costing $29.40/mt, contains 78 percent dry matter, 73 percent TDC and 4 percent crude protein so each percentage of point of TDN and protein cost $0.049. This is less than for most other concentrates. For instance, cotton seed cake costs $0.059 kg making molasses a cheap source of nutrients. Molasses remains competitive with home grown fodders up to a price of $35.30 per mt and with purchased concentrates up to $64.70 – 82.35 per mt.
Liquid supplements - Minerals and other feed materials can be added to molasses to make a liquid supplement. Molasses is also a useful carrier of urea, a cheap source of protein. By feeding molasses and urea together the risk of digestive disorders and toxicity arising from urea is minimized.
Although a molasses/urea liquid supplement is a substantially cheaper source of nutrients than more conventional concentrates, its impact on the overall cost of feeding is limited by restrictions on the safe daily intake of both molasses and urea. A comparision of feeding costs using molasses and urea-molasses is shown in Table 7 Berseem-based diets have adequate amount of protein and molasses can economically replace concentrates as a source of energy. Maize-based rations are cheapened by the use of urea-molasses and substantial savings are possible in barani winter rations using poor quality dry fodder and high levels of concentrates as higher levels of molasses can be fed at this time of year.
Molasses Blocks
Feeding of molasses in the form of a solid block is, like wheels and drums, a method of restricting intake while allowing continued access by a group of animals. The necessary hardening agent for molasses is now manufactured and sold in Pakistan. In addition, a number of overseas and local companies are interested in the manufacture of molasses blocks.
Table 7. Comparision of Conventional Rations with Rations Using Molasses
| Ingredients: kg DM | Irrigated Punjab | Barani | ||||||||
| Conventional | Molasses | Conventional | Molasses | |||||||
| C | D | E | M1 | UM1 | UM2 | F | H | UM3 | UM4 | |
| Berseem | 7.00 | 7.00 | ||||||||
| Maize | 7.00 | 3.00 | 4.50 | 2.00 | ||||||
| Rape | ||||||||||
| Wheat straw | 3.60 | 1.80 | 4.50 | 4.50 | 4.50 | 4.50 | 2.70 | 3.60 | 3.95 | |
| Dry maize fodder | 2.50 | 2.50 | 2.50 | 2.50 | ||||||
| Maize stover | 2.50 | 2.50 | 2.50 | 2.50 | ||||||
| Cotton seed cake | 0.95 | 0.95 | 0.10 | 0.65 | 2.93 | 1.99 | 1.42 | |||
| Wheat bran | 0.95 | 0.95 | 0.10 | 0.65 | 0.49 | 0.33 | 0.24 | |||
| Wheat grain | ||||||||||
| Molasses | 1.56 | |||||||||
| Molasses-urea | 0.90 | 0.90 | 1.80 | 1.80 | ||||||
| Percent | ||||||||||
| TDN | 58.00 | 64.40 | 51.60 | 58.20 | 57.10 | 50.80 | 58.00 | 60.10 | 58.40 | 55.40 |
| CP | 14.30 | 9.19 | 5.82 | 12.70 | 9.25 | 7.90 | 10.00 | 9.90 | 11.10 | 9.75 |
| Production:Litres | 8.00 | 5.40 | 0.00 | 8.05 | 5.40 | 0.00 | 8.00 | 5.34 | 8.00 | 5.18 |
| Cost per day ($) | 0.67 | 0.53 | 0.18 | 0.54 | 0.43 | 0.18 | 0.80 | 0.59 | 0.61 | 0.37 |
| Percent/Litres | 0.08 | 0.10 | - | 0.07 | 0.08 | - | 0.09 | 0.11 | 0.75 | 0.07 |
| Saving on ration: | C | D | E | F | H | |||||
| percent: | 19.0% | 19.0% | - | 19.5% | 36.0% | |||||
Source: Mallorie and Ali, 1987.
Table 8. Cost Savings from Use of Milk Replacer, Pakistan
| Early meaning assumption: | Drastic | Moderate | Drastic | Moderate | ||||
| Milk price assumption: | Low | High | Low | High | Low | High | Low | High |
| Cost of whole Milk ($) | 29.40 | 58.82 | 45.88 | 92.35 | 26.47 | 52.94 | 41.18 | 82.94 |
| Cost of milk replacer ($) | 24.70 | 24.70 | 38.82 | 28.82 | 15.88 | 15.88 | 29.71 | 24.71 |
| Cost savings ($) | 4.70 | 34.12 | 7.06 | 53.53 | 10.59 | 37.06 | 16.47 | 58.23 |
Source: Gropp, 1986
Assumptions underlying these partial budgets are as follows:
Swamp buffalo Milk = $0.17/kg low, $0.34/kg high
Cow Milk = 10% lower than buffalo milk
Milk replacer cost = $0.59/kg for cattle, $0.71/kg for buffalo
Milk consumption/calf:
Drastic early meaning: 175 kg, moderate = 275 kg
1 kg buffalo milk = 0.2 kg milk replacer
1 kg cattle milk = 0.15 kg milk replacer
Milk replacer required per calf = 35–55 kg for buffalo, 27–42 kg for cattle
Blocks containing 75 percent molasses and 6 percent urea with minerals and vitamins could be made on the farm for a material cost of $0.126 per kg. These blocks would contain 19 percent protein and 44 percent TDN and would be useful supplement for high energy fodders (such as maize). However, the cost of hardener means that it is not particularly competitive with concentrates which also may contain a high level of energy. For instance cottonseed cake at $0.13 per kg would contain 21 percent protein and 70 percent TDN (a cost of Rs. $0.15 per kg of protein and TDN compared with $0.16 for the nutrients in molasses blocks).
Mollasses-bran blocks - An alternative to chemical hardening is to make a block with a high level of wheat or other cereal bran. Such a block could contain a substantial proportion of molasses and be hardened by pressing (in a simple hydraulic of hand press) or the addition of a little cement. Such blocks could contain a higher level of energy than chemically hardened blocks and be cheaper to make. A block costing #0.087 per kg would provide nutrients at a cost of $0.08 per kg of TDN and crude protein. This is cheaper than concentrates such as cottonseed cake, although the block only has a medium level of energy.
Another example of partial budgets used to compare feedstuff costs is provided by Gropp (1986) for the costs of feeding milk replacer vs whole milk to buffalo and cattle calves in Pakistan. These figures are shown below (Table 8).
As can be seen from above, locally manufactured milk replacer can save considerable costs in calf rearing. A minimum fresh milk price of about $0.24 is needed to make milk replacer economical. these estimates are used in Section VI for budgets constructed for veal fattening based on milk replacers.
WHOLE-FARM BUDGETS
A whole-farm budget represents the combined enterprise budgets, plus the provision of certain costs which are fixed for the entire farm unit. The whole-farm budget is the basis for farm management analysis and also represents the typical starting point for linear programming analysis.
The recent development on farming systems research has focused attention on the farm as an operational unit. Consequently, budgets which account for inputs, output, household allocation of labour and capital, and flows between households, crops and livestock have become an important tool of analysis. A team of skilled analysts representing disciplines of agronomy, economics, animal science, etc., can usually construct a profile of whole-farm systems covering a wide range of production systems.
A recent study by Winrock International (1986) in Indonesia uses this approach to develop financial and feedstuff budgets on a whole-farm basis. The whole-farm budget used here represents a typical lowland rice system found in many parts of Indonesia. Rice is the main crop and receives most of the crop inputs. Secondary crops utilize residual moisture to provide family food. Rice is milled in the villages, thus, rice bran is available. Furthermore, rice straw is a major source of cattle and buffalo feed along with other crop residues. The animal component is comprised of cattle or buffalow, ducks, chickens and small ruminants or swine, but not all are found on single farms. The ducks feed on grains lost during harvest and on insects and weeds in rice paddies and around irrigation canals. The eggs and meat from chickens and ducks are consumed within the household or sold in the local market. The basic diagram depicting the system is shown in Figure 2. The solid lines represent strong linkages, dotted lines weak linkages.
The economic budget (Table 9) shows the annual return to the family's labour. It is obvious that ducks and livestock constitute an important source of agricultural income, second after rice.
A shortage of feed restricts animal output, even though water may be available for two or more crops of rice. This situation could be improved to some extent by sowing a forage legume after rice to increase the quantity and quality of available feed. It would not completely correct the deficit which occurs during growth of the first rice crop. Feed storage would alleviate the situation but in this practice might not be economically favourable.
The lowland, rice-based system involves the intensive cropping of rice, maize, cassava, peanuts, soybeans and sweet potatoes, all of which provide residues for the feeding of ruminants. An estimated 4.12 tons of DM provide 7,348 Mcal of ME and 247 kg of total protein, assuming the residue yields as shown in table 10.
Two head of mature female buffaloes, each weighing an average of 400 kg over the year, are maintained to provide draft to the cropping system. Assuming a calving interval of 24 months, the buffaloes have the following yearly work/production schedules (days per year) which determine their nutritional requirements for ME and TP:
20 days working 4 hours per day
10 days working 8 hours per day
45 days late gestation (BW increases to 450 kg)
50 days lactation at 4 kg of 7.0% milk per day
240 days maintenance only.
The “late gestation” period (when the demand of the growing fetus creates additional nutritional requirements above maintenance) is 90 days, or an average of 45 days per year. The buffalo is assumed to produce an average daily milk yield of 7 kg for the nursing calf over a period of 100 days, or 50 days longer but the low level of milk production necessary beyond the demand. The daily nutritional requirements for the buffalo are shown in Table 11.
The feed resources available to feed the buffaloes include weeds and native grasses consumed during grazing of fallow paddy, paddy bunds and roadsides, rice straw, and other crop residues available on a seasonal basis. Rice bran produced is assumed to be left with the miller in payment for milling or is used to feed the small flock of 30 ducks and is, therefore, not available as feed for the buffaloes. Rice straw is available in greater quantities than the buffalo can consume and is therefore considered to be an “unlimited” resource. The buffaloes graze for an average 2 hours per day and are able to consume dry matter in the form of weeds and native grasses at the rate of 1.0 percent of their bodyweight, or 4 kg. They are stalled at night on rice straw and other crop residues (dry matter consumed equal to 1.0 percent of bodyweight, or 4 kg).
The amount of ME and TP provided by crop residues is shown in Table 9. A total of 4,129 kg of DM are produced from cropping activities. Rice straw represents 91.7 percent of the total available residue DM and is considered in the feed budget as an “unlimited” resource as more is produced than the buffaloes are capable of consuming. “Non-rice crop” residues total 357.4 kg of DM annually, or an average of only 0.98 kg per day available to the two buffaloes. The 0.98 kg of non-rice crop residues are assumed to contain 2.19 Mcal ME and 0.11 kg of TP. Dry matter grazed is assumed to have a ME and TP content of 1.50 Mcal per kg and 9.0 percent respectively. Intake of weeds and native grasses from grazing and rice straw from stall feeding are each assumed to be 1.0 percent of bodyweight, or 4 kg per day (4.5 kg during late pregnancy when bodyweight rises to 450 kg). Each buffalo is assumed to consume 50 percent of available non-rice crop residue DM, or 0.47 kg daily. Crop residues including rice straw, account for an average 42.6 percent of DM intake, 45.9 percent of ME, and 25.2 percent of TP with DM consumed from grazing accounting for the remainder of nutrient intake.
The average daily intake of ME and TP, outside of the late gestation period, is estimated at 16.62 Mcal and 775 g, respectively. Intake of ME and TP are estimated to be deficient only during the 10 days of heavy work (8 hours per day) and during 50 days of lactation. Because of seasonal differences unavailability and nutrient content of forage and crop residue DM, the actual daily nutritional balance for the buffalo will fluctuate widely across the year unless some method of forage preservation, such as ensiling, is practiced. Some adjustment is made by the buffalo by increasing or decreasing the intake of DM from rice straw and grazing. Such adjustments are probably not sufficient to prevent loss of weight when ME and TP availability nutritional requirements. Some body weight is recovered during the periods when availability of ME and TP exceeds nutritional requirements, especially during the estimated 240 days when the buffalo is not working hard or lactating. Adjustments in the production cycle of the buffalo, such as controlled breeding to have calving occur at the time of the year when available DM from crop residues is abundant, would reduce the fluctuations in the nutritional balance. The seasonal loss and recovery of weight is a contributing factor to the long calving intervals of swamp buffaloes (and cattle) on Indonesian smallholdings.
Table 9. Annual Budget for Lowland Rice-based farming System
Farm size: 0.4 ha irrigated land
0.1 ha mized garden
2 head of buffalo (females)
30 ducks
Cropping pattern: Rice-rice-“palawija” (secondary crops)
Annual revenues:
| Crop | Kg produced | Value (Rp) | ||
| Rice | 4000 | 560,000 | ||
| Maize | 240 | 30,000 | ||
| Cassava | 600 | 30,000 | ||
| Peanuts | 60 | 45,000 | ||
| Soybeans | 60 | 24,600 | ||
| Mungbeans | 24 | 13,800 | ||
| Sweet potato | 70 | 4,200 | ||
| Mixed garden | 10,000 | |||
| Sub-total, crops | 807,600 | |||
| Livestock: | ||||
| Meat | 150 | 150,000 | ||
| Draft | 30 days | 60,000 | ||
| Eggs | 3000 | 225,000 | ||
| Sub-total, livestock | 435,000 | |||
| Annual Expenses | ||||
| Crops: | 403,800 | |||
| Livestock inputs: | 0 | |||
| Annual net return to family labour from crops | 403,800 (48%) | |||
| Annual net return to family labour from livestock | 435,000 (52%) | |||
| Annual total return to family labour from agriculture | 838,800 | |||
Source: Winrock International, 1986, p. VII-11.
US$1.00 = Rp.1,115.
The cropping system provides the major proportion of the diet for the duck flock as well as for the buffaloes. As mentioned above, the rice bran produced from the milling process may be used for the duck flock, especially if young ducklings are purchased instead of mature replacement hens. Foraging on paddy post-harvest and during fallow periods provides weeds, snails and insects for the duck flock. Some feed such as sago palm pith, small fish and rice bran may be purchased off-farm. The duck flock is usually managed by the wife and younger children of the smallholder.
The above example was repeated for 13 crop-livestock system in Indonesia. This work indicates the amount of information that can be provided by short field surveys undertaken by experienced, multi-disciplinary teams that have access to basic feeding value data for locally available feedstuffs. The animal requirements are estimated from standard feeding tables. These feed demand-supply balances are the key to designing cost-effective intervention strategies at the farm-level.
ENTERPRISE BUDGETS
Enterprise budgets use the basic principles of budgeting set out earlier and apply them to specific enterprises or activities. For the analysis of feed resources, enterprise budgets are usually applied to livestock enterprises rather than to specific feedstuffs producing activities; however, in the budgets which follow, both types of enterprises are presented.
Generalized Cost of Production Studies
The first studies concerned costs of production of feeding male buffalo calves for veal production based on milk replacer. This work is very relevant in much of South Asia where female buffalo calves are highly prized for milk production but male calves are generally killed at birth because of lack of feed resources to grow them out as well as low meat prices. Using cheaper feed resources (such as low-cost milk replacer) and producing high quality meat with good export potential (such as veal) is one way reduce the resources wasted by the traditional practice. A detailed study by Gropp (1986) in Pakistan produced the tables set out below. In Tables 12 and 13, the birth weights are rather low reflecting traditional systems while the higher birth weights in Table 14 are more typical of small commercial units or military dairy farms. Table 12 gives the budgets for buffalo calves while Table 13 gives comparable figures for male cattle calves. These data show slightly lower production costs for male cattle at every level of final body weight. In table 14, the same budget is reproduced for male buffalo calves at 28 kg birth weight.
Table 10. Metabolizable Energy (ME) and Total Protein (TP) Provided by Crop Residues for Lowland, Rice0based Farming System
| Crop | Yield | Residue | Residue as percent of Yield | Residue Available (kg DM) | Contents of: | Estimated Yield of: | ||
| ME (Mcal/kg DM) | TP (g/kg DM) | ME (Mcal) | TP (kg) | |||||
| Rice | 4000 | Rice straw | 84.3 | 3372 | 1.63 | 45 | 5496.36 | 151.74 |
| Rice bran | 10 | 400 | 2.63 | 135 | 1052 | 54 | ||
| Maize | 240 | Stover | 59.6 | 143.04 | 1.77 | 57 | 253.18 | 8.15 |
| Husks | 10 | 24 | 2.62 | 81 | 62.88 | 1.94 | ||
| Cassava | 600 | Tops | 2.5 | 15 | 2.2 | 249 | 33 | 3.74 |
| Peanuts | 60 | Vines | 94.8 | 56.88 | 2.42 | 150 | 137.65 | 8.53 |
| Soybeans | 60 | Vines | 185.5 | 111.3 | 2.65 | 159 | 294.95 | 17.7 |
| Sweet potato | 70 | Vines | 10.2 | 7.14 | 2.48 | 157 | 17.71 | 1.12 |
| Total | 4129.36 | 7347.72 | 246.92 | |||||
| Total, non-rice residues | 357.36 | 799.36 | 41.18 | |||||
| Total, non-rice residues per day | 98 | 2.19 | 11 | |||||
* Percentage of residues as per appendix table 4.5 from DBPP/FPUS (1983)in Winrock International (1986) report.
Source: Winrock International, 1986, p. VII-12
Table 11. Nutritional Requirements and Intake from Grazing and Crop Residues for 400 kg Buffalo Cow in Lowland Cropping System
| Physiological status | Daily b requirement | Intake of DM a | Total | Crop residues as a % of total | Surplus (deficit) over (from) requirements | |||||||||||||||||
| Weeds and native grasses from grazing | Rice straw | Rice bran | Non-Rice Crop residues | |||||||||||||||||||
| ME | TP | DM | ME | TP | DM | ME | TP | DM | ME | TP | DM | ME | TP | DM | ME | TP | DM | ME | TP | ME | TP | |
| (Mcal) | (g) | (G) | (Mcal) | (g) | (kg) | (Mcal) | (g) | (kg) | (Mcal) | (g) | (kg) | (Mcal) | (g) | (kg) | (Mcal) | (g) | -----"----- | (Mcal) | (g) | |||
| 20 days maintenance plus 4 hrs daily work | 15.50 | 577 | 6.0 | 9.00 | 540 | 4.0 | 6.52 | 180 | .00 | .00 | .00 | 0.47 | 1.10 | 55 | 10.47 | 16.62 | 775 | 42.7 | 45.8 | 25.2 | 1.12 | 198 |
| 10 days maintenance plus 8 hrs daily work | 18.90 | 715 | 6.0 | 9.00 | 540 | 4.0 | 6.52 | 180 | .00 | .00 | .00 | 0.47 | 1.10 | 55 | 10.47 | 16.62 | 775 | 42.7 | 45.8 | 25.2 | (2.28) | 60 |
| 45 days maintenance plus late gestation (450 kg bodyweight) | 16.20 | 720 | 6.75 | 10.13 | 608 | 4.5 | 7.34 | 202 | .00 | .00 | .00 | 0.47 | 1.10 | 55 | 11.72 | 18.56 | 865 | 42.4 | 45.4 | 25.1 | 2.36 | 145 |
| 50 days maintenance plus lactation at 4kg 7.0% milk | 18.00 | 908 | 6.0 | 9.00 | 540 | 4.0 | 6.52 | 180 | .00 | .00 | .00 | 0.47 | 1.10 | 55 | 10.47 | 16.62 | 775 | 42.7 | 45.8 | 25.2 | (1.38) | (133) |
| 240 days maintenance only (includes early gestation) | 11.20 | 469 | 6.0 | 9.00 | 540 | 4.0 | 6.52 | 180 | .00 | .00 | .00 | 0.47 | 1.10 | 55 | 10.47 | 16.62 | 775 | 42.69 | 45.8 | 25.2 | 5.42 | 306 |
Table 12. Veal Production Feeding Costs of Buffalo Male Calf Exclusively with Milk Replacer (Body weight at start (5–7 days old) 21kg)
| Final Body Weght (kg) Feed Efficiency (g Feed/g Gain) | 60 | 80 | 100 | |||
| 1.5 | 2.0 | 1.5 | 2.0 | 1.6 | 2.0 | |
| Milk replacer (28% CP)(kg) | 50 | 55 | 50 | 55 | 50 | 55 |
| Milk replacer (26% CP)(kg) | 10 | 23 | 39 | 63 | 77 | 103 |
Milk replacer (Rs.) | 720 | 940 | 1070 | 1420 | 1530 | 1900 |
Calf cost (at start) (Rs.) | 100 | 100 | 100 | 100 | 100 | 100 |
Total (Rs.) | 820 | 1040 | 1170 | 1520 | 1630 | 2000 |
| Losses (%) | 9 | 10 | 10 | 11 | 11 | 12 |
| Cost, including losses a (Rs.) | 870 | 1125 | 1280 | 1680 | 1800 | 2240 |
| Transportation loss (%) | 6 | 6 | 6 | 6 | 6 | 6 |
| Body weight at slaughter (kg) | 56.4 | 56.4 | 75.2 | 75.2 | 94.0 | 94.0 |
| Carcass weight (kg) b | 35.0 | 35.0 | 46.6 | 46.6 | 58.3 | 58.3 |
| Cost/kg carcass (Rs.) c | 25 | 32 | 28 | 36 | 31 | 39 |
Source: Gropp (1986), p. 29. Pakistan Rupees 17.5 = US$1.00
Note: a Reduced feed consumption due to earlier death included.
Table 13. Veal Production Feeding Costs of Buffalo Male Calf Exclusively with Milk Replacer (Body weight at start (5–7 days old) 21kg)
| Final Body Weght (kg) Feed Efficiency (g Feed/g Gain) | 60 | 80 | 100 | |||
| 1.5 | 2.0 | 1.5 | 2.0 | 1.6 | 2.0 | |
| Milk replacer (28% CP)(kg) | 60 | 82 | 94 | 130 | 95 | 100 |
| Milk replacer (26% CP)(kg) | - | - | - | - | 40 | 24 |
Milk replacer (Rs.) | 600 | 820 | 940 | 1300 | 1350 | 1740 |
Calf cost (at start)(Rs.) | 100 | 100 | 100 | 100 | 100 | 100 |
Total (Rs.) | 700 | 920 | 1040 | 1400 | 1450 | 1840 |
| Losses (%) | 9 | 10 | 10 | 11 | 11 | 12 |
| Cost, including losses a (Rs.) | 740 | 990 | 1130 | 1540 | 1600 | 2060 |
| Transportation loss (%) | 6 | 6 | 6 | 6 | 6 | 6 |
| Body weight at slaughter (kg) | 56.4 | 56.4 | 75.2 | 75.2 | 94.0 | 94.0 |
| Carcass weight (kg) b | 35.0 | 35.0 | 46.6 | 46.6 | 58.3 | 58.3 |
| Cost/kg carcass (Rs.) c | 22 | 29 | 25 | 33 | 28 | 35 |
Source: Gropp (1986), p. 29. Pakistan Rupees 17.5 = US$1.00
Note: a Reduced feed consumption due to earlier death included.
Table 14. Buffalo Male Calves Veal Production (Birth weight 28 kg, start of MR feeding: 30 kg BW 1 kg MR: 12 Rps.)
| Final Body Weight | 60 | 80 | 100 | |||
| Feed efficiency | 1.4 | 2.0 | 1.5 | 2.0 | 1.6 | 2.0 |
| Milk replacer consumed (kg) | 42 | 60 | 75 | 100 | 112 | 140 |
Milk replacer (MR) (Rs.) | 504 | 720 | 900 | 1200 | 1350 | 1680 |
Calf (5–6 days old) (Rs.) | 100 | 100 | 100 | 100 | 100 | 100 |
Total (Rs.) | 604 | 820 | 1000 | 1300 | 1450 | 1780 |
| Mortality (%) | 9 | 10 | 10 | 11 | 11 | 12 |
Additional expenses a (Rs.) | 31 | 60 | 80 | 130 | 150 | 210 |
New total b (Rs.) | 635 | 880 | 1080 | 1430 | 1600 | 1990 |
| Transportation loss (%BW) | 6 | 6 | 6 | 6 | 6 | 6 |
| Calf weight at slaughter (kg) | 56.4 | 56.4 | 75.2 | 75.2 | 94 | 94 |
| Dressing percentage (%) | 59 | 59 | 61 | 61 | 62 | 62 |
| Carcass weight (kg) | 33.3 | 33.3 | 45.9 | 45.9 | 58.3 | 58.3 |
| Cost/kg carcass c (Rs.) | 19.1 | 26.4 | 23.5 | 31.2 | 27.4 | 34.1 |
| Ed. meat/carcass (%) | 65 | 65 | 67 | 67 | 70 | 70 |
| Edible meat (boneless) (kg) | 21.6 | 21.6 | 30.7 | 30.7 | 40.8 | 40.8 |
| Cost/kg meat d (Rs.) | 29.4 | 40.7 | 35.2 | 46.6 | 39.2 | 48.8 |
Source: Gropp (1986), p. 31.
Note: a Including less feed consumed through earlier death.
c Does not contain any costs for slaughtering and meat inspection.
d Does not contain any costs for processing and packing.
The price of good quality veal was considerably above the production costs shown in these tables and by actively encouraging export trade in this type of meat, these feeding enterprises would be assured of good profit prospects. The other point to note is that the basic data presented in these tables could be used for parametric budgeting by, e.g., varying the cost of milk replacer and estimating the resulting variation in production costs, by carrying out costs and returns analysis by including revenue calculations and by doing a benefit-cost analysis of these practices.
Generalized costs of production were also estimated for four different types of milk production systems in India. The National Dairy Research Institute in Karnal, India has kept detailed production costs to compare different cattle with buffalo. These data are reproduced in Table 15. This allows straightforward comparision of production costs per cow and per litre of milk. It also shows the relative importance of feed costs and can show, through parametric budgeting, the impact that changes in feed costs have on overall production costs. This illustrates the cost advantage of crossbred cattle and helps explain the rapid growth in numbers of crossbred cattle in India.
Generalized costs of production are also given for a number of feedstuffs of interest to this Symposium. Some of these were mentioned earlier in the section dealing with partial budgets. Table 16 gives costs of producing urea treated straw in Thailand based on a simple urea treatment process. Table 17 gives interesting cost comparisons for fodder production costs for a variety of fodder production alternatives suitable for Northern India. The next step would be to adjust the costs per quintal based on feeding value.
Costs and Returns Analysis
Several excellent studies are available which examine costs, returns and profit relationships for using various types of feedstuffs, including non-traditional feeding systems. Lai (1987) examines cost-return relationships for sheep production under oil palm plantations in Malaysia. Table 18 sets out the basic assumptions, costs and returns. The enterprise appears to provide good profits of over US$5,700. These data also show the importance of proper valuation of animal inventories and the fact that adequate start-up capital is essential. The same study also examines palm kernel-based rations for cattle fattening. Fattening of 7 animals over a 5-month period results in a profit of over $100 per animal (Table 19).
In India, an excellent study by Singh (1987) set out costs are returns for buffalo, nondescript cattle and crossbred cattle on small farms based on survey data. Net costs of milk production were lowest for crossbred cattle (Table 20). The actual situation, depicted through the survey results in Table 20 were then compared with a “one-acre, three crossbred cow on-farm research trial” (Table 21). This allows us to compare the potential that exists by applying current research knowledge at the farm level. As Table 21 shows, costs increase but milk production increases (for cross bred cattle) from 2,347 litres (Table 20) to 11,713 (Table 21) and cost of milk production declines to Rs. 1.36/litre.
Table 15. Average Cost of Maintenance/day/litre of Milk for Cattle and Buffalo
(Unit: Indian Rs.)
| Cost | Purebred | Purebred | Crossbred Cattle | Murrah Buffalo | ||||
| Zebu | Cattle | Exotic | Cattle | |||||
| Per cow per day | Per litre of milk | Per cow per day | Per litre of milk | Per litre of day | Per litre of milk | Per litre of day | Per litre of milk | |
| Feed | 4.86 | 0.90 | 5.98 | 0.78 | 8.07 | 0.83 | 4.83 | 1.21 |
| Labour | 2.97 | 0.55 | 3.03 | 0.39 | 3.02 | 0.31 | 2.77 | 0.69 |
| Supervisi | 0.20 | 0.04 | 0.20 | 0.03 | 0.20 | 0.02 | 0.20 | 0.05 |
| Replaceme | 0.89 | 0.16 | 1.09 | 0.14 | 1.20 | 0.12 | 1.45 | 0.36 |
| Vet. and medicine | 0.21 | 0.04 | 0.53 | 0.07 | 0.31 | 0.03 | 0.12 | 0.03 |
| Misc. | 0.84 | 0.15 | 0.87 | 0.11 | 0.85 | 0.09 | 0.84 | 0.21 |
| Gross cos | 9.97 | 1.84 | 11.70 | 1.52 | 13.65 | 1.40 | 10.21 | 2.55 |
| Net cost | 9.74 | 1.80 | 11.42 | 1.84 | 13.37 | 1.37 | 9.91 | 2.48 |
| Average Yeild per cattle/ buffalo per day | 5.42 | 7.70 | 9.76 | 4.00 | ||||
Source: Cost of milk production at NDRI Farm, Karnal, India.
NDRI Publication No. 175.
US$1.00 = Indian Rps. 13.1
Taken from Amir and Knipscheer, 1987. Ch. 7, p. 18.
Table 16. Cost of Urea-treated Rice Straw, Thailand
| Item | Quantity | Value (Baht) |
| Straw | 1500 kg | 45 |
| Transportation | 200 | |
| Urea (46% N) | 90 kg | 540 |
| Plastic | 1 round | 120 |
| Hired labour | 2 persons | 50 |
| Family labour | 1 person | |
| Water | 1500 litre | |
| Total | 955 | |
| Cost/kg | 0.63 |
Source: Bhasayavan, et. al. 1986, p. 76
Baht 26 = US$1.00
Table 17. Cost of Fodder Production On-Farm Research Trial, India
| Item | Kharif (Rainy) | Rabi (Winter) | Summer Maize + Cowpea (Rs/ha) | ||||
| Maize + cowpea | Maize | Multi-cut mixture | Berseem + mustard | Lucerne | Oats | ||
| Variable cost | |||||||
Seed | 268.52 | 225.72 | 218.74 | 386.25 | 405.00 | 312.50 | 309.88 |
Fertilizer and manures | 711.97 | 697.14 | 681.86 | 601.86 | 699.50 | 523.25 | 438.07 |
Other cash expenses | 50.91 | 52.02 | 49.00 | 240.38 | 244.99 | 93.33 | 85.72 |
Human labour | 873.98 | 919.06 | 965.28 | 1712.52 | 1179.84 | 974.28 | 716.50 |
Bullock/tractor charges | 260.40 | 396.22 | 389.37 | 668.19 | 497.50 | 391.36 | 262.53 |
Interest on cash expenses | 28.12 | 17.75 | 23.76 | 84.71 | 95.68 | 43.52 | 27.36 |
Total variable cost | 2193.90 | 2308.01 | 2327.35 | 3693.91 | 3122.51 | 2338.24 | 1840.06 |
| Fixed cost | |||||||
Land rent | 520.60 | 349.35 | 452.10 | 1349.45 | 1424.80 | 876.80 | 520.60 |
Depreciation and interest on fixed assets | 234.84 | 157.59 | 203.94 | 608.73 | 642.72 | 395.52 | 234.84 |
Total fixed cost | 755.44 | 506.94 | 656.04 | 1958.18 | 2067.52 | 1272.32 | 755.44 |
Gross cost | 2949.34 | 2814.95 | 2983.39 | 5652.09 | 5190.03 | 3610.56 | 2595.50 |
Yield (quintal/ha) | 484.10 | 490.48 | 531.69 | 978.36 | 820.30 | 495.56 | 388.20 |
Cost per quintal | 6.09 | 5.74 | 5.61 | 5.78 | 6.33 | 7.29 | 6.69 |
Source: Singh, 1987, p. 51.
NB: One quintal is equivalent to 100 kg. US$1.00 = Indian Rps. 11.1.
Table 18. Gross Margin for Sheep Intergration Under Oil Palm (2 years)
| Gross Production Income | |||
Sales of animals | $ 2,450.20 | ||
Net inventory change of sheep | 18,425.00 | ||
Total | $20,875.20 | ||
| Variable Costs | |||
Brooms and basins | 55.70 | ||
Ropes | 15.50 | ||
Medication | 237.40 | ||
Milk supplements | 123.50 | ||
Salt | 62.50 | ||
Hired labour | 1,002.00 | ||
Miscellaneous | 62.40 | ||
| Gross Margin | $19,316.25 | ||
| Fixed Costs | |||
Depreciation costs a | - shed | 3,911.46 | |
| - fencing | 416.00 | ||
Total fixed costs | 4,327.46 | ||
| Net Farm Income | $14,988.79 |
| a) Fixed costs - Shed = $9,788.65 | |||
- Fencing = $1,040.00 | |||
| b) Sales of Animals | |||
3 animals sold at $7.50/kg | $950.20 | ||
10 animals sold at $5.20/kg | $1,500.00 | ||
| $2,450.00 | |||
| c) Net Inventory Change | |||
| Weight (kg) | Value/animal | No. of animals | Value ($) |
| >20 | 150.00 | 79 | 11,850.00 |
| 15–20 | 100.00 | 30 | 3,000.00 |
| 10–15 | 75.00 | 27 | 2,025.00 |
| 5–10 | 50.00 | 26 | 1,300.00 |
| <5 | 25.00 | 10 | 250.00 |
| 18,425.00 | |||
Source: Lai, 1987. p. 88.
Note: a Depreciation rate = 20% of total capital expenditure per year
US$1.00 = M$2.60.
Table 19. Gross Margin for cattle Fattening on Feedlot Using Palm Kernel-based Rations (5 months)
| Gross Production Income Sales of Cattle (7 animals) | ||
| Variable Costs | ||
Cost of feeder cattle | 4,350.00 | |
Palm kernel cake | 787.50 | |
Vitamins | 101.25 | |
Urea | 22.00 | |
Salt | 12.50 | |
Processing costs | 75.00 | |
Miscellaneous costs | 100.00 | |
Total variable costs | 5,435.75 | |
| Gross Margin | 1,664.25 | |
| Fixed Costs | ||
Depreciation costs a | 153.30 | |
| Net Farm Income | 1,510.95 | |
| Fixed Costs | ||
Shed | 800.00 | |
Cocoa pod crusher | 750.00 | |
Water pump | 750.00 |
Source: Lai, 1987. p. 89.
Note: a Depreciation rate = 20% of total capital expenditure per year.
US$1.00 = M$2.60.
The implications of applying these research results over time is shown in Table 22 which traces selected technical and economic parameters over time. The change in income are particularly useful as they examine family labour income increases, probably the key measure for evaluating economic attractiveness to the farm household.
Turning now to Southeast Asia, the use of non-conventional feeds for pil fattening was examined by Posas (1986). tHe ration formulations and productivity measures are presented in Table 23 while the returns above feed costs are presented in Table 24. These results appear very promising for areas having low cost production of sweet potato or cassava.
A comprehensive study of gross margins of fodder production activities was carried out by Jost (1986) for Punjab State, Pakistan. The analysis distinguishes between owner-operators (0) calculate variable and margin costs of producing nutrients through different fodder production activities. These gross margins also serve as inputs into the linear programming models for these farms. The procedures used to construct these gross margins are too complicated to discuss in this paper. However, those increased in carrying out detailed studies of dairying should carefully study the Jost (1986) volumes.
![]()
![]()
![]()