![]()
![]()
![]()
The source of nitrogen compounds of biological importance is molecular nitrogen (N2) in air. We have already referred to the composition of air and solubility of atmospheric gases in water (see D.O)
The nitrogen cycle involves ammonia fixing and nitrifying reactions in organising and denitrification, which is the same process in reverse. The nitrification process involves oxidation of ammonia to nitrite and nitrite to nitrate which is an energy yielding process utilized by nitrifying bacteria. The reduction of nitrate to N2 is brought about by denitrifying bacteria.
The different forms of nitrogen present in natural waters include: molecular nitrogen (N2) in solution, organic compounds, protein and their breakdown products (amino-acids, urea and methylamines); ammonia as NH3, NH+4 and NH4OH; nitrite as NO2 mainly and fractions as HNO2; and nitrate as NO3.
We have referred to the solubility of N2 and trace argon in water (Table ). Nitrogen is a biological inert gas and the problem of excess N2 in water is that of supersaturations. Often supersaturations exist in waters pumped up from subsoil water and also in cases where rapid waring takes place. If air saturation increases over 110%, this supersaturation can cause problems in several fishes, by causing “gas emboliture” or the gas bubble disease. it is important to recognize that with increase in depth the contents of dissolved gases in uses increase (Table 9.II) and this has implications in using water pumped up from depths for aquaculture purposes. Atmospheric nitrogen is fixed by Heterocyst bearing blue green algae (Nosloo, Anabaena) and possibly also by other blue greens.
Unlike nitrogen and oxygen ammonia is highly soluble in water. In natural waters where decomposition of organic matter takes place ammonia level will be high. Ammonia increase is often concommittant with decrease in DO and increase in CO2. The level of ammonia will also depend on the activity of the nitrifying and denitrifying bacteria, referred to earlier. Ammonia is important as the predomine excretory product of aquatic animals and in high density culture high ammonia levels can develop, though NH3 excreted directly and also by degradation of faecel matter and uncaten feed.
In natural waters, where extensive fish culture can be practised,
ammonia levels can be high at the bottom. A depth profile of distribution
of nitrogenious compounds namely NH3, NO2 and NO3 along with temperature
and redox potential, discussed earlier, in a lake is given in Fig.9.18
seen in the hypolimmetic waters ammonia is high. NO2, a transcient
form is low and NO3 is higher in
Ammonia is highly toxic at levels less than 0.1 mg/l even they cause toxic effects in several fishes. Tropical species can withstand higher toxicities and tropical fish ponds develop ammonia. Levels as high over 3 – 4 mg/l which is sustained by carps and tilapias.
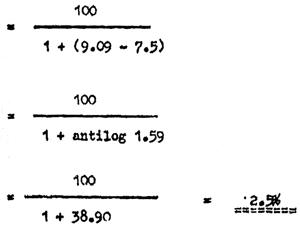
The toxicity of ammonia is mainly caused by the unionised ammonia (UIA) (NH3). Mead (1985) observes that NH3 (UIA) is 300 – 400 times more toxic than NH4. The effect of ammonia toxicity is high, at higher pH, the proportion of unionised ammonia being higher at higher pH. This aspect has been indeed well studied recently, especially owing to its importance in intensive culture systems (Tiews, 1982).
The amount of UIA at different levels of pH can be calculated from
the
| Temp. (°C) | 5 | 10 | 15 | 20 | 25 | 30 |
| pka | 9.90 | 9.73 | 9.56 | 9.40 | 9.24 | 9.09 |
Using the formula:
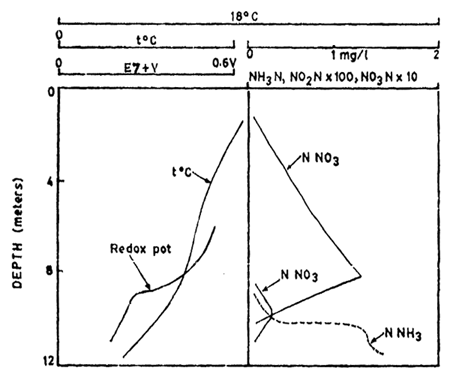
Fig. 9.18. Distribution of ammonia, nitrite, nitrate and redox potential and temperature in a temperate
lake.
(After Hutchinson, 1957)
The levels of UIA can be estimated:
e.g. UIA at 30°C and pH 7.5
The % UIA in aqueous solution at different pH and temperature has been tabulated by several workers (eg. Wickins, 1976). EIFAC 91986) recommends total unionized ammonia contents in fresh water, taken from Emorsion et al (1975), provided dissolved solid content is neglifible. These values are reproduced in Table 9.V, where % UIA values for 0 – 30°C, at pH 6 – 10 are given. % UIA values for salt waters (8 – 22 ‰ S) and 23 – 27%) are given in Tables 9.VI and 9.VIII respectively. % UIA values for S = 32 – 40%, are given in Table 9.VII.
% UIA in fresh water vary differently at different levels of dissolved solids (TDS). Values calculated for values pH values (6.0 – 10.0), for TDS values of range 0 – 1600 mg/l are given in Table 9.IX
TABLE 9.V
Percent NH3 in aqueous ammonia solutions for 0–30°C and pH 6–10 (source Emerson et al., 1975, in EIFAC, 1986)
| Temp (°C) | 6.0 | 6.5 | 7.0 | 7.5 | 8.0 | 8.5 | 9.0 | 9.5 | 10.0 |
| 0 | .00827 | .0261 | .0826 | .261 | .820 | 2.55 | 7.64 | 20.7 | 45.3 |
| 1 | .00899 | .0284 | .0898 | .284 | .891 | 2.77 | 8.25 | 22.1 | 45.3 |
| 2 | .00977 | .0309 | .0977 | .308 | .968 | 3.00 | 8.90 | 23.6 | 49.4 |
| 3 | .0106 | .0336 | .106 | .335 | 1.05 | 3.25 | 9.60 | 25.1 | 51.5 |
| 4 | .0115 | .0364 | .115 | .363 | 1.14 | 3.52 | 10.3 | 26.7 | 53.5 |
| 5 | .0125 | .0395 | .125 | .394 | 1.23 | 3.80 | 11.1 | 28.3 | 55.6 |
| 6 | .0136 | .0429 | .135 | .427 | 1.34 | 4.11 | 11.9 | 30.0 | 57.6 |
| 7 | .0147 | .0464 | .147 | .462 | 1.45 | 4.44 | 12.8 | 31.7 | 59.6 |
| 8 | .0159 | .0503 | .159 | .501 | 1.57 | 4.79 | 13.7 | 33.5 | 61.4 |
| 9 | .0172 | .0544 | .172 | .542 | 1.69 | 5.16 | 14.7 | 35.3 | 63.3 |
| 10 | .0186 | .0589 | .186 | .586 | 1.83 | 5.56 | 15.7 | 37.1 | 65.1 |
| 11 | .0201 | .0637 | .201 | .633 | 1.97 | 5.99 | 16.8 | 38.9 | 66.8 |
| 12 | .218 | .0688 | .217 | .684 | 2.13 | 6.44 | 17.9 | 40.8 | 68.5 |
| 13 | .0235 | .0743 | .235 | .738 | 2.30 | 6.92 | 19.0 | 42.6 | 70.2 |
| 14 | .0254 | .0802 | .253 | .796 | 2.48 | 7.43 | 20.2 | 44.4 | 71.7 |
| 15 | .0274 | .0865 | .273 | .859 | 2.67 | 7.97 | 21.5 | 46.4 | 73.3 |
| 16 | .0295 | .0933 | .294 | .925 | 2.87 | 8.54 | 22.8 | 48.3 | 74.7 |
| 17 | .0318 | .101 | .317 | .996 | 3.08 | 9.14 | 24.1 | 50.2 | 76.1 |
| 18 | .0343 | .108 | .342 | 1.07 | 3.31 | 9.78 | 25.5 | 52.0 | 77.4 |
| 19 | .0364 | .117 | .368 | 1.15 | 3.56 | 10.5 | 27.0 | 53.9 | 78.7 |
| 20 | .0397 | .125 | .396 | 1.24 | 3.82 | 11.2 | 28.4 | 55.7 | 79.9 |
| 21 | .0427 | .135 | .425 | 1.33 | 4.10 | 11.9 | 29.9 | 57.5 | 81.0 |
| 22 | .0459 | .145 | .457 | 1.43 | 4.39 | 12.7 | 31.5 | 59.2 | 82.1 |
| 23 | .0493 | .156 | .491 | 1.54 | 4.70 | 13.5 | 33.0 | 60.9 | 83.2 |
| 24 | .0530 | .167 | .527 | 1.65 | 5.03 | 14.4 | 34.6 | 62.6 | 84.1 |
| 25 | .0569 | .180 | .566 | 1.77 | 5.38 | 15.3 | 36.3 | 64.3 | 85.1 |
| 26 | .0610 | .193 | .607 | 1.89 | 5.75 | 16.2 | 37.9 | 65.9 | 85.9 |
| 27 | .0654 | .207 | .651 | 2.03 | 6.15 | 17.2 | 39.6 | 67.4 | 86.8 |
| 28 | .0701 | .221 | .697 | 2.17 | 6.56 | 18.2 | 41.2 | 68.9 | 87.5 |
| 29 | .0752 | .237 | .747 | 2.32 | 7.00 | 19.2 | 42.9 | 70.4 | 88.3 |
| 30 | .805 | .254 | .799 | 2.48 | 7.46 | 20.3 | 44.6 | 71.8 | 89.0 |
| 32* | - | - | .950 | - | 8.77 | - | 49.0 | - | 90.6 |
TABLE 9.VI
Percent un-ionized ammonia in seawater (S=18–22‰) at different temperatures and pH's (source, EIFAC, 1986)
| pH | |||||||||||
| Temp (°C) | 7.5 | 7.6 | 7.7 | 7.8 | 7.9 | 8.0 | 8.1 | 8.2 | 8.3 | 8.4 | 8.5 |
| 10 | 0.527 | 0.662 | 0.832 | 1.05 | 1.31 | 1.65 | 2.07 | 2.59 | 3.23 | 4.04 | 5.03 |
| 15 | 0.763 | 0.959 | 1.20 | 1.51 | 1.90 | 2.37 | 2.97 | 3.71 | 4.63 | 5.76 | 7.14 |
| 20 | 1.11 | 1.39 | 1.74 | 2.18 | 2.73 | 4.41 | 4.26 | 5.30 | 6.58 | 8.15 | 10.0 |
| 25 | 1.60 | 2.00 | 2.51 | 3.14 | 3.91 | 4.88 | 6.07 | 7.62 | 9.28 | 11.40 | 14.00 |
| 30 | 2.24 | 2.81 | 3.51 | 4.38 | 5.45 | 6.77 | 8.38 | 10.32 | 12.65 | 15.43 | 18.67 |
TABLE 9.VII
Percent un-ionized ammonia in seawater (S=23–27‰) at different temperatures and pH's. (source, EIFAC, 1986)
| pH | |||||||||||
| Temp. (°C) | 7.5 | 7.6 | 7.7 | 7.8 | 7.9 | 8.0 | 8.1 | 8.2 | 8.3 | 8.4 | 8.5 |
| 10 | 0.492 | 0.618 | 0.777 | 0.977 | 1.23 | 1.54 | 1.93 | 2.42 | 3.03 | 3.78 | 4.71 |
| 15 | 0.713 | 0.896 | 1.13 | 1.41 | 1.77 | 2.22 | 2.78 | 3.47 | 4.33 | 5.39 | 6.70 |
| 20 | 1.03 | 1.30 | 1.63 | 2.04 | 2.55 | 3.19 | 3.98 | 4.97 | 6.17 | 7.65 | 9.44 |
| 25 | 1.49 | 1.87 | 2.34 | 2.93 | 3.66 | 4.57 | 5.68 | 7.05 | 8.72 | 10.7 | 13.10 |
| 30 | 2.16 | 2.71 | 3.301 | 4.23 | 5.26 | 6.54 | 8.09 | 9.98 | 12.25 | 14.94 | 18.11 |
TABLE 9. VIII
Percent un-ionized ammonia in seawater (S=32–40‰) at different timperatures and pH's (source, EIFAC, 1986)
| pH | |||||||||||
| Temp. (°C) | 7.5 | 7.6 | 7.7 | 7.8 | 7.9 | 8.0 | 8.1 | 8.2 | 8.3 | 8.4 | 8.5 |
| 10 | 0.459 | 0.577 | 0.726 | 0.912 | 1.15 | 1.44 | 1.80 | 2.26 | 2.83 | 3.54 | 4.41 |
| 15 | 0.665 | 0.836 | 1.05 | 1.32 | 1.66 | 2.07 | 2.60 | 3.25 | 4.06 | 5.05 | 6.28 |
| 20 | 0.963 | 1.21 | 1.52 | 1.90 | 2.39 | 2.98 | 3.73 | 4.65 | 5.78 | 7.17 | 8.87 |
| 25 | 1.39 | 1.75 | 2.19 | 2.74 | 3.43 | 4.28 | 5.32 | 6.61 | 8.18 | 10.1 | 12.40 |
| 30 | 2.02 | 2.52 | 3.16 | 3.94 | 4.91 | 6.11 | 7.57 | 9.35 | 11.49 | 14.05 | 17.06 |
TABLE 9.IX
Percent un-ionized ammonia NH3 (aq), in freshwater (TDS = 0–1600 mg/L as a function of total dissolved solids, temperature, and pH. Ionic strength was calculated using equation (12) (source: Messer et al 1984; in EIFAC, 1986)
| TDS (mg/L) | ||||||
| T(°C) | pH | 0 | 400 | 800 | 1200 | 1600 |
| 0 | 6.0 | 0.00824 | 0.00743 | 0.00716 | 0.00697 | 0.00682 |
| 6.5 | 0.0260 | 0.0235 | 0.0226 | 0.0220 | 0.0216 | |
| 7.0 | 0.0823 | 0.0743 | 0.0716 | 0.0697 | 0.0682 | |
| 7.5 | 0.260 | 0.235 | 0.226 | 0.220 | 0.215 | |
| 8.0 | 0.817 | 0.738 | 0.711 | 0.692 | 0.678 | |
| 8.5 | 2.54 | 2.30 | 2.22 | 2.16 | 2.11 | |
| 9.0 | 7.61 | 6.92 | 6.68 | 6.52 | 6.39 | |
| 9.5 | 20.67 | 19.04 | 18.47 | 18.07 | 17.70 | |
| 10.0 | 45.18 | 42.64 | 41.73 | 41.08 | 40.60 | |
| 10 | 6.0 | 0.0186 | 0.0167 | 0.0161 | 0.0157 | 0.0153 |
| 6.5 | 0.0587 | 0.0529 | 0.0509 | 0.0496 | 0.0485 | |
| 7.0 | 0.185 | 0.167 | 0.161 | 0.157 | 0.153 | |
| 7.5 | 0.584 | 0.526 | 0.507 | 0.493 | 0.483 | |
| 8.0 | 1.82 | 1.65 | 1.59 | 1.54 | 1.51 | |
| 8.5 | 5.55 | 5.03 | 4.85 | 4.72 | 4.63 | |
| 9.0 | 15.66 | 14.33 | 13.87 | 13.55 | 13.30 | |
| 9.5 | 37.00 | 34.60 | 33.75 | 33.14 | 32.66 | |
| 10.0 | 65.00 | 62.59 | 61.70 | 61.05 | 60.53 | |
| 15 | 6.0 | 0.0273 | 0.0246 | 0.0237 | 0.0230 | 0.0225 |
| 6.5 | 0.0863 | 0.0777 | 0.0747 | 0.0727 | 0.0711 | |
| 7.0 | 0.0272 | 0.0245 | 0.0236 | 0.0230 | 0.0225 | |
| 7.5 | 0.856 | 0.771 | 0.742 | 0.722 | 0.707 | |
| 8.0 | 2.66 | 2.40 | 2.31 | 2.25 | 2.20 | |
| 8.5 | 7.95 | 7.21 | 6.96 | 6.70 | 6.65 | |
| 9.0 | 21.45 | 19.73 | 19.13 | 18.71 | 18.37 | |
| 10.0 | 71.19 | 71.08 | 70.28 | 69.71 | 69.24 | |
| 20 | 6.0 | 0.0396 | 0.0356 | 0.0343 | 0.0333 | 0.0326 |
| 6.5 | 0.125 | 0.113 | 0.108 | 0.105 | 0.103 | |
| 7.0 | 0.395 | 0.355 | 0.342 | 0.332 | 0.325 | |
| 7.5 | 1.24 | 1.11 | 1.07 | 1.04 | 1.03 | |
| 8.0 | 3.81 | 3.44 | 3.31 | 3.23 | 3.16 | |
| 8.5 | 11.13 | 10.12 | 9.78 | 9.54 | 9.35 | |
| 9.0 | 28.37 | 26.26 | 25.52 | 25.00 | 25.59 | |
| 9.5 | 55.60 | 52.97 | 52.01 | 51.32 | 50.76 | |
| 10.0 | 79.84 | 78.08 | 77.41 | 76.92 | 76.53 | |
| 25 | 6.0 | 0.0567 | 0.0510 | 0.0490 | 0.0477 | 0.0466 |
| 6.5 | 0.179 | 0.161 | 0.155 | 0.151 | 0.147 | |
| 7.0 | 0.564 | 0.507 | 0.488 | 0.475 | 0.464 | |
| 7.5 | 1.76 | 1.57 | 1.53 | 1.49 | 1.45 | |
| 8.0 | 5.37 | 4.85 | 4.67 | 4.55 | 4.46 | |
| 25 | 8.5 | 15.21 | 13.88 | 13.43 | 13.10 | 12.85 |
| 9.0 | 36.20 | 33.77 | 32.90 | 32.29 | 31.80 | |
| 10.0 | 85.01 | 83.60 | 83.06 | 82.66 | 82.34 | |
| 30 | 6.0 | 0.0803 | 0.0721 | 0.0693 | 0.0674 | 0.0659 |
| 6.5 | 0.253 | 0.228 | 0.219 | 0.213 | 0.208 | |
| 7.0 | 0.797 | 0.716 | 0.689 | 0.670 | 0.665 | |
| 7.5 | 2.48 | 2.23 | 2.15 | 2.09 | 2.04 | |
| 8.0 | 7.44 | 6.73 | 6.48 | 6.31 | 6.18 | |
| 8.5 | 20.26 | 18.57 | 17.98 | 17.57 | 17.24 | |
| 9.0 | 44.55 | 41.90 | 40.95 | 40.26 | 39.72 | |
| 9.5 | 71.76 | 69.51 | 68.68 | 68.07 | 67.57 | |
Nitrite is present in natural waters only in smaller quantities. It has been found to be toxic to fish, as NO2 combines with haemaglobin, and forms mothhaemoglobin, causing the brown coloration of blood (Russo et al, 1981). The presence of chloride ions (Perrone and Meads, 1977) and calcium (Crawford and Allen, 1977) inhibit nitrite toxicity. In contrast to ammonia, nitrite toxicity increases at lower pH levels (Wedemeyor and Yasutake, 1978, Russo et al, 1981). EIFAC (1986) therefore recommends that levels of pH, calcium content (bioarbonate hardness) and chloride content (salinity) should be indicated when reporting NO2 concentrations.
Wickins (1982) suggests that NO2 concentration in hard fish water pond in fish oulture should not exceed 0.1 mg NO2-N/1, and in seawater, 1.0 mg NO2-N/1.
Nitrate is the major form of nitrogen used by phytoplankton and is next in importance only to P2O5 in pond fish production. A specific level of N:1 ration of 4:1 in water is considered optimal for better fish production (Hepher and Pruginun, ) suggest that in fish ponds in Israel, levels higher than 1.4 mg N/1 do not haveany effect in increasing productivity. Also important is the C:N ratio of organic fertilizers used. Maures with a higher N-content are preferred over those with the lower ratio, since the higher N-content favours faster mineralization of organic matter and thereby enhances phytoplankton production. These aspects will be discussed under “fertilization - Pond Culture”.
Wickins (1982) reports that no concentration effects to fish have been reported at nitrate level below 100 mg NO3-N/litre. The importance of N-compounds in waters need prime consideration in site selection and in planning fish farm production, especially in view of the N-fertilizers used.
![]()
![]()
![]()