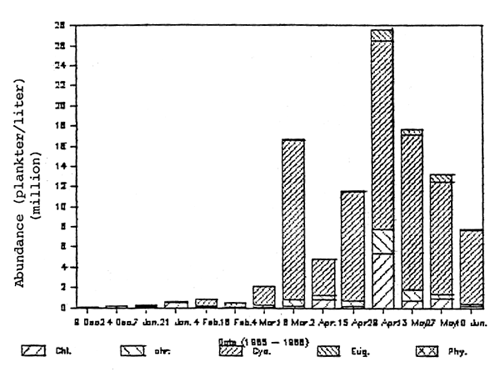
Table 1. Average of phytoplankton abundance (1,000 plankter/litre) in the ponds during experiment period.
| Organism group | With paddle wheel aeration | |||||||||||||
| 9 Dec. | 24 Dec. | 7 Jan. | 21 Jan. | 4 Feb. | 18 Feb. | 4 Mar. | 18 Mar. | 2 Apr. | 15 Apr. | 29 Apr. | 13 May | 27 May | 10 Jun. | |
| Chlorophyta | 23 | 161 | 31 | 472 | 33 | 62 | 82 | 167 | 870 | 221 | 5352 | 700 | 922 | 132 |
| Chrysophyta | 52 | 52 | 180 | 73 | 138 | 54 | 196 | 617 | 441 | 472 | 2413 | 1106 | 479 | 261 |
| Cyanophyta | 21 | 17 | 83 | 28 | 693 | 348 | 1868 | 15776 | 3513 | 10782 | 18718 | 15299 | 11096 | 7320 |
| Euglenophyta | 5 | 0 | 1 | 4 | 2 | 35 | 18 | 119 | 40 | 130 | 1117 | 590 | 700 | 98 |
| Phyrophyta | 0 | 0 | 1 | 12 | 11 | 16 | 1 | 0 | 28 | 0 | 0 | 0 | 0 | 1 |
Total | 100 | 230 | 295 | 589 | 876 | 514 | 2165 | 16680 | 4892 | 11604 | 27600 | 17695 | 13197 | 7811 |
| Without paddle wheel aeration | ||||||||||||||
| Chlorophyta | 164 | 35 | 116 | 93 | 165 | 252 | 71 | 33 | 992 | 299 | 175 | 406 | 406 | 216 |
| Chrysophyta | 134 | 47 | 88 | 122 | 125 | 209 | 213 | 79 | 629 | 255 | 1867 | 590 | 406 | 420 |
| Cyanophyta | 15 | 38 | 64 | 20 | 315 | 984 | 3187 | 1438 | 9251 | 9501 | 14319 | 13787 | 14685 | 17626 |
| Euglenophyta | 7 | 2 | 1 | 3 | 13 | 39 | 24 | 5 | 33 | 77 | 828 | 184 | 516 | 168 |
| Phyrophyta | 0 | 0 | 1 | 3 | 27 | 34 | 3 | 1 | 2 | 0 | 0 | 0 | 0 | 0 |
Total | 318 | 121 | 269 | 240 | 645 | 1518 | 3496 | 1556 | 10907 | 10131 | 17189 | 14966 | 16012 | 18429 |
Table 2. Maximum (N), Time (t) to reach maximum population and exponential growth rate (r) of phytoplankton during experimental period
| With paddle wheel | Without paddle wheel | ||||||
| Organisms group | N (1,000 p1/1) | t (weeks) | r | N (1,000 p1/1) | t (weeks) | r | |
| Chlorophyta | Pond 1 | 1,421 | 16 | 0.4 | 1,797 | 16 | 2.1 |
| Pond 2 | 10,617 | 20 | 2.0 | 442 | 22 | 0.2 | |
| Average | 6,019 | 18 | 1.2 | 1,120 | 19 | 1.2 | |
| Chrysophyta | Pond 1 | 885 | 22 | 0.2 | 3,439 | 20 | 1.8 |
| Pond 2 | 4,424 | 20 | 0.6 | 885 | 22 | 0.5 | |
| Average | 2,65 | 21 | 0.4 | 2,162 | 21 | 1.2 | |
| Cyanophyta | Pond 1 | 12,829 | 22 | 0.4 | 23,551 | 20 | 0.9 |
| Pond 2 | 28,102 | 14 | 1.0 | 20,449 | 24 | 0.3 | |
| Average | 20,466 | 18 | 0.7 | 22,000 | 22 | 0.6 | |
| Euglenophyta | Pond 1 | 465 | 20 | 0.7 | 811 | 24 | 0.5 |
| Pond 2 | 1,770 | 20 | 0.9 | 1,475 | 20 | 0.7 | |
| Average | 1,118 | 20 | 0.8 | 1,143 | 22 | 0.6 | |
| Phyrophyta | Pond 1 | 28 | 16 | 0.6 | 19 | 10 | 0.3 |
| Pond 2 | 31 | 10 | 0.3 | 49 | 10 | 0.4 | |
| Average | 30 | 13 | 0.5 | 34 | 10 | 0.3 | |
| T o t a l | Pond 1 | 14,893 | 22 | 0.3 | 27,227 | 20 | 0.9 |
| Pond 2 | 44,384 | 20 | 0.7 | 21,408 | 24 | 0.3 | |
| Average | 29,639 | 21 | 0.5 | 24,318 | 22 | 0.6 | |
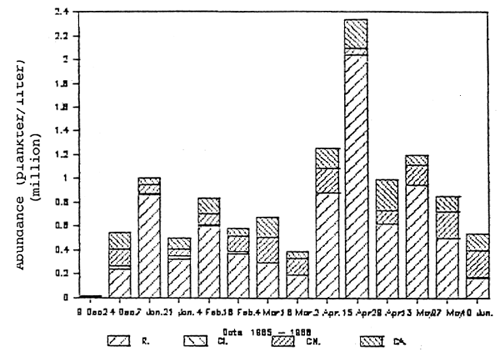
Table 3. Average zooplankton abundance (plankter/litre) in ponds during experiment period.
| Organism group | with paddle wheel aeration | |||||||||||||
| 9 Dec. | 24 Dec. | 7 Jan. | 21 Jan. | 4 Feb. | 18 Feb. | 4 Mar. | 18 Mar. | 2 Apr. | 15 Apr. | 29 Apr. | 13 May | 27 May | 10 Jun. | |
| Rotifer | 10 | 402 | 1125 | 790 | 216 | 322 | 367 | 223 | 1270 | 2425 | 565 | 1188 | 1267 | 247 |
| Cladocera | 83 | 15 | 6 | 3 | 8 | 4 | 2 | 1 | 3 | 1 | 1 | 6 | ||
| Copepoda | ||||||||||||||
Nauplius | 25 | 222 | 39 | 167 | 98 | 95 | 282 | 155 | 353 | 155 | 140 | 188 | 253 | 419 |
Adult | 6 | 178 | 77 | 77 | 80 | 33 | 180 | 79 | 236 | 197 | 278 | 213 | 114 | 109 |
| Total | 18 | 885 | 1255 | 1040 | 396 | 457 | 832 | 463 | 1860 | 2778 | 983 | 1588 | 1634 | 780 |
| Without paddle wheel aeration | ||||||||||||||
| Rotifer | 6 | 243 | 864 | 325 | 603 | 370 | 293 | 195 | 884 | 2045 | 625 | 947 | 501 | 167 |
| Cladocera | 25 | 11 | 27 | 13 | 22 | 6 | 2 | 1 | 1 | 1 | 4 | |||
| Copepoda | ||||||||||||||
Nauplius | 3 | 137 | 73 | 60 | 87 | 127 | 212 | 132 | 202 | 54 | 111 | 168 | 220 | 227 |
Adult | 10 | 145 | 56 | 89 | 130 | 67 | 165 | 59 | 169 | 242 | 257 | 89 | 134 | 143 |
| Total | 18 | 549 | 1003 | 500 | 832 | 585 | 675 | 389 | 1255 | 2340 | 993 | 1203 | 855 | 540 |
Table 4. Maximum (N), Time (t) to reach maximum population and exponential growth rate (r) of zooplankton during experimental period
| With paddle wheel | Without paddle wheel | ||||||
| Organisms group | N(plankter/1) | t (weeks) | r | N (plankter/1) | t (weeks) | r | |
| Rotifer | Pond 1 | 3,505 | 18 | 0.6 | 3,366 | 18 | 0.6 |
| Pond 2 | 1,344 | 18 | 0.7 | 1,042 | 22 | 0.4 | |
| Average | 2,425 | 18 | 0.7 | 2,204 | 20 | 0.5 | |
| Cladocera | Pond 1 | 38 | 2 | 1.8 | 23 | 2 | 1.1 |
| Pond 2 | 127 | 2 | 2.4 | 43 | 10 | 0.4 | |
| Average | 83 | 2 | 2.1 | 33 | 6 | 0.8 | |
| Copepoda | Pond 1 | 476 | 16 | 0.8 | 270 | 24 | 0.2 |
Nauplius | Pond 2 | 338 | 12 | 0.3 | 169 | 24 | 0.3 |
| Average | 407 | 14 | 0.6 | 220 | 24 | 0.3 | |
| Copepoda | Pond 1 | 261 | 18 | 0.2 | 426 | 18 | 0.4 |
Adult | Pond 2 | 393 | 20 | 0.2 | 299 | 20 | 0.4 |
| Average | 327 | 19 | 0.2 | 363 | 19 | 0.4 | |
| T o t a l | Pond 1 | 3,994 | 18 | 0.5 | 3,863 | 18 | 0.5 |
| Pond 2 | 1,562 | 18 | 0.4 | 1,319 | 20 | 0.2 | |
| Average | 2,778 | 18 | 0.5 | 2,591 | 19 | 0.4 | |
Table 5. Chlorophyll a concentration (ug/L) in pond water.
D a t e | With paddle wheel aeration | Without paddle wheel aeration | ||||
1985–1986 | Pond 1 | Pond 2 | Average | Pond 1 | Pond 2 | Average |
| 9 Dec. | 22.6 | 13.1 | 17.9 | 19.0 | 9.5 | 14.3 |
| 24 Dec. | 8.3 | 9.5 | 8.9 | 25.0 | 13.1 | 19.1 |
| 7 Jan. | 9.5 | 10.7 | 10.1 | 9.5 | 1.2 | 5.4 |
| 21 Jan. | 18.6 | 11.4 | 15.0 | 15.7 | 17.1 | 16.4 |
| 4 Feb. | 11.4 | 1.4 | 6.4 | 10.0 | 7.1 | 8.6 |
| 18 Feb. | 61.4 | 38.6 | 50.0 | 50.0 | 20.0 | 35.0 |
| 4 Mar. | 134.3 | 67.1 | 100.6 | 112.8 | 30.0 | 71.4 |
| 18 Mar. | 219.6 | 151.0 | 185.3 | 158.5 | 153.5 | 156.0 |
| 2 Apr. | 197.1 | 302.7 | 249.9 | 339.9 | 231.3 | 285.6 |
| 15 Apr. | 87.1 | 264.2 | 175.7 | 127.1 | 125.7 | 126.4 |
| 29 Apr. | 157.1 | 304.2 | 230.7 | 139.9 | 214.2 | 177.1 |
| 13 May | 225.6 | 209.9 | 217.8 | 192.8 | 201.3 | 197.1 |
| 27 May | 267.0 | 264.2 | 265.6 | 247.0 | 264.2 | 255.6 |
| 10 Jun. | 134.2 | 298.5 | 216.4 | 58.5 | 211.3 | 134.9 |
Table 6. Organic matter particulate (mg/m2) in pond bottom during experimental period.
| Date 1986 | With Paddle Wheel aeration | Without paddle wheel aeration | ||||||||||
| with cover | without cover | with cover | without cover | |||||||||
| Pond 1 | Pond 2 | Average | Pond 1 | Pond 2 | Average | Pond 1 | Pond 2 | Average | Pond 1 | Pond 2 | Average | |
| 7 Jan. | 87 | 34 | 61 | 71 | 48 | 60 | 74 | 74 | 74 | 111 | 48 | 80 |
| 11 Feb. | 178 | 134 | 156 | 93 | 102 | 98 | 115 | 107 | 111 | 82 | 98 | 90 |
| 11 Mar. | 256 | 191 | 224 | 84 | 123 | 104 | 103 | 168 | 176 | 100 | 83 | 92 |
| 8 Apr. | 407 | 314 | 361 | 42 | 182 | 112 | 357 | 291 | 324 | 175 | 171 | 173 |
| 6 May. | 840 | 527 | 684 | 335 | 345 | 340 | 599 | 508 | 554 | 131 | 310 | 221 |
| 3 Jun. | 1,002 | 907 | 955 | 384 | 526 | 455 | 825 | 655 | 740 | 61 | 35 | 48 |
Note : - Diameter of organic matter equipment 12.8 cm, depth 13.0 cm.
- Diameter of screen (cover) 0.3 – 0.5 cm.
Table 7. Total counts of macrobenthos (number/m2) in pond bottom
| Treatment | 16 Dec. 86 | 7 Jan. 86 | 28 Jan. 86 | 25 Feb. 86 | 25 Mar. 86 | 22 Apr. 86 | 25 May 86 |
| With paddle wheel | |||||||
| Pond 1 | 329 | 3516 | 1385 | 426 | 337 | 524 | 2806 |
| Pond 2 | 36 | 586 | 1128 | 400 | 311 | 240 | 355 |
| Average | 183 | 2051 | 1257 | 413 | 324 | 382 | 1581 |
| Without paddle wheel | 142 | 2984 | 1669 | 639 | 471 | 293 | 435 |
| Pond 1 | 142 | 2984 | 1669 | 639 | 471 | 293 | 435 |
| Pond 2 | 36 | 968 | 524 | 231 | 98 | 98 | 240 |
| Average | 89 | 1976 | 1097 | 435 | 285 | 196 | 338 |
Table 8. Features of prawn samples taken for Mean Bulk Index estimate.
| P r a w n | ||||||||
| Sampling | Aeration | Pond | Weight | Total lenth | Standard length | Carapace length | Intestine length | |
| (Date) | Treatment | No. | (gram) | (cm) | (cm) | (cm) | (cm) | |
| First | With paddle | 1 | 0.1 | ±0.03 | 2.7 ±0.28 | 1.9 ±0.18 | 1.1 ±0.16 | 1.2 ±0.17 |
| 07 Jan '86 | wheel | 2 | 0.2 | ±0.03 | 2.9 ±0.26 | 2.1 ±0.19 | 1.3 ±0.09 | 1.3 ±0.12 |
| Without paddle | 1 | 0.2 | ±0.03 | 2.9 ±0.24 | 2.1 ±0.19 | 1.3 ±0.15 | 1.4 ±0.13 | |
| Wheel | 2 | 0.2 | ±0.09 | 2.7 ±0.56 | 1.9 ±0.39 | 1.1 ±0.30 | 1.7 ±0.66 | |
| Second | With paddle | 1 | 3.1 | ±2.90 | 5.3 ±1.45 | 7.4 ±2.03 | 3.7 ±1.15 | 3.7 ±1.02 |
| 04 Mar '86 | wheel | 2 | 4.9 | ±2.16 | 6.2 ±1.12 | 8.7 ±1.14 | 4.4 ±0.71 | 4.3 ±0.48 |
| Without paddle | 1 | 3.7 | ±1.34 | 5.9 ±0.87 | 7.9 ±1.04 | 3.9 ±0.59 | 4.5 ±0.54 | |
| wheel | 2 | 5.1 | ±2.70 | 6.4 ±0.68 | 8.7 ±1.04 | 4.3 ±0.64 | 4.8 ±0.80 | |
| Third | With paddle | 1 | 40.6 | ±17.14 | 11.7 ±1.71 | 14.9 ±2.19 | 7.3 ±1.27 | 8.2 ±1.38 |
| 06 Jun '86 | wheel | 2 | 47.7 | ±21.17 | 11.9 ±1.75 | 15.6 ±2.07 | 7.8 ±1.14 | 8.3 ±1.24 |
| Without paddle | 1 | 45.1 | ±16.83 | 12.0 ±1.41 | 15.5 ±1.75 | 7.5 ±0.94 | 8.5 ±0.97 | |
| wheel | 2 | 45.9 | ±21.56 | 11.8 ±1.66 | 15.4 ±2.15 | 7.7 ±1.24 | 8.4 ±1.63 | |
Table 9. Mean Bulk Index and food quantity estimated to five (first and second sampling) and sixteen prawns (third sampling) during esperiment period.
| Sampling Date | Aeration treatment | Pond No. | Mean Bulk Index (MBI) | Estimated feed quantity2) | |||||||
| Pellet | Detritus | Zooplankton | Phytoplankton | Animal1) | Aquatic plant | ½-full | ¼ - ½ | empty-¼ | |||
| First 7.1.86 | With paddle wheel | 1 | 1.0 | 7.0 | 4.0 | 2.3 | 5.7 | 7.0 | - | - | - |
| 2 | 1.0 | 7.0 | 5.0 | 2.0 | 7.0 | 7.0 | - | - | - | ||
| Without paddle wheel | 1 | 1.3 | 7.0 | 5.8 | 3.5 | 6.0 | 7.0 | - | - | - | |
| 2 | 1.4 | 7.0 | 7.0 | 1.6 | 7.0 | 7.0 | - | - | - | ||
| Second 4.3.86 | With paddle wheel | 1 | 1.0 | 7.0 | 3.3 | 4.3 | 2.7 | 3.7 | i=1 ;s=1 | - | i=4 ;s=4 |
| 2 | 1.0 | 7.0 | 5.4 | 4.4 | 2.6 | 2.4 | i=2 ;s=1 | i=2 ;s=1 | i=1 ;s=3 | ||
| Without paddle wheel | 1 | 2.0 | 7.0 | 6.3 | 4.3 | 1.8 | 2.3 | - | i=2 ;s=1 | i=3 ;s=4 | |
| 2 | 1.0 | 7.0 | 5.5 | 4.0 | 2.0 | 3.0 | - | i=2 | i=3 ;s=5 | ||
| Third 6.6.86 | With paddle wheel | 1 | 2.1 | 4.9 | 3.6 | 2.6 | 5.4 | 6.6 | s=2 | i=10;s=2 | i=6 ;s=12 |
| 2 | 1.5 | 5.0 | 3.4 | 3.1 | 5.4 | 6.8 | s=2 | i=8 ;s=3 | i=8 ;s=11 | ||
| Without paddle wheel | 1 | 1.6 | 4.9 | 3.7 | 2.9 | 5.9 | 6.4 | i=1 ;s=2 | i=7 ;s=3 | i=8 ;s=11 | |
| 2 | 1.2 | 5.8 | 3.7 | 3.5 | 5.7 | 6.9 | i=1 | i=8 ;s=4 | i=7 ;s=12 | ||
N o t e : 1) Including worms and insect
2) i : intestine, s : stomach
A). With paddle wheel aeration
B). Without paddle wheel aeration
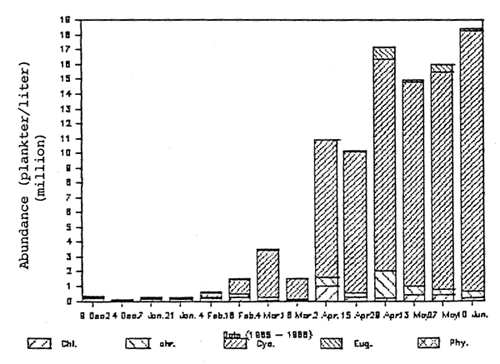
Fig. 1. The average composition of phytoplankton abundance in the ponds with paddle wheel aeration (A) and without paddle wheel aeration (B).
A. Without paddle wheel aeration
B. With paddle wheel aeration
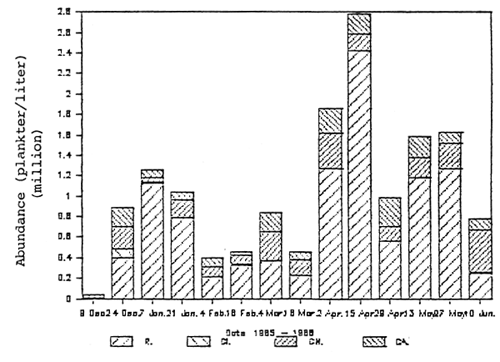
Fig. 2. The average composition of zooplankton abundance in ponds with paddle wheel aeration (B) and without paddle wheel aeration (A).
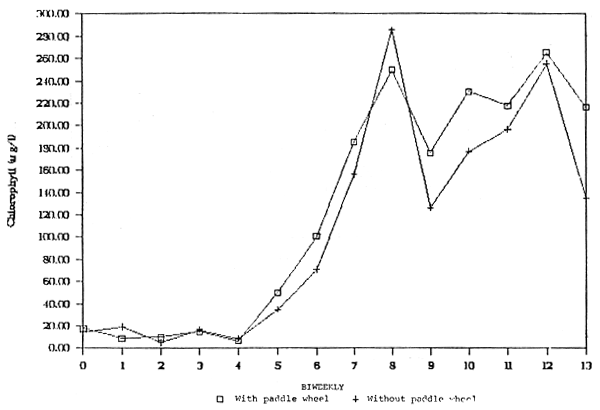
Fig.3. Biweekly experimental measurements of Chloiophyll a average concentration in pond with and without paddlewheel aeration.
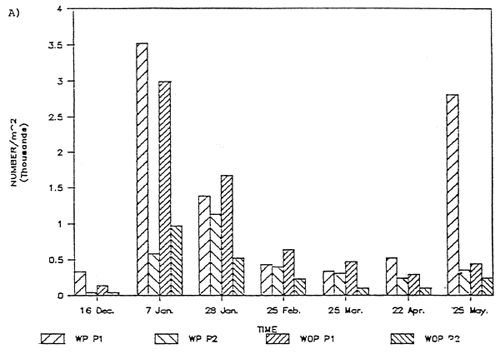
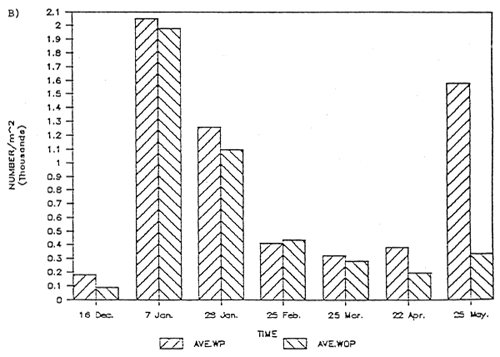
Fig 4. Benthos abundance in bottom pond (A : each pond; B : average) with paddle wheel aeration (WP) and without paddle wheel aeration (WOP).
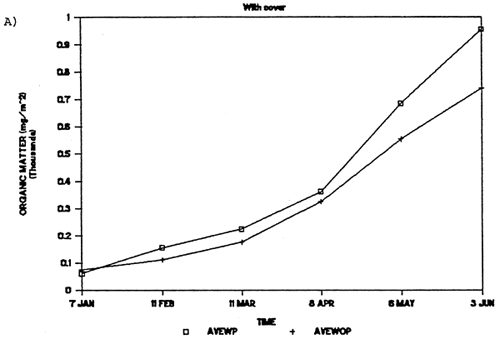
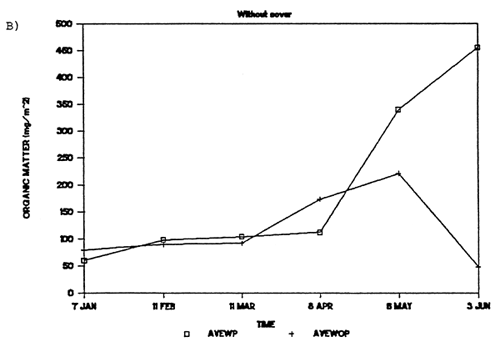
Fig 5. The average organic matter (mg/m2) in pond (A : with covering equipment; B : without covering equipment) with paddle wheel aeration (WP) and without paddle wheel aeration (WOP).