I am grateful to NACA for providing the opportunity and funding for this study.
I express my sincere gratitude to Dr. Mali Boonyaratpalin, Dr. C. Kwei Lin and Dr. Y.C. Shang for their advice, kindness, helpful guidance and suggestions throughout this experiment.
My sincere thanks are due to Ms. Wipa Chaiwisitkul, Mr. Wech Thongnak, Mr. Pisanu Thongnak who helped me during the field work, and Mr. Warawuch Jakngoen who assisted me for the lab. work. Adknowledgement is also extended to Mr. Nopadol Chotisasitorn, who helped in data processing and Ms. Chujit Thongprapai who typed the report.
Finally, I greatly appreciate my colleague, Ms. S.C. Jayamanne and Mr. Ceno Harimurti for their kind cooperation during our activities and for providing the water quality and biological data.
Table 1. Composition of feed used at the farm.
| Ingredients | Percentage (%) |
| Broken rice | 17 |
| Rice bran | 7 |
| Soy bean | 12 |
| Fresh fish | 50 |
| Fish meal | 7 |
| Shrimp meal | 5 |
| CaPO4 | 1 |
| Vitamin | 1 |
Table 2. Production and survival rate of fish and prawn in polyculture system with low and high density of prawn during 7 month grow out period (Dec.'85 – July'86).
| Pond No. | Pond Area (sg.m) | species | Stocking rate (Ind/ha) | Initial weight (g) | Total weight of stocking (kg) | Prawn Restocking | Production Daily weight gained | Survival
Rate (M | ||||
| 1st number | (2 Mar 86) weight(kg) | 2nd number | (28 May 86) weight(kg) | (kg/ha) | (kg/ha/day) | |||||||
| P11 | 2,744 | C.C | 792 | 1.0 | 0.23 | 007 | 1.93 | 96 | ||||
| P11 | 2,744 | G.G | 1,760 | 6.0 | 3.00 | 135 | 2.12 | 80 | ||||
| P11 | 2,744 | B.C | 1,232 | 1.4 | 1.54 | 270 | 1.55 | 70 | ||||
| P11 | 2,744 | S.C | 4,400 | 2.0 | 2.50 | 903 | 6.02 | 92 | ||||
| P11 | 2,744 | P | 21,067 | 3.5 | 20.95 | 825 | 5.96 | 666 | 1 | 565 | 2.69 | 52 |
| P12 | 2,944 | C.C | 792 | 1.0 | 0.23 | 010 | 1.67 | 88 | ||||
| P12 | 2,944 | G.G | 1,760 | 6.0 | 3.00 | 348 | 1.93 | 71 | ||||
| P12 | 2,944 | B.C | 1,232 | 4.4 | 1.54 | 239 | 1.33 | 91 | ||||
| P12 | 2,944 | S.C | 4,400 | 2.0 | 2.50 | 660.00 | 3.67 | 65 | ||||
| P12 | 2,944 | P | 21,092 | 3.6 | 21.99 | 325 | 2.35 | 1,944 | 11.20 | 877.70 | 4.18 | 95 |
| P21 | 2,744 | C.C | 792 | 1.0 | 0.23 | 858.40 | 4.77 | 90 | ||||
| P21 | 2,744 | G.G | 1,760 | 6.0 | 3.00 | 306.60 | 1.70 | 80 | ||||
| P21 | 2,744 | B.C | 1,232 | 4.4 | 1.54 | 321.60 | 1.79 | 87 | ||||
| P21 | 2,744 | S.C | 4,400 | 2.0 | 2.50 | 993.30 | 6.52 | 85 | ||||
| P21 | 2,744 | P | 52,782 | 4.7 | 70.63 | 1,419 | 10.25 | 2,440 | 14.00 | 830.90 | 3.99 | 19 |
| P22 | 2,744 | C.C | 792 | 1.0 | 0.23 | 731.90 | 4.00 | 93 | ||||
| P22 | 2,744 | G.G | 1,760 | 6.0 | 3.00 | 252.70 | 1.40 | 66 | ||||
| P22 | 2,744 | B.C | 1,232 | 4.4 | 1.54 | 210.00 | 1.17 | 98 | ||||
| P22 | 2,744 | S.C | 4,400 | 2.0 | 2.50 | 575.60 | 3.20 | 71 | ||||
| P22 | 2,744 | P | 52,803 | 4.7 | 70.50 | 1,210 | 8.71 | 2,703 | 15.50 | 900.00 | 1.67 | 61 |
Table 3. Mean weight and weight increament (g) of each species of fish in low densit (L.D) and high density (H.D) of prawn during grow out period (mid January-mid July 1986).
| Treatment | Species | Replicate | Initial
Weight 13-Jan-86 | 1st Sampling 04-Feb-86 | dif. W1 | 2nd Sampling 14-Mar-86 | dif. W2 | 3rd Sampling 13-May-86 | dif. W3 | 4th Sampling 15-July-86 | dif. W4 |
| Low Density of Prown (2 Prown/sq.m) | Common Carp (C.C) | P11 | 1.00 | 26.67 | 25.67 | 162.79 | 136.12 | 652.50 | 489.71 | 1162.29 | 509.79 |
| P12 | 1.00 | 20.00 | 19.00 | 184.77 | 164.77 | 673.80 | 489.03 | 1011.14 | 337.34 | ||
| Ave. | 23.34 | 22.34 | 173.78 | 150.45 | 663.15 | 489.37 | 1086.72 | 423.57 | |||
| Giant gouramy (G.G) | P11 | 6.00 | 18.75 | 12.75 | 41.82 | 23.07 | 149.15 | 107.33 | 260.60 | 111.45 | |
| P12 | 6.00 | 16.67 | 10.67 | 34.04 | 17.37 | 100.36 | 66.32 | 256.00 | 155.64 | ||
| Ave. | 17.71 | 11.71 | 37.93 | 20.22 | 124.76 | 86.83 | 258.30 | 133.55 | |||
| Big Head (B.C) | P11 | 4.40 | 45.56 | 41.16 | 106.88 | 61.32 | 221.45 | 114.57 | 286.17 | 64.72 | |
| P12 | 4.40 | 52.50 | 48.10 | 136.88 | 84.38 | 190.20 | 53.32 | 233.14 | 42.94 | ||
| Ave. | 49.03 | 44.63 | 121.88 | 72.85 | 205.83 | 83.95 | 259.66 | 53.83 | |||
| Silver carp (S.C) | P11 | 2.00 | 24.44 | 22.44 | 97.29 | 72.85 | 210.43 | 113.14 | 210.70 | 0.27 | |
| P12 | 2.00 | 26.67 | 24.67 | 94.53 | 67.86 | 160.70 | 66.17 | 175.31 | 14.61 | ||
| Ave. | 25.56 | 23.56 | 95.91 | 70.36 | 185.57 | 89.66 | 193.01 | 7.44 | |||
| High Density of Prown (5 Prown/sq.m) | Common Carp (C.C) | P21 | 1.00 | 17.33 | 16.33 | 138.20 | 120.87 | 697.50 | 559.30 | 1202.33 | 504.83 |
| P22 | 1.00 | 10.00 | 9.00 | 89.80 | 79.80 | 530.77 | 440.97 | 995.33 | 464.56 | ||
| Ave. | 13.67 | 12.67 | 114.00 | 100.34 | 614.14 | 500.14 | 1098.83 | 484.70 | |||
| Giant gouramy (G.G) | P21 | 6.00 | 13.64 | 7.64 | 28.36 | 14.72 | 112.69 | 84.33 | 214.87 | 102.18 | |
| P22 | 6.00 | 12.50 | 6.50 | 23.14 | 10.64 | 85.33 | 62.19 | 235.48 | 150.15 | ||
| Ave. | 13.07 | 7.07 | 25.75 | 12.68 | 99.01 | 73.26 | 225.18 | 126.17 | |||
| Big Head (B.C) | P21 | 4.40 | 42.86 | 38.46 | 100.69 | 57.83 | 227.93 | 127.24 | 276.67 | 48.74 | |
| P22 | 4.40 | 51.11 | 46.71 | 124.17 | 73.06 | 180.67 | 56.50 | 207.10 | 26.43 | ||
| Ave. | 46.99 | 42.59 | 112.43 | 65.45 | 204.30 | 91.87 | 241.89 | 37.59 | |||
| Silver carp (S.C) | P21 | 2.00 | 25.35 | 23.35 | 112.65 | 87.30 | 232.30 | 119.65 | 257.33 | 25.03 | |
| P22 | 2.00 | 26.67 | 24.67 | 110.77 | 84.10 | 172.84 | 62.07 | 183.78 | 10.94 | ||
| Ave. | 26.01 | 24.01 | 111.71 | 85.70 | 202.57 | 90.86 | 220.56 | 17.99 |
Table 4. Mean length and length increament (cm) of each species of fish in low density (L.D) and high density (H.D) of prawn during grow out period (mid January - mid July 1986).
| Treatment | Species | Replicate | Initial Length (cm) 13-Jan-86 | 1st Sampling 04-Feb-86 | dif. L1 | 2nd Sampling 14-Mar-86 | dif. L2 | 3rd Sampling 13-May-86 | dif. L3 | 4th Sampling 15-July-86 | dif. L4 |
| Low Density of Prown Prown/sq.m) | Common Carp (C.C) | P11 | 3–5 | 11.30 | 7.30 | 20.29 | 8.99 | 31.41 | 11.12 | 36.49 | 5.08 |
| P12 | 10.45 | 6.45 | 20.25 | 9.80 | 30.89 | 10.64 | 35.99 | 5.10 | |||
| Ave. | 10.88 | 6.88 | 20.27 | 9.40 | 31.15 | 10.88 | 36.24 | 5.09 | |||
| Giant gouramy (G.G) | P11 | 6.4 – 7.7 | 9.65 | 2.60 | 12.92 | 3.27 | 19.42 | 6.50 | 23.94 | 4.52 | |
| P12 | 9.13 | 2.08 | 11.72 | 2.59 | 16.23 | 4.51 | 22.99 | 6.76 | |||
| Ave. | 9.39 | 2.34 | 12.32 | 2.93 | 17.83 | 5.51 | 23.47 | 5.64 | |||
| Big Head (B.C) | P11 | 6.5 – 9.5 | 15.71 | 7.71 | 21.05 | 5.34 | 27.38 | 6.33 | 29.87 | 2.49 | |
| P12 | 16.22 | 8.22 | 22.61 | 6.39 | 25.77 | 3.16 | 28.22 | 2.45 | |||
| Ave. | 15.97 | 7.97 | 21.83 | 5.87 | 26.58 | 4.75 | 29.05 | 2.47 | |||
| Silver carp (S.C) | P11 | 6.0 – 10.8 | 13.08 | 4.68 | 21.72 | 8.64 | 27.74 | 6.02 | 28.35 | 0.61 | |
| P12 | 13.65 | 5.25 | 21.37 | 7.72 | 25.42 | 4.05 | 26.06 | 0.64 | |||
| Ave. | 13.37 | 4.97 | 21.55 | 8.18 | 26.58 | 5.04 | 27.21 | 0.63 | |||
| High Density of Prawn Prawn/sq.m) | Common Carp (C.C) | P21 | 3 – 5 | 10.42 | 6.42 | 17.87 | 7.45 | 31.52 | 13.65 | 36.49 | 4.97 |
| P22 | 8.43 | 4.43 | 16.49 | 8.06 | 29.54 | 13.05 | 34.82 | 5.28 | |||
| Ave. | 9.43 | 5.43 | 17.18 | 7.76 | 30.53 | 13.35 | 35.66 | 5.13 | |||
| Giant gouramy (G.G) | P21 | 6.4 – 7.7 | 8.88 | 1.83 | 11.22 | 2.34 | 17.60 | 6.38 | 22.15 | 4.55 | |
| P22 | 7.71 | 0.66 | 10.64 | 2.93 | 15.57 | 4.93 | 22.15 | 6.58 | |||
| Ave. | 8.30 | 1.25 | 10.93 | 2.64 | 16.59 | 5.66 | 22.15 | 5.57 | |||
| Big Head (B.C) | P21 | 6.5 – 9.5 | 16.22 | 8.22 | 20.98 | 4.76 | 27.34 | 6.36 | 30.06 | 2.72 | |
| P22 | 15.90 | 7.90 | 22.20 | 6.30 | 25.28 | 3.08 | 25.95 | 0.67 | |||
| Ave. | 16.06 | 8.06 | 21.59 | 5.53 | 26.31 | 4.72 | 28.01 | 1.70 | |||
| Silver carp (S.C) | P21 | 6.0 – 10.8 | 13.09 | 5.50 | 22.11 | 9.02 | 29.31 | 7.20 | 29.60 | 0.29 | |
| P22 | 14.33 | 5.93 | 22.16 | 7.83 | 26.18 | 4.02 | 26.39 | 0.21 | |||
| Ave. | 13.71 | 5.72 | 22.14 | 8.43 | 27.75 | 5.61 | 28.00 | 0.25 |
Table 5. Percentage weight gained (% per day) of each species of fish in low density (L.D) and high density (H.D) of prawn during grow out pond (mid January -mid July 1986).
| Treatment | Species | Replicate | 1st sampling % day | 2nd sampling % day | 3rd sampling % day | 4th sampling % day |
| Low Den. | C.C | P11 | 111.6 | 349.0 | 802.8 | 796.5 |
| P12 | 82.6 | 422.5 | 801.7 | 527.7 | ||
| Ave. | 97.1 | 385.8 | 802.2 | 661.8 | ||
| G.G | P11 | 55.4 | 59.2 | 175.9 | 174.1 | |
| P12 | 46.4 | 44.5 | 108.7 | 243.2 | ||
| Ave. | 50.9 | 51.8 | 142.3 | 211.8 | ||
| B.C | P11 | 179.0 | 157.2 | 187.8 | 101.1 | |
| P12 | 209.1 | 216.4 | 87.4 | 67.1 | ||
| Ave. | 194.0 | 186.8 | 137.6 | 84.1 | ||
| S.C | P11 | 97.6 | 186.8 | 185.5 | 0.4 | |
| P12 | 107.3 | 174.0 | 108.5 | 22 | ||
| Ave. | 102.4 | 180.4 | 147.0 | 11.6 | ||
| High Den. | C.C | P21 | 71.0 | 309.9 | 916.9 | 788.8 |
| P22 | 39.1 | 204.6 | 722.9 | 725.9 | ||
| Ave. | 55.1 | 257.3 | 819.9 | 757.3 | ||
| G.G | P21 | 33.2 | 37.7 | 138.2 | 159.7 | |
| P22 | 28.3 | 27.3 | 100.3 | 234.6 | ||
| Ave. | 30.7 | 32.5 | 120.1 | 197.1 | ||
| B.C | P21 | 167.2 | 148.3 | 208.6 | 76.2 | |
| P22 | 203.1 | 187.3 | 92.6 | 41.3 | ||
| Ave. | 185.2 | 167.8 | 150.6 | 58.7 | ||
| B.C | P21 | 101.5 | 233.8 | 196.1 | 39.1 | |
| P22 | 107.3 | 215.6 | 101.8 | 17.1 | ||
| Ave. | 104.4 | 219.7 | 148.9 | 28.1 |
Table 6, Feed Consumption (kg) by Fish and Prawn and FCR of Fish in Polyculture Ponds (Dec, 1985 - July, 1986).
| Pond No. | Dec. (11 days) | Jan. (23 days) | Feb. (24 days) | Mar. (26 days) | Apr. (25 days) | May (27 days) | Jun. (24 days) | Jul. (13 days) | TOTAL (173 days) | FCR | |||||||||||||||||||||||||||
| P | F | R | C | P | F | R | C | P | F | R | C | P | F | R | C | P | F | R | C | P | F | R | C | P | F | R | C | P | F | R | C | P | F | R | C | ||
| P11 | 39 | 6 | 74.3 | 11 | 97.5 | 19.5 | 139.5 | 45 | 10.5 | 204.5 | 25 | 4 | 192 | 11 | 17 | 168 | 7 | 85 | 1000 | 117.5 | 34.5 | 4 | 0.92 | ||||||||||||||
| P12 | 39 | 74.3 | 11 | 97.5 | 19.5 | 139.5 | 45 | 11.5 | 204.5 | 20 | 4 | 200.5 | 11 | 17 | 168 | 7 | 111 | 1034 | 112.5 | 35.5 | 4 | 0.78 | |||||||||||||||
| Daily feeding rate (kg/day) | 3.5 | 3.2 | 4.1 | 5.4 | 8.2 | 7.3 | 7 | ||||||||||||||||||||||||||||||
| P21 | 24 | 5 | 98.3 | 13 | 121.5 | 20.5 | 164.5 | 45 | 11.5 | 237.5 | 25 | 4 | 244.5 | 15 | 23 | 240 | 10 | 115 | 1245.5 | 123.5 | 44.5 | 4 | 1.05 | ||||||||||||||
| P22 | 24 | 5 | 98.3 | 13 | 121.5 | 20.5 | 164.5 | 45 | 12.5 | 237.5 | 20 | 4 | 252.5 | 15 | 23 | 240 | 10 | 115 | 1253 | 118.5 | 45.5 | 4 | 1.20 | ||||||||||||||
| Daily feeding rate (kg/day) | 2.2 | 4.3 | 5.1 | 6.3 | 9.5 | 9.2 | 10 | ||||||||||||||||||||||||||||||
NOTE :
P = Pellet;
F = Chopped Fish (25% dry matter);
R = Broken rice;
C = Corn
Table 7. Prawn yield (kg per pond), average weight (g) in each category and percentage in weight of female and male prawn at each partial harvest during grow out period (mid Dec. 1985 - mid July 1986).
| Pond No. | Type | 1st Partial Harvest (14 Mar 86) | 2nd Partial Harvest (13 May 86) | 3rd Partial Harvest (14 July 86) | Total Yield | ||||||||||||
| Yield (kg/pond) | Ave.Weight (g/prawn) | %in Weight | Sex Ratio(%) in weight | Yield (kg/pond) | Ave.Weight (g/prawn) | %in Weight | Sex Ratio(%) in weight | Yield (kg/pond) | Ave.Weight (g/prawn) | %in Weight | Sex Ratio(%) in weight | Yield (kg/pond) | Ave.Weight (g/prawn) | %in Weight | Sex Ratio(%) in weight | ||
| P11 | F+E | 24.4 | 58.8 | 25.4 | F=51.8 | 8.95 | 46.9 | 21.1 | F=49.9 | 6.7 | 37.5 | 13.6 | F=37.8 | 48.1 | 51 | 21.4 | F=46.5 |
| P11 | F-E | 22.6 | 34.5 | 23.5 | M=48.2 | 18.3 | 46.1 | 24.3 | M=58.1 | 5.9 | 34.5 | 12 | M=62.2 | 38.8 | 37 | 20.7 | M=51.5 |
| P11 | M#1 | 18.8 | 111.1 | 19.6 | 6.8 | 119.1 | 16.1 | 5.6 | 70.8 | 11.4 | 31.2 | 102.2 | 16.6 | ||||
| P11 | M#2 | 11.5 | 71.4 | 12 | 3.4 | 75.1 | 8 | 6.4 | 66.7 | 13 | 21.3 | 70.5 | 11.4 | ||||
| P11 | M#3 | 1.6 | 52.6 | 1.7 | 2.3 | 53.6 | 5.4 | 2.7 | 46.6 | 5.5 | 6.6 | 50.3 | 3.5 | ||||
| P11 | L.C | 11.8 | 100 | 12.3 | 6.8 | 139.9 | 16.1 | 6 | 98.5 | 12.2 | 21.6 | 108.1 | 13.1 | ||||
| P11 | S.S | 5.3 | 52.6 | 5.5 | 3.8 | 65.4 | 9 | 1.3 | 46.4 | 2.6 | 10.4 | 55.7 | 5.5 | ||||
| P11 | W.M | 14.6 | 15.8 | 29.7 | 14.6 | 15.8 | 7.8 | ||||||||||
| P11 | Total | 96 | 42.4 | 49.2 | 187.6 | ||||||||||||
| P12 | F+E | 7.6 | 38.5 | 21.5 | F=38.3 | 23.9 | 37.8 | 24.2 | F=53.3 | 28.6 | 35 | 18 | F=44.4 | 60.1 | 36.5 | 20.5 | F=48.6 |
| P12 | F-E | 5.5 | 34.5 | 15.5 | M=61.7 | 25.5 | 36 | 25.7 | M=46.7 | 19.9 | 34.2 | 12.5 | M=55.6 | 50.9 | 35.1 | 17.3 | M=51.4 |
| P12 | M#1 | 7.6 | 83.3 | 21.5 | 16.1 | 94.7 | 16.6 | 15 | 83.8 | 9.4 | 38.7 | 87.9 | 13.1 | ||||
| P12 | M#2 | 2.9 | 62.5 | 8.2 | 10.55 | 58.6 | 10.7 | 14.6 | 62.3 | 9.2 | 28.1 | 60.9 | 9.6 | ||||
| P12 | M#3 | 2 | 40.5 | 5.6 | 1.4 | 48.3 | 1.4 | 7.2 | 47 | 4.5 | 10.6 | 47.4 | 3.6 | ||||
| P12 | L.C | 8.6 | 90.9 | 24.3 | 15.2 | 117.4 | 15.4 | 16.3 | 82.7 | 10.2 | 40.1 | 95.2 | 13.7 | ||||
| P12 | S.S | 1.2 | 62.5 | 3.4 | 6.3 | 66.7 | 6.4 | 7.4 | 43 | 4.6 | 14.9 | 52.1 | 5.1 | ||||
| P12 | W.M | 50.3 | 17.2 | 31.6 | 50.3 | 17.2 | 17.1 | ||||||||||
| P12 | Total | 35.4 | 99 | 159.3 | 293.7 | ||||||||||||
| P21 | F+E | 24.8 | 30.3 | 21.5 | F=38.3 | 18.2 | 32.7 | 18.1 | F=54 | 18.1 | 34.5 | 15.1 | F=56.2 | 61.1 | 32.2 | 18.6 | F=53.2 |
| P21 | F-E | 25.6 | 27 | 15.5 | M=61.7 | 32 | 28.8 | 31.9 | M=46 | 22 | 33 | 18.3 | M=43.8 | 79.6 | 29.2 | 24.3 | M=46.8 |
| P21 | M#1 | 6.3 | 83.3 | 21.5 | 11 | 83.3 | 10.9 | 6.4 | 89.9 | 5.3 | 23.7 | 85 | 7.2 | ||||
| P21 | M#2 | 17.5 | 62.5 | 8.2 | 13 | 68.8 | 13 | 13 | 77.9 | 10.8 | 43.5 | 68.4 | 13.3 | ||||
| P21 | M#3 | 14.8 | 47.6 | 5.6 | 8.7 | 43.3 | 8.7 | 8.5 | 43.3 | 7.1 | 32 | 45.2 | 9.8 | ||||
| P21 | L.C | 8.5 | 66.7 | 24.3 | 10 | 94.4 | 10 | 6.1 | 101.3 | 5.1 | 24.6 | 83.8 | 7.5 | ||||
| P21 | S.S | 9.9 | 35.7 | 3.4 | 7.4 | 52.1 | 7.4 | 8.1 | 53 | 6.7 | 25.4 | 44.5 | 7.7 | ||||
| P21 | W.M | 38 | 17.7 | 31.6 | 38 | 17.7 | 11.6 | ||||||||||
| P21 | Total | 187.4 | 100.3 | 128.2 | 327.9 | ||||||||||||
| P22 | F+E | 26.2 | 31.3 | 27 | F=50.9 | 21.5 | 32.7 | 17.8 | F=51.7 | 34.5 | 30.7 | 28.8 | F=54.9 | 82.2 | 31.4 | 21.5 | F=53.7 |
| P22 | F-E | 28 | 26.3 | 20.7 | M=49.1 | 35.8 | 30.8 | 29.6 | M=48.3 | 27.9 | 30.3 | 16.9 | M=45.1 | 83.7 | 29.5 | 21.8 | M=46.3 |
| P22 | M#1 | 6.8 | 76.9 | 7 | 18.7 | 87.1 | 15.5 | 6.4 | 85.8 | 3.9 | 31.9 | 84.5 | 8.3 | ||||
| P22 | M#2 | 16.8 | 62.5 | 17.3 | 17 | 66.7 | 14 | 9.9 | 66.4 | 6 | 43.7 | 64.9 | 11.4 | ||||
| P22 | M#3 | 9.8 | 47.6 | 10.1 | 4.4 | 50 | 3.6 | 12.9 | 43.4 | 7.8 | 27.1 | 45.8 | 7.1 | ||||
| P22 | L.C | 11.2 | 90.9 | 11.6 | 13.5 | 100 | 11.2 | 15.5 | 86.3 | 9.4 | 40.2 | 91.8 | 10.5 | ||||
| P22 | S.S | 6.1 | 45.5 | 6.3 | 10.1 | 53.2 | 8.3 | 9.2 | 58.6 | 5.6 | 25.4 | 58.2 | 6.6 | ||||
| P22 | W.M | 49 | 14 | 29.6 | 49 | 14 | 12.8 | ||||||||||
| P22 | Total | 96.9 | 121 | 165.3 | 383.2 | ||||||||||||
Table 8. Prawn number of each category and percentage in number of female and male prawn at each partial harvest during grow out period (mid Dec. 1985 - mid July 1986).
| Pond No. Pond No. | Type Type | 1st Partial Harvest (14 Mar 86) | 2nd Partial Harvest (13 May 86) | 3rd Partial Harvest (15 July 86) | Total Harvest | ||||||||
| Number of prawn | % in number | Sex Ratio(%) in number | Number of prawn | % in number | Sex Ratio(%) in number | Number of prawn | % in number | Sex Ratio(%) in number | Number of prawn | % in number | Sex Ratio(%) in number | ||
| P11 | F+E | 414.8 | 25.4 | f=69.1 | 190.9 | 28.6 | f=68.1 | 178.9 | 11.2 | f=54.3 | 784.6 | 20.1 | f=65.5 |
| P11 | F-E | 655.4 | 39.7 | m=30.9 | 223.5 | 33.6 | m=31.9 | 170.9 | 10.7 | m=45.7 | 1049.8 | 26.8 | m=34.5 |
| P11 | M#1 | 169.2 | 10.2 | 57.1 | 8.6 | 79.1 | 5 | 305.4 | 7.8 | ||||
| P11 | M#2 | 161 | 9.7 | 45.3 | 6.8 | 96 | 6 | 302.3 | 7.7 | ||||
| P11 | M#3 | 30.4 | 1.8 | 42.9 | 6.4 | 58 | 3.6 | 131.3 | 3.4 | ||||
| P11 | L.C | 118 | 7.1 | 48.6 | 7.3 | 60.9 | 3.8 | 227.5 | 5.8 | ||||
| P11 | S.S | 100.7 | 6.1 | 58.1 | 8.7 | 28 | 1.8 | 186.8 | 4.8 | ||||
| P11 | W.M | 923.5 | 57.9 | 923.5 | 23.6 | ||||||||
| P11 | Total | 1649.5 | 666.4 | 1595.3 | 3911.2 | 100 | |||||||
| P12 | F+E | 197.6 | 30.4 | f=56.6 | 632.6 | 32.5 | f=72.5 | 817 | 15.5 | f=68.3 | 1647.2 | 21 | f=66.7 |
| P12 | F-E | 159.5 | 24.5 | m=43.4 | 708.1 | 36.4 | m=27.5 | 582.3 | 11.1 | m=31.7 | 1449.9 | 18.5 | m=33.3 |
| P12 | M#1 | 91.2 | 14 | 170 | 8.7 | 178.9 | 3.4 | 448.1 | 5.6 | ||||
| P12 | M#2 | 46.4 | 7.2 | 180 | 9.3 | 234.3 | 4.5 | 460.7 | 5.9 | ||||
| P12 | M#3 | 41.2 | 6.3 | 29 | 1.5 | 153.3 | 2.9 | 233.5 | 2.8 | ||||
| P12 | L.C | 94.6 | 14.6 | 129.5 | 6.7 | 197.2 | 3.8 | 421.3 | 5.4 | ||||
| P12 | S.S | 19.2 | 3 | 94.5 | 4.9 | 172.2 | 3.3 | 285.9 | 3.6 | ||||
| P12 | W.M | 2917.5 | 55.5 | 2917.5 | 37.2 | ||||||||
| P12 | Total | 649.7 | 1943.7 | 5252.7 | 7846.1 | 100 | |||||||
| P21 | F+E | 818.4 | 28.8 | f=69 | 557.3 | 22.8 | f=72.7 | 524 | 13.1 | f=73.6 | 1899.7 | 20.5 | f=70.7 |
| P21 | F-E | 947.2 | 33.4 | m=31 | 1113 | 45.6 | m=27.3 | 664.9 | 16.7 | m=26.4 | 2725.1 | 29.4 | m=29.3 |
| P21 | M#1 | 75.6 | 2.7 | 132 | 5.4 | 71.2 | 1.8 | 278.8 | 3 | ||||
| P21 | M#2 | 280 | 9.9 | 189 | 7.7 | 166.9 | 4.2 | 635.9 | 6.9 | ||||
| P21 | M#3 | 310.8 | 10.9 | 200.8 | 8.3 | 196.1 | 4.9 | 707.7 | 7.6 | ||||
| P21 | L.C | 127.5 | 4.5 | 105.9 | 4.4 | 60.2 | 1.5 | 293.6 | 3.2 | ||||
| P21 | S.S | 277.2 | 9.8 | 141.9 | 5.8 | 182 | 3.8 | 571.1 | 6.2 | ||||
| P21 | W.M | 2149.5 | 54 | 2149.5 | 23.2 | ||||||||
| P21 | Total | 2836.7 | 2439.9 | 3984.8 | 9261.4 | 100 | |||||||
| P22 | F+E | 838.4 | 34.7 | f=70 | 657 | 24.3 | f=72.4 | 1123.3 | 20.8 | f=71.8 | 2618.7 | 22.6 | f=72.4 |
| P22 | F-E | 760 | 31.4 | m=30 | 1163.5 | 43.1 | m=27.6 | 918.1 | 16.9 | m=28.2 | 2841.6 | 24.6 | m=27.6 |
| P22 | M#1 | 88.4 | 3.7 | 214.7 | 7.9 | 74.6 | 3.9 | 377.7 | 3.3 | ||||
| P22 | M#2 | 268.8 | 11.1 | 255 | 9.4 | 149.1 | 6 | 672.9 | 5.8 | ||||
| P22 | M#3 | 205.8 | 8.5 | 88 | 3.3 | 297.3 | 7.8 | 591.1 | 5.1 | ||||
| P22 | L.C | 123.2 | 5.1 | 135 | 5 | 179.7 | 9.4 | 437.9 | 3.8 | ||||
| P22 | S.S | 134.2 | 5.5 | 189.9 | 7 | 181.8 | 5.6 | 505.9 | 4.4 | ||||
| P22 | W.M | 3511.8 | 29.6 | 3511.8 | 30.4 | ||||||||
| P22 | Total | 2418.8 | 2703.1 | 6435.7 | 1155.6 | 188 | |||||||
Table 9 The proportion both in number and weight between marketable and unmarketable size of prawns harvested from polyculture pond
| Type | P11 | P12 | Mean | P21 | P22 | Mean | ||||||
| No. | % | No. | % | Ave. | % | No. | % | No. | % | Ave. | % | |
| Marketable | 2,988 | 76.4 | 4,929 | 62.8 | 3,958.5 | 69.6 | 7,112 | 76.8 | 8,046 | 69.9 | 7,579 | 73.2 |
| Unmarketable (U.M) | 923 | 23.6 | 2,917 | 37.2 | 1,920.0 | 30.4 | 2,149 | 23.2 | 3,512 | 30.4 | 2,831 | 26.8 |
| Total Prawn | 3,911 | 100 | 7,846 | 100 | 5,878.5 | 100 | 9,261 | 100 | 11,558 | 100 | 10,410 | 100 |
| Weight(kg) | % | Weight(kg) | % | Ave. | % | Weight(kg) | % | Weight(kg) | % | Ave. | % | |
| Marketable | 173.0 | 92.2 | 243.4 | 82.9 | 200.2 | 87.6 | 289.9 | 88.4 | 334.2 | 87.2 | 312.1 | 87.8 |
| Unmarketable (U.M) | 14.6 | 7.8 | 50.3 | 17.1 | 32.5 | 12.4 | 38.0 | 11.6 | 49.0 | 12.0 | 43.5 | 12.2 |
| Total Prawn | 187.6 | 100 | 293.7 | 100 | 240.7 | 100 | 327.9 | 100 | 383.2 | 100 | 355.6 | 100 |
Table 10 Accomulated biomass yield (number and weight), survival rate and weight gain of prawns in polyculture ponds during 7 month growout period
| Pond | Total count | Total weight (kg) | Survival Weight gained | ||||
| Stocking | Harvest | Stocking | Harvest | (%) | Total | Mean | |
| P11 | 7,476.00 | 3,911.20 | 30.71 | 187.55 | 52.30 | 156.80 | 48.00 |
| P12 | 8,261.00 | 7,846.10 | 35.54 | 293.65 | 95.00 | 258.10 | 37.40 |
| P21 | 18,854.00 | 9,261.40 | 94.88 | 327.90 | 49.10 | 233.00 | 35.40 |
| P22 | 18,914.00 | 11,557.60 | 94.74 | 383.20 | 61.10 | 288.50 | 33.20 |
Table 11 : Variation in market price (baht per kg)a) for different prawn categories during culturing period.
| Type | 15 March 1986 | 14 May 1986 | 16 July 1986 |
| Female + Egg | 72 | 72 | 75 |
| Female - Egg | 78.5 | 77 | 80 |
| Male no. 1 | 130 | 130 | 150 |
| Male no. 2 | 110 | 110 | 130 |
| Male no. 3 | 95 | 95 | 110 |
| Long claws | 90 | 100 | 90 |
| Soft shells | 86 | 80 | 85 |
| Unmarketable size (U.M) | 85 |
Table 12. Yields (kg) and revenues of prawn at each partial harvest both in low density and in high density of prawn
| Low Density of prawn (L.D) | High Density of prawn (H.D) | |||||||||||
| Partial Harvest | Partial Harvest | |||||||||||
| 1st harvest | 2nd harvest | 3rd harvest | 1st harvest | 2nd harvest | 3rd harvest | |||||||
| Yield | revenues | yield | revenues | yield | revenues | yield | revenues | yield | revenues | yield | revenues | |
| F + E | 32 | 2,304 | 32.9 | 2,369 | 35.3 | 2,648 | 51 | 3,672 | 39.7 | 2,858 | 52.6 | 3,945 |
| F - E | 28.1 | 2,206 | 35.8 | 2,757 | 25.8 | 2,064 | 45.6 | 3,580 | 67.8 | 5,221 | 49.9 | 3,992 |
| M # 1 | 26.4 | 3,432 | 22.9 | 2,977 | 20.6 | 3,090 | 13.1 | 1,703 | 29.7 | 3,861 | 12.8 | 1,920 |
| M # 2 | 14.4 | 1,584 | 14.0 | 1,540 | 21 | 2,730 | 34.3 | 3,773 | 30.0 | 3,300 | 22.9 | 2,977 |
| M # 3 | 3.6 | 342 | 3.7 | 351 | 9.9 | 1,089 | 24.6 | 2,337 | 13.1 | 1,245 | 21.4 | 2,354 |
| L.C | 20.4 | 1,836 | 22 | 2,200 | 22.3 | 2,007 | 19.7 | 1,773 | 23.5 | 2,350 | 21.6 | 1,944 |
| S.S | 6.5 | 559 | 10.1 | 808 | 8.7 | 740 | 16.0 | 1,376 | 17.5 | 1,400 | 17.3 | 1,471 |
| U.M | 64.9 | 5,516 | 87 | 7,395 | ||||||||
| Total | 131.4 | 12,263 | 141.4 | 13,002 | 208.5 | 19,884 | 204.3 | 18,214 | 221.3 | 20.235 | 285.5 | 25,998 |
Table 13 Comparison of total gross revenue of both prawn and fish between in low density and in high density of prawn.
| ITEM | Low Density of Prawn | High Density of Prawn | ||||
| Yield (kg) | Price/kg (฿) | Gross Revenues (฿) | Yield (kg) | Price/kg (฿) | Gross Revenues (฿) | |
| PRAWN : F+E | 100.2 | 72–75 | 7,321 | 143.3 | 72–75 | 10,475 |
| F-E | 89.7 | 77–80 | 7,027 | 163.3 | 77–80 | 12,793 |
| M#1 | 69.9 | 130–150 | 9,499 | 55.6 | 130–150 | 7,484 |
| M#2 | 49.4 | 110–130 | 5,854 | 87.2 | 110–130 | 10,050 |
| M#3 | 17.2 | 95–110 | 1,782 | 59.1 | 95–110 | 5,936 |
| L.C | 64.7 | 90–100 | 6,043 | 64.8 | 90–100 | 6,067 |
| S.S | 25.3 | 80–86 | 2,107 | 50.8 | 80–86 | 4,247 |
| U.M | 64.9 | 85 | 5,516 | 87.0 | 85 | 7,395 |
| 481.3 | 45,149 | 711,1 | 64,447 | |||
| FISH : C.C | 491 | 20 | 9,820 | 453 | 20 | 9,060 |
| G.G | 228.5 | 25 | 5,713 | 165 | 25 | 4,125 |
| B.C | 150 | 10 | 1,500 | 154 | 10 | 1,540 |
| S.C | 449 | 10 | 4,490 | 450 | 10 | 4,500 |
| 1,318.5 | 21,523 | 1,222 | 19,225 | |||
| Total Revenues | 66,672 | Total Revenues | 83,672 | |||
Table 14. Capital cost and depreciation per pond of polyculture of prawn and ; various species of fish
| ITEM | CAPITAL COST (per pond) | YEAR LIFE | FIXED COSTS PER POND (DEPRECIATION) | |
| (per year) | (per 7 months) | |||
| a. Pond construction: | 14,850 | 10 | 1,485 | 866 |
| - dykes construction : | ||||
| - inlet & outlet (concrete pipe) : 1080 ฿/pond (pond size : 50×112 m) | ||||
| b. Land rent : | 2,500 | 1,458 | ||
| - 500 ฿/rai/year (pond area : 3.5 rai, it requires 5 rai of land) | ||||
| c. Water pump & iron pipe: | 1,250 | 6 | 208 | 21 |
| - 25,000 ฿/20 ponds | ||||
| d. Meat grinder + engine + Wooden tray: | 750 | 6 | 125 | 73 |
| - 15,000 ฿/20 ponds | ||||
| e. Storage room + feed drying area: | 1,500 | 20 | 75 | 44 |
| - 30,000 ฿/20 ponds | ||||
| f. Net (Seine) for harvesting: | 400 | 5 | 80 | 47 |
| - 8000 ฿/20 ponds (net size : 80 m × 6 m) | ||||
| g. Bamboo buckets: | 40 | 2 | 20 | 12 |
| - 800 ฿/20 ponds | ||||
| h. Plastic buckets: | 75 | 5 | 15 | 9 |
| - 1500 ฿/20 ponds | ||||
| TOTAL FIXED COSTS | 18,865 | 4,508 | 2,630 | |
Table 15. Comparison of operating cost in polyculture system, between in low density of prawn (L.D) and high density of prawn (H.D) during 7 months growout period. (in baht)a)
| ITEM | L.D cost per proportion of | H.D cost per proportion of | |||
| pondb) | total cost(%) | pondb) | total cost(%) | ||
| 1. | FIXED COSTS (DEPRECIATION): | ||||
| a. | Dykes construction : 1700 ฿/40 m | 866 | 1.9 | 866 | 1.5 |
| pond size: 50×112m) inlet/outlet | |||||
| construction : 1080 ฿/pond | |||||
| b. | Land rent : | ||||
| - 500 ฿/rai/year (pond area : 3.5 rai, it requires 5 rai of land) | 1,458 | 3.2 | 1,458 | 2.4 | |
| c. | Water pump and iron pipe : | 121 | 0.3 | 121 | 0.2 |
| - 25,000 ฿/20 ponds | |||||
| d. | Meat grinder + engine + wooden tray : | 73 | 0.2 | 73 | 0.1 |
| - 15,000 ฿/20 ponds | |||||
| e. | Storage room & feed drying area : | 44 | 0.1 | 44 | 0.07 |
| - 30,000 ฿/20 ponds | |||||
| f. | Seine for harvesting : | 47 | 0.1 | 47 | 0.08 |
| - 8000 ฿/20 ponds ; seine size : 80 m × 6 m | |||||
| g. | Bamboo buckets : | 12 | 0.03 | 12 | 0.02 |
| - 800 ฿/20 ponds | |||||
| h. | Plastic buckets : | 9 | 0.02 | 9 | 0.01 |
| - 1500 ฿/20 ponds | |||||
| i. | Interest : | 1,100 | 2.4 | 1,100 | 1.8 |
| 10% of capital cost/year | |||||
| Total Fixed Cost | 3,730 | 8.3 | 3,730 | 6.2 | |
| 2. | VARIABLE COSTS | ||||
| a. | Feed : | 21,700 | 48.2 | 26,570 | 44.0 |
| - amount of feed in L.D = 2170 kg | |||||
| - amount of feed H.D = 2657 kg | |||||
| - Price : 10 ฿ kg | |||||
| b. | Labor : | 2,600 | 5.8 | 2,600 | 4.3 |
| - 1 permanent labor ; 200 ฿/month/pond | |||||
| - 10 casual labor (for harvesting): 60 ฿/labor/day (4 times harvesting : 1 harvesting/2 ponds/day) | |||||
| c. | Prawn juveniles (3–4 g) : | 5,636 | 12.5 | 16,116 | 26.7 |
| - stocking weight in L.D = 66.3 kg | |||||
| - stocking weight in H.D = 189.6 kg | |||||
| - price = 85 ฿/kg | |||||
| Fish fingerling : | 9,405 | 20.9 | 9,405 | 15.6 | |
| - stocking numbers : CC = 450; GG = 1000; B.C = 700; S.C = 2500 per pond | |||||
| - price of CC; GG; BC; SC = (0.3; 6.0; 1.1; 1.0) ฿ each | |||||
| d. | Manure : | 319 | 0.7 | 319 | 0.5 |
| - Amount : 638 kg chicken manure (Wet state)/pond | |||||
| - price = 0.5 ฿/kg | |||||
| e. | Lime : | 200 | 0.4 | 200 | 0.3 |
| - Amount : 200 kg/pond | |||||
| - price = 1 ฿/kg | |||||
| f. | Fuel : | 1,082 | 2.4 | 1,082 | 1.8 |
| Adding water 10% (seepage) :18 times/7 months (32.5 ฿/times) Pumping in & out the water for harvesting : 3 times/7 months (162.5 ฿/times) | |||||
| g. | Miscellaneous | 350 | 0.8 | 350 | 0.6 |
| Total Variable Costs | 41,292 | 91.7 | 56,642 | 93.8 | |
| Total costs | 45,022 | 100 | 60,372 | 100 | |
Table 16. Comparison of profit, rate of return and cost production between in low density and in high density of prawn (in baht)a)
| Treatment | Profit/pondb) | profit/kg | Production cost per kg | Rate of return on operating cost (%) | Rate of return on initial capital (%) |
| Low density of prawn (L.D) | 21,650 | 12 | 25 | 48 | 115 |
| High density of prawn (H.D) | 23,300 | 12 | 31 | 38 | 123 |
b) Pond area = 3.5 rai (1 ha = 6.25 rai)
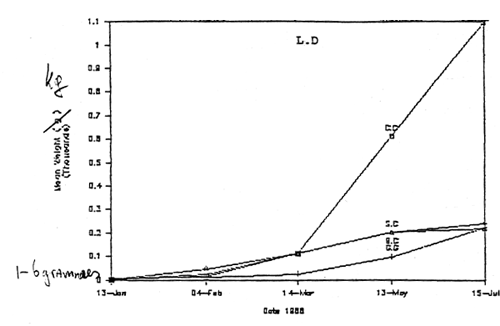
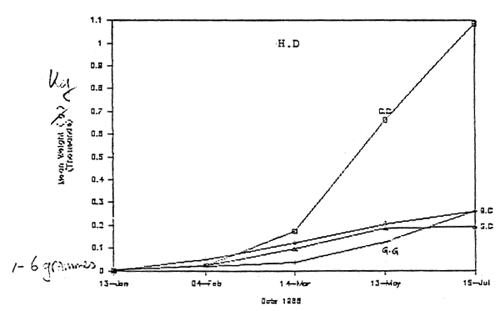
Fig 1. Mean weight of fish (kg) of each species in low L.D and
high density (H.D) of prawn during grow out period
(January - July 1986).
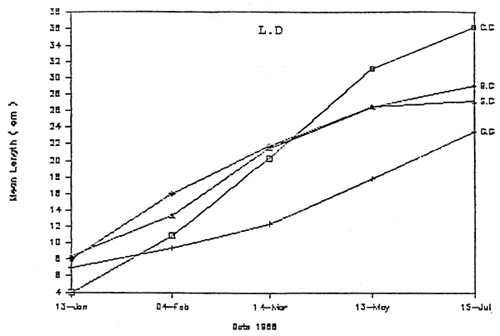
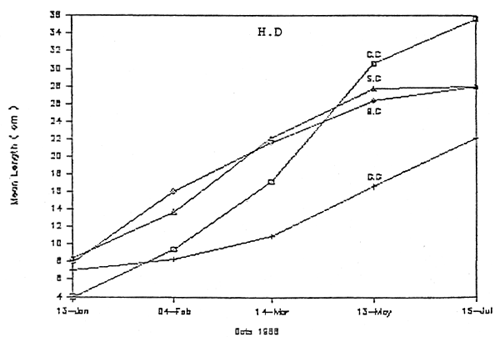
Fig 2. Mean length (cm) of fish of each species in L.D and H.D during grow out period (January - July 1986).
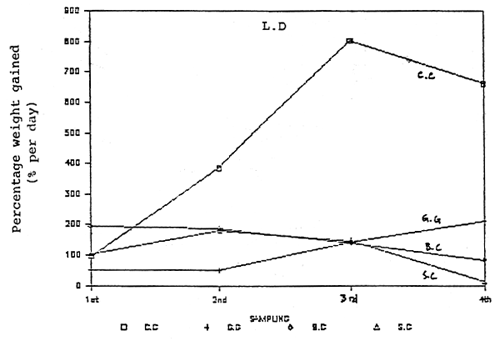
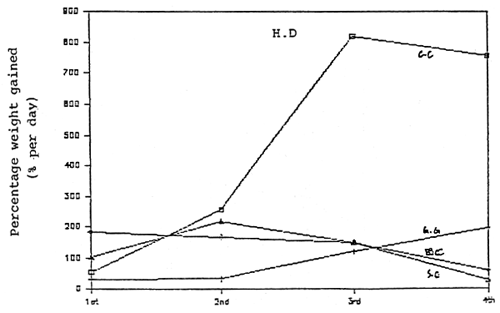
Fig 3. The percentage weight gained (% per day) of fish of each species in L.D and H.D during grow out period (Jan. - Jul.86)
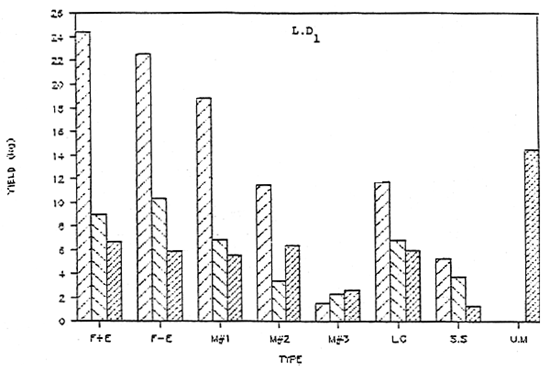
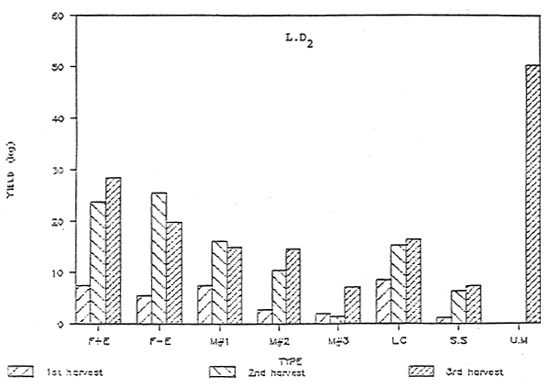
Fig 4. Prawn yield (kg) in L.D replicate of each category at each partial harvest during grow out period (mid Dec. 1985 - mid July 1986).
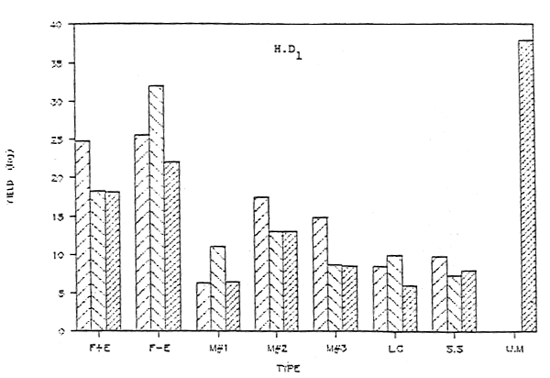
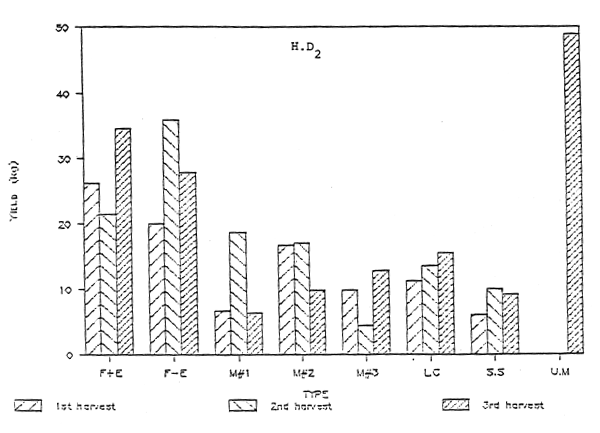
Fig 5. Prawn yield(KG) in H.D replicate of each category at each partial harvest during grow out period (mid Dec. 1985 - mid July 1986).
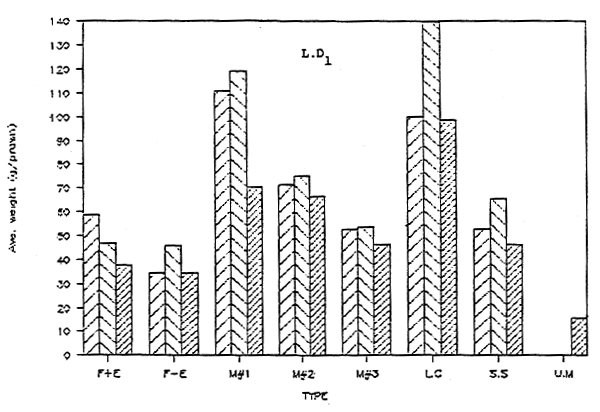
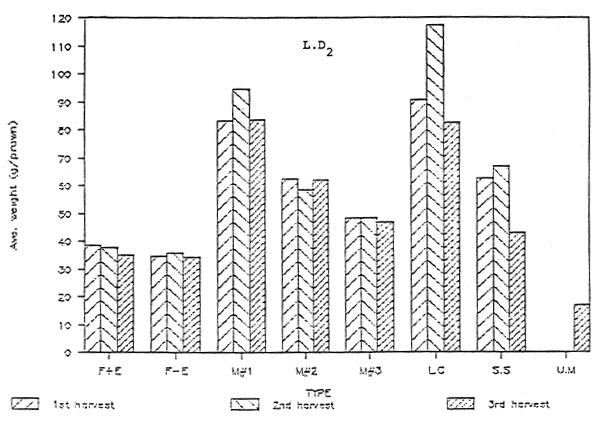
Fig 6. Average weight (g per prawn) in L.D replicate of each category at each partial harvest during grow out period (mid Dec. 1985 - mid July 1986).
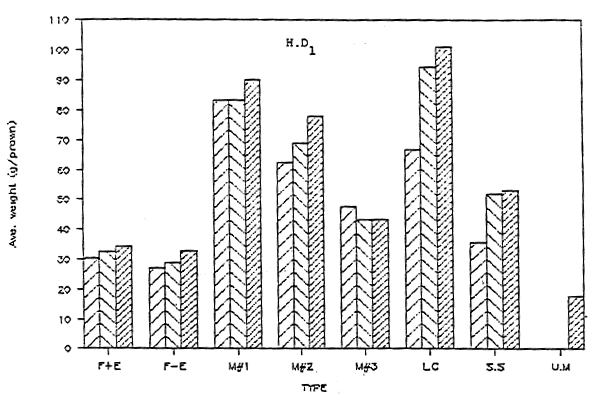
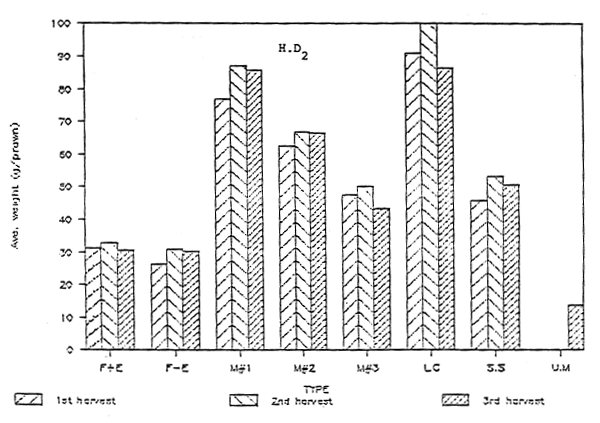
Fig 7. Average weight (f per prawn) in H.D replicate of each category at each partial harvest during grow out period (mid Dec. 1985 - mid July 1986).
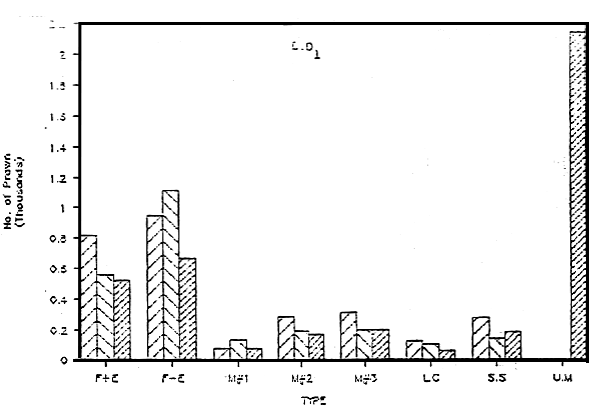
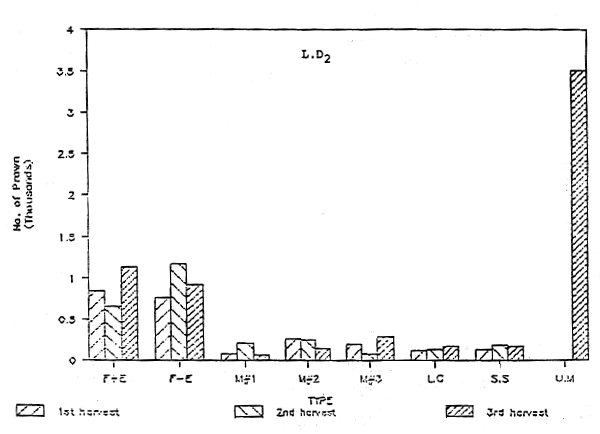
Fig 8. Number of prawn in L.D replicate of each category at each partial harvest during grow out period (mid Dec. 1985 - mid July 1986).
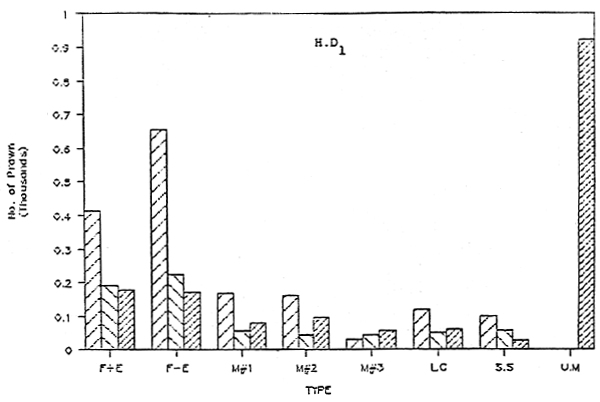
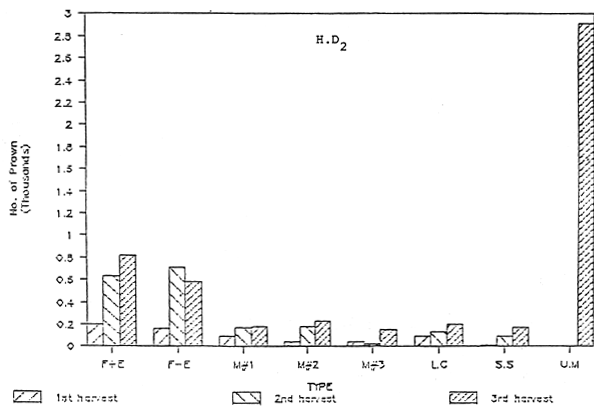
Fig 9. Number of prawn in H.D replicate of each category at each partial harvest during grow out period (mid Dec. 1985 - mid July 1986).
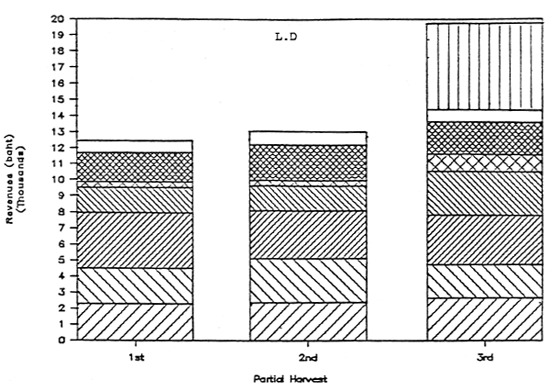
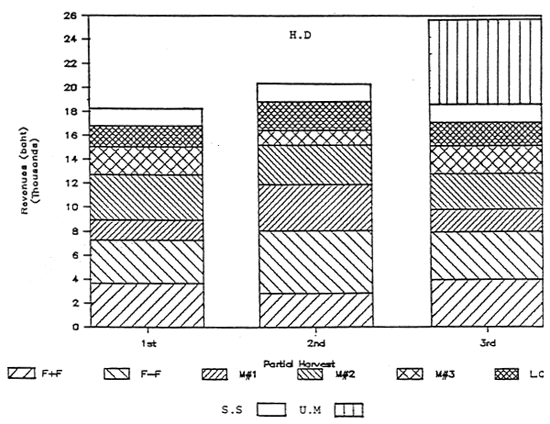
Fig. 10. The economical production of prawn in both L.D and H.D at each partial harvest.
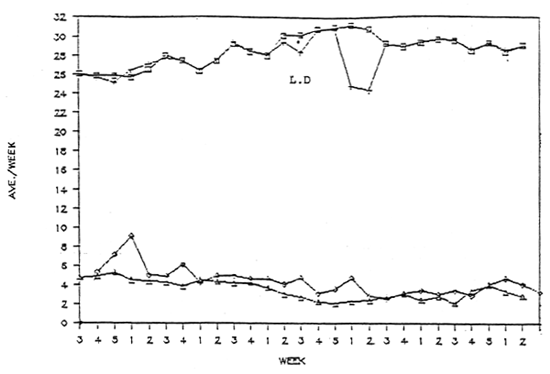
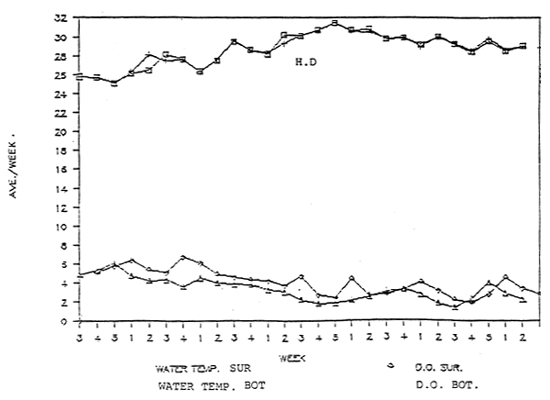
Appendix 1. Weekly DO concentration (ppm) and water temperature (°C) between surface and bottom in L.D and H.D pond at the morning measurement (January - July 1986
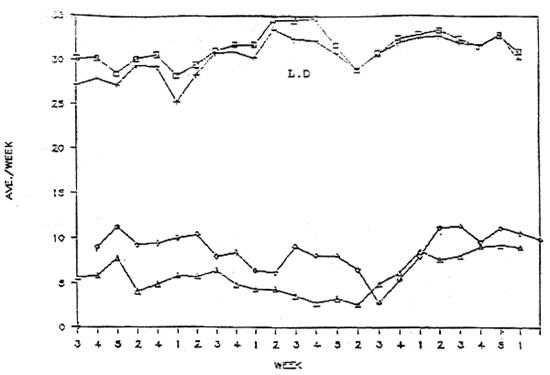
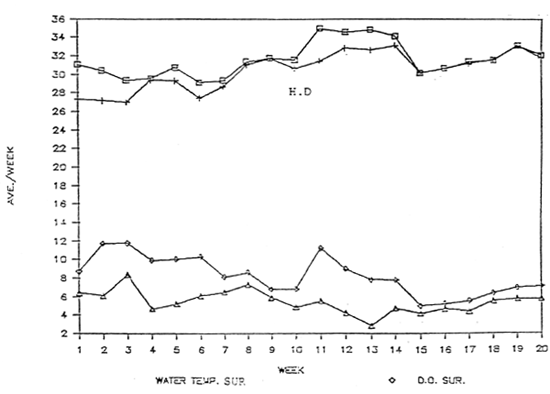
Appendix 2. Weekly DO concentration (ppm) and water temperature (°C) between surface and bottom at the afternoon measurement (January - July 1986).
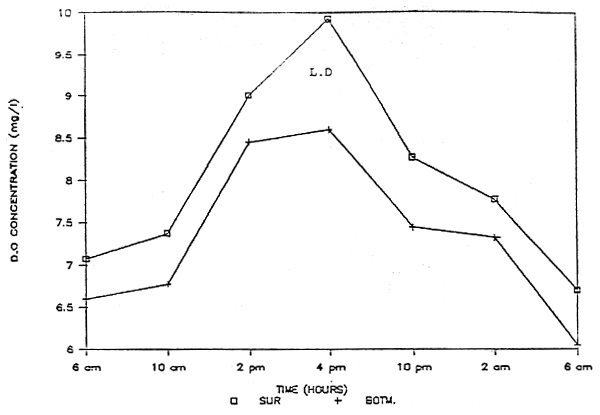
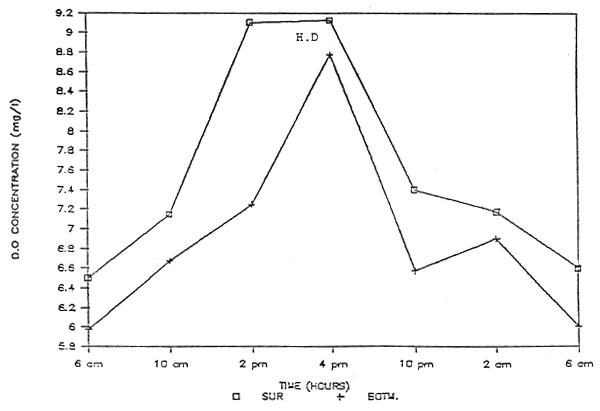
Appendix 3. Diurnal DO (ppm) between surface and bottom in L.D and H.D pond on 15 January 1986.
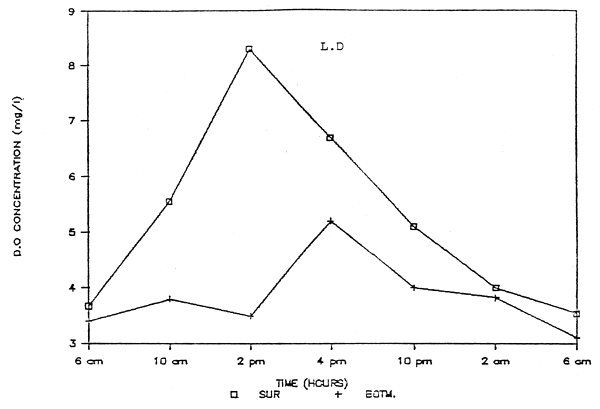
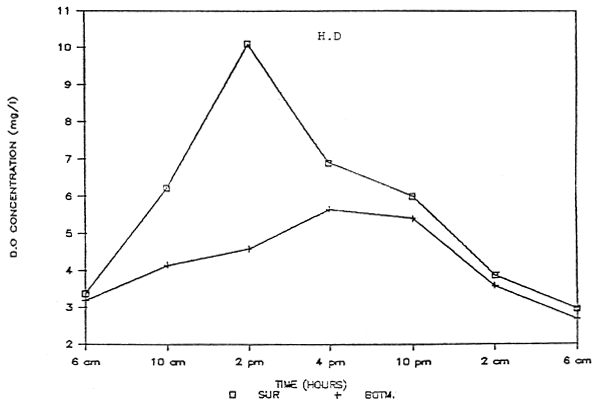
Appendix 4. Diurnal DO (ppm) between surface and bottom in L.D and H.D pond on 4 April 1986.
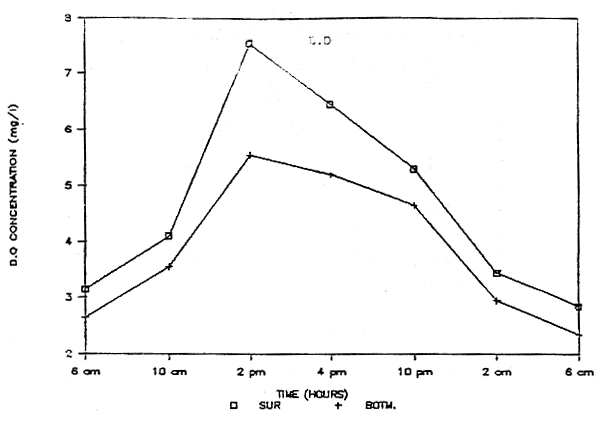
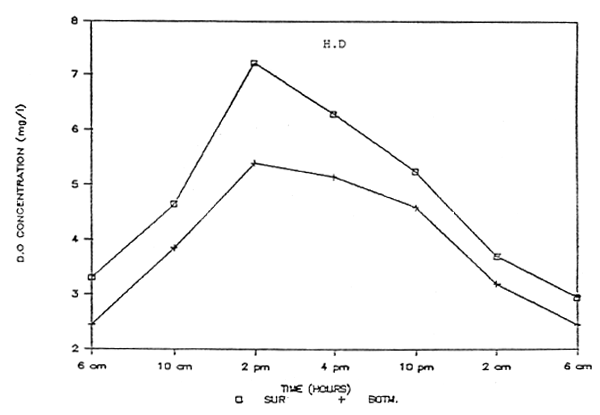
Appendix 5. Diurnal DO (ppm) between surface and bottom in L.D and H.D pond on 31 May 1986.
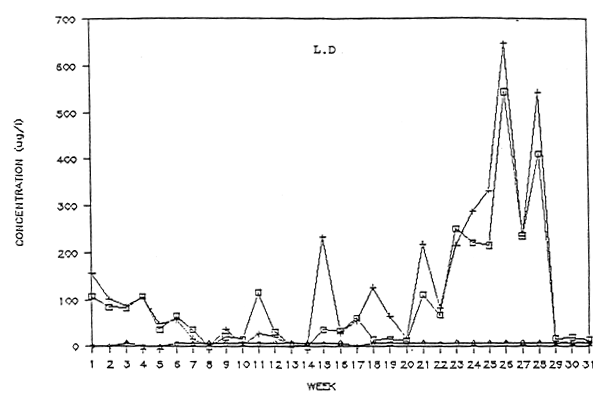
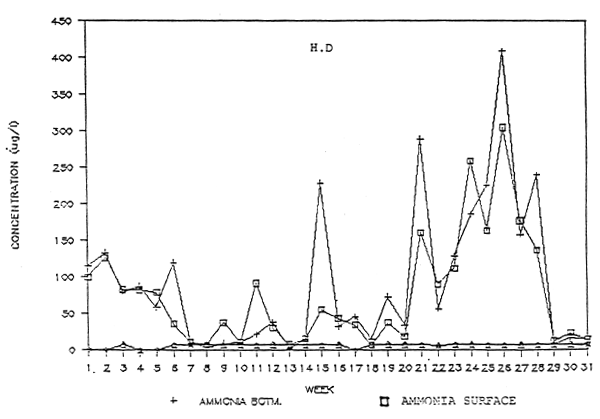
Appendix 6. Weekly Ammonia concentration (ug/1) between surface and bottom in L.D and H.D pond (Dec. 1985 - July 1986).
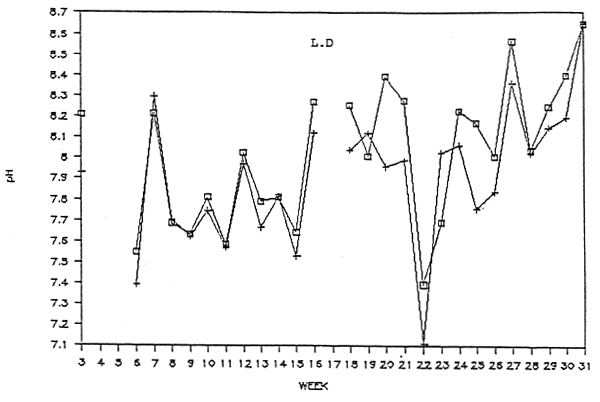
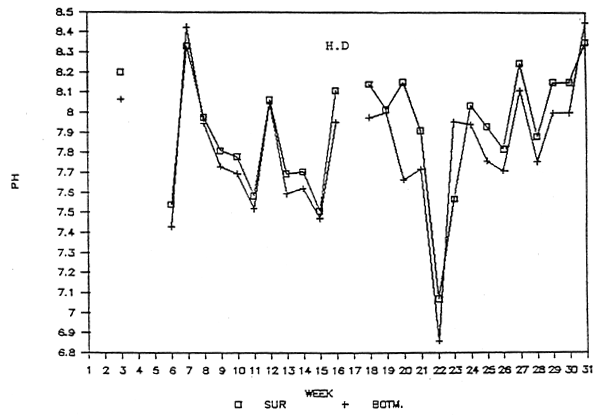
Appendix 7. Weekly pH between surface and bottom in L.D and H.D pond (Dec. 1985 - July 1986).
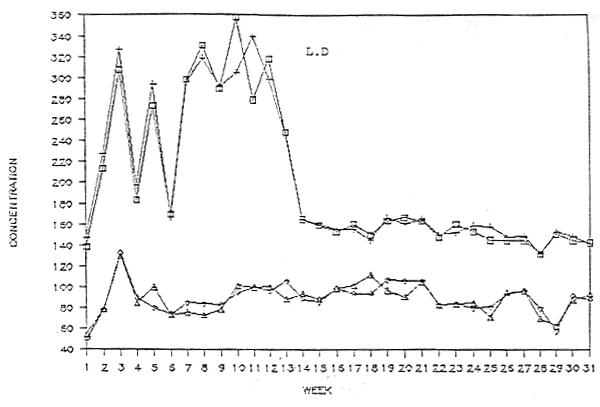
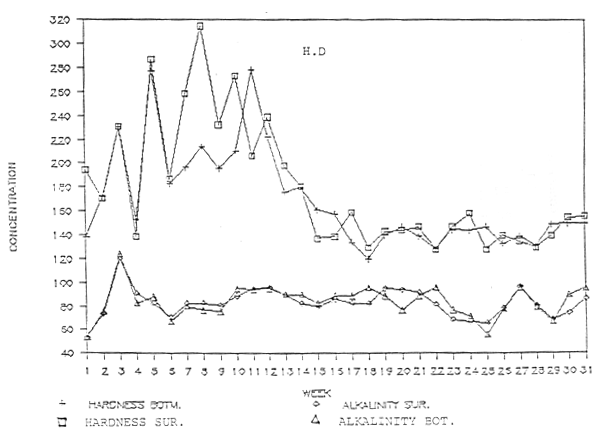
Appendix 8. Weekly hardness and alkalinity concentration (CaCO3. eg) between surface and bottom in L.D and H.D pond (Dec. 1985 – July 1986).
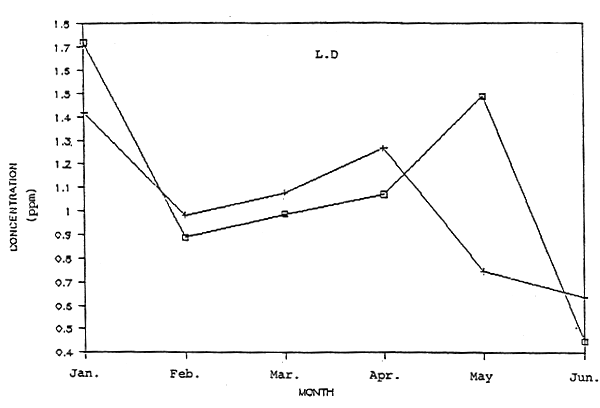
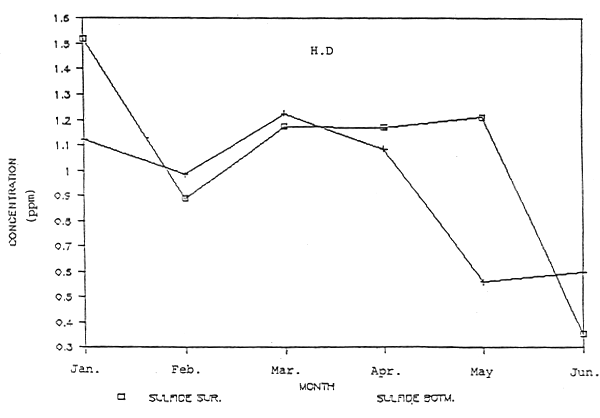
Appendix 9. Monthly hydrogen sulfide (ppm) between surface and bottom in L.D and H.D pond (January – June 1986).
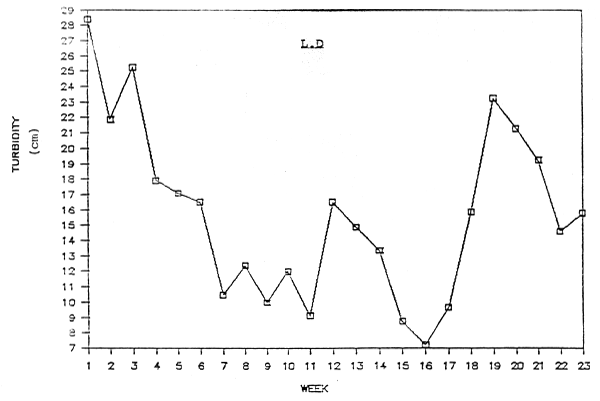
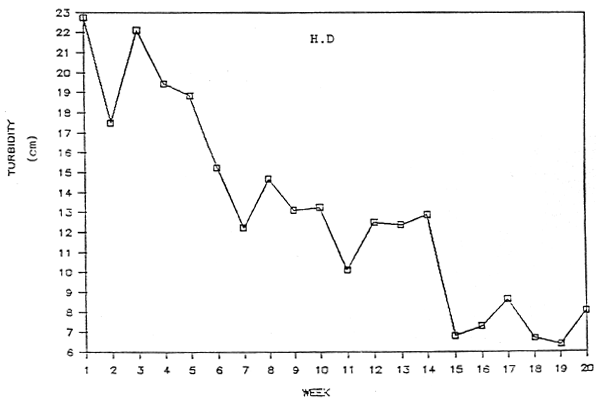
Appendix 10. Weekly turbidity (cm) in L.D and H.D pond at the afternoon measurement (January – July 1986).
| Pond Number | Stomach Sample of | Mean Bulk Index (MBI) | |||||||
| Aquatic plant | Algae | Pelet | Manure | Benthos | Insect | Zoo | Phyto | ||
| P11 | Coaaon carp | 2.5 | 4 | 1 | 2.5 | ||||
| P12 | Coaaon carp | 2.5 | 4 | 1 | 2.5 | 6 | 6 | 6 | |
| P11 | Giant gouraay | 2.5 | 3.5 | 1 | 4.5 | ||||
| P12 | Giant gouraay | 3 | 1.5 | 1.5 | 4.5 | 6 | 6.5 | 6.5 | 6.5 |
| P11 | Big head | 1 | 4 | 3.5 | 2.5 | 4 | |||
| P12 | Big head | 1 | 2 | 3 | 4 | ||||
| P11 | Silver carp | ||||||||
| P12 | Silver carp | 1 | 3 | 2 | |||||
| P11 | Prawn | 5 | 1 | 2.5 | 2.5 | 5 | 5 | ||
| P12 | Prawn | 1 | 2.5 | 2.5 | 4 | 5 | |||
| P21 | Coaaon carp | 3.5 | 1 | 2 | 3.5 | 6 | 5 | ||
| P22 | Coaaon carp | 3 | 1.5 | 1.5 | 4 | 6 | 6.5 | 5.5 | |
| P21 | Giant gouraay | 2 | 1 | 4 | 4.5 | 3.5 | |||
| P22 | Giant gouraay | 2.5 | 1 | 2.5 | 5 | 4 | |||
| P21 | Big head | 1 | 2 | 3 | |||||
| P22 | Big head | 1 | 2 | 3 | |||||
| P21 | Silver carp | 1 | 3 | 2 | |||||
| P22 | Silver carp | 1 | 2.5 | 2.5 | |||||
| P21 | Prawn | 1 | 2.5 | 2.5 | 4 | ||||
| P22 | Prawn | 1 | 2 | 4 | 3 | ||||
Appendix 11. Mean bulk index (MBI) of fish and prawn stomach content in L.D and H.D pond (Sample date : 14 March 1986).
| Pond Number | Stomach Sample of | Mean Bulk Index (MBI) | ||||||
| Aquatic plant | Algae | Prawn | Pellet | Benthos | Zoo | Phyto | ||
| P11 | Coaaon carp | 1 | 3 | 2 | ||||
| P12 | Coaaon carp | 2.5 | 1 | 2.5 | 5 | 4 | ||
| P11 | Giant gouraay | 1 | 2 | 4 | 3 | |||
| P12 | Giant gouraay | 2 | 3 | 1 | 4 | |||
| P11 | Big head | 1 | 2 | |||||
| P12 | Big head | 2 | 1 | 4 | 3 | |||
| P11 | Silver carp | 1 | 2 | |||||
| P12 | Silver carp | 1 | 3 | 2 | ||||
| P11 | Prawn | 2 | 1 | 3 | 4.5 | 4.5 | ||
| P12 | Prawn | 3.7 | 2 | 1 | 3.3 | 5.6 | 5.3 | |
| P21 | Coaaon carp | 2 | 1 | 4 | 3 | |||
| P22 | Coaaon carp | 2.5 | 1 | 2.5 | 5 | 4 | ||
| P21 | Giant gouraay | 1.5 | 1.5 | 3 | ||||
| P22 | Giant gouraay | 1 | 2 | 3 | ||||
| P21 | Big head | 1 | 3 | 2 | ||||
| P22 | Big head | 1 | 2 | 3 | ||||
| P21 | Silver carp | 1 | 2 | |||||
| P22 | Silver carp | 1 | 2 | |||||
| P21 | Prawn | 4 | 2 | 1 | 3 | 6 | 5 | |
| P22 | Prawn | 3 | 1.5 | 1.5 | 5 | 4 | ||
Appendix 12. Mean bulk index (MBI) of fish and prawn stomach content in L.D and H.D pond (Sample date : 15 July 1986).
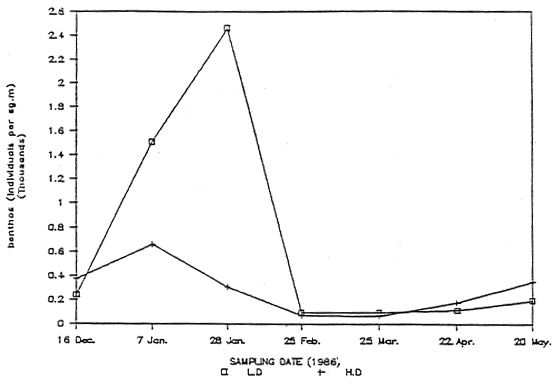
Appendix 13. Benthos biomass (individuals per sq.m) on biweekly measurement in L.D and H.D pond
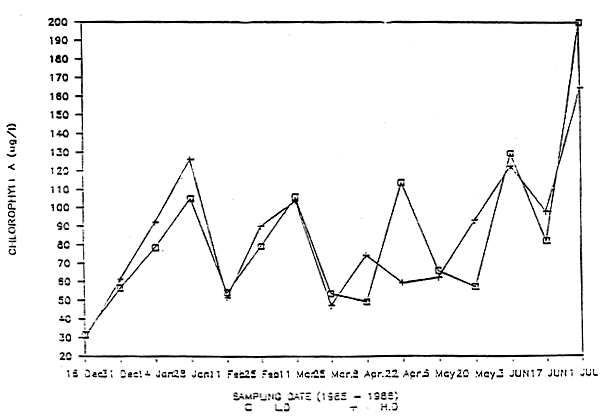
Appendix 14. Chlorophyll a (ug/1) on weekly measurement in L.D and H.D pond
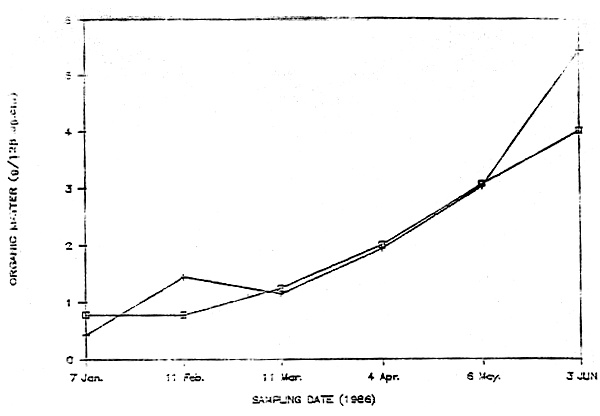
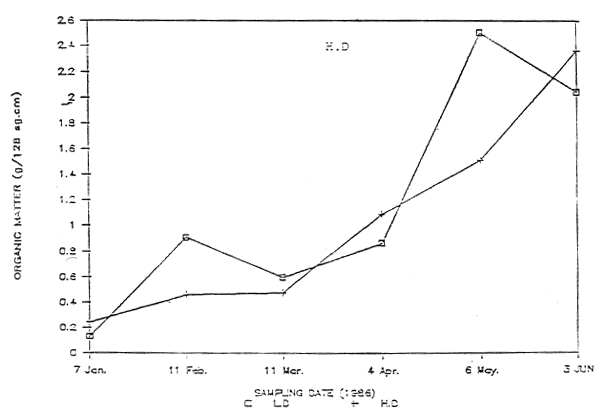
Appendix 15. Organic matter (g/128 sq.m) with and without cover on monthly measurement in L.D and H.D ponds.
