| NACA/WP/88/72 | DECEMBER 1988 |
 | FORMALIN : ITS TOXICITY TO AEROMONAS HYDROPHILA, PLANKTONS AND DEGRADATION |
Supranee Chinabut
Chalor LImsuwan
Maliwan Sangjan
Hyperlinks to non-FAO Internet sites do not imply any official endorsement of or responsibility for the opinions, ideas, data or products presented at these locations, or guarantee the validity of the information provided. The sole purpose of links to non-FAO sites is to indicate further information available on related topics.
This electronic document has been scanned using optical character recognition (OCR) software. FAO declines all responsibility for any discrepancies that may exist between the present document and its original printed version.
Supranee Chinabut, Chalor Limsuwan and Maliwan Sangjan
ABSTRACT
The toxicity of formalin at the concentrations of 25, 50 and 75 ppm to Aeromonas hydrophila was studied. A formalin concentration of 25 ppm killed 99.90 percent of bacteria within 24 hours. Concentrations at 50 and 75 ppm killed 100 percent of A. hydrophila within 24 and 12 hours, respectively.
Degradation of formalin was studied at the water temperature 27–30°C in aerated and non-aerated aquaria with and without fish. In the aerated aquaria with fish, formalin degraded more rapidly than in other groups. At 25, 50 and 75 ppm, formalin completely degraded within 36, 48 and 54 hours in aerated group. In the non-aerated group, it did not degrade until after 36, 54 and 60 hours, respectively. In fiberglass containers, the degradation of formalin at the concentrations of 25 and 50 ppm was similar in the early hours (P<0.05). However 25 ppm formalin degraded more quickly and completely within 48 hours compared to 60 hours for a concentration of 50 ppm (P>0.05).
Formalin at 25 and 50 ppm significantly reduced the amount of plankton and dissolved oxygen during the exposure time of 48 hours. The results also showed that the total ammonia concentration slightly decreased in the early hours. Other water quality parameters did not change.
INTRODUCTION
The fish farming industry in Thailand is an expanding sector of the economy. However, it has been recently beset by a number of major diseases which has increased the level of medication used by farmers. Apart from antibiotics used in the feed, the main medication taken in the form of external treatment via the water is formalin. This compound is very active against external parasites which are themselves the cause of infections, or predispose the fish to other infections (Davis et al., 1973; Goodman & Alfred 1975; Kabata 1985). It is likely that as fish culture becomes more intensive, formalin will be more widely used.
Although some information on the toxicity and efficacy of formalin is available in developing countries, there is no published information on the degradation of formalin or its toxic effect on bacteria Aeromonas hydrophila which is the most important fish pathogen. In order to use formalin effectively, the degradation rate must be known so that the chemical can be added into the water at the proper time. Thus, the specific objectives of the study are as follows:
To determine the toxicity of formalin to Aeromonas hydrophila.
To determine the degradation rate of formalin in aquaria and fiberglass tanks.
To determine the effect of formalin on water quality in fiberglass tank with high density of planktons.
To determine the toxicity of formalin to planktons.
MATERIALS AND METHODS
The experiments were conducted in the National Inland Fisheries Institute laboratory in Bangkok.
1. The toxicity of formalin to Aeromonas hydrophila.
A virulent strain of A. hydrophila isolated from a diseased walking catfish (Clarias batrachus L.) was maintained on nutrient agar (NA) at 4°C. Then it was cultured on Brain Heart Infusion slant (BHI) and incubated for 18–20 hours at 30°C before the experiment started. Bacterial cultures were identified by the method described in Bergey's manual (Buchanan & Gibbons 1974).
The bacterial suspension was made by adding isotonic saline into the culture tubes until the optical density (O.D.) was 0.5 at 540 nm. on a Baush & Lomb Spectronic 20 spectrophotometer. One ml of this bacterial suspension was added into each of the eight flasks which contained 78 ml. isotonic saline. One ml of formalin stock solution at the concentrations of 2000, 4000 and 6000 ppm were added into each flask so that the concentrations of formalin were 25, 50 and 75 ppm, respectively. Distilled water was added to the control flasks. These experimental flasks were incubated at 30°C.
Culture samples were withdrawn at 15 min, 1, 2, 3, 6, 12 and 24 hours and the viable counts were determined by the drop method (Collin & Lyne 1976).
The effect of formalin on growth of A. hydrophila was compared with the untreated control.
2. The degradation rate of formalin in aquaria and fiberglass tanks.
Aquaria Experiment
Test fish and acclimation
Common carps (Cyprinus carpio Linn) weighing an average of 0.25– 0.4 gm were acclimated in aquaria (45×100×45 cm3) containing well water and fed with pellet feed twice a day during the acclimation period. Fish were not fed during the 24 hours before the test or during the test period.
Experimental design for aquaria
There were four sets of experimental aquaria, aerated and nonaerated aquaria with and without fish present in the containers. Two replications for each treatment were conducted.
Experiment with fish
Twenty acclimated common carps were moved into each aquarium containing 100 litres of well water. Formalin was added into the experimental aquaria at the concentrations of 25, 50 and 75 ppm. No formalin was added into the non-treated controlled aquaria.
Formalin residue was measured following the method of AOAC (1984) at 0, 6, 12, 24, 36, 48, 54, 60, 72 hours after treatment.
Data were analyzed statistically by analysis of variance and Duncan's new multiple range test (Steel & Torried 1986).
Experiment without fish
The experiment was conducted using the same methods as in the experiment with fish, described above.
Experimental design for fiberglass tanks
Five pairs of Nile tilapia (Oreochromis niloticus, Linn) broodstock were moved into the fiberglass tanks which contained 1500 litres of green water from the fish pond. The turbidity value was 30 cm. Fish were fed once a day with floating pellet at the rate of 3 percent of body weight through the experimental period.
Formalin at the concentrations 25 and 50 ppm was added into the experimental tanks with two replications for each treatment.
Formalin residue was measured following the method of AOAC (1984) at 0, 6, 30, 54 and 78 hours after treatment.
3. To determine the effect of formalin on water quality in fiberglass tank with high density of planktons.
Fiberglass tanks were filled with 1500 litres of green water from fish pond. The turbidity of water was 30 cm. Five pairs of Nile tilapia were stocked per tank. Fish were fed once a day at 3 percent of body weight during the test period.
Therapeutic levels of formalin at concentrations of 25 and 50 ppm were applied to each tank with two replications, and to untreated controls. Analysis of water quality parameters, pH, temperature, dissolved oxygen, hardness, alkalinity and free carbon dioxide, of the experimental water was conducted according to the procedures outlined in Standard Methods for the Examination of Water and Wastewater (APHA) 1981). Total ammonia was determined by the method of Koroleff (Grasshoff 1976). Turbidity values were determined at 0, 6, 30, 54 and 78 hours after treatment.
Data was analysed using analysis of variance and Duncan's new multiple range test (Steel & Torri 1986).
4. To determine the toxicity of formalin to planktons.
The experiment was conducted using the same qualities and measures in the third one. Plankton samples were collected at 0, 6, 30, 54 and 78 hours. The post-treatment plankton specimens preserved in 5 percent formalin were counted and identified.
Statistical comparison was made among the treatments.
RESULTS AND DISCUSSION
Toxicity of formalin to Aeromonas hydrophila
Formalin at a concentration of 25, 50 and 75 ppm each significantly killed Aeromonas hydrophila colonies more than 90 percent within one hour, with the degree of efficacy apparently being dose-dependent.
Table 1 and Fig. 1 show that a formalin concentration of 25 ppm killed 99.90 percent of the bacteria A. hydrophila within 24 hours while formalin at the concentration of 50 and 75 ppm completely destroyed bacterial colonies within 24 and 12 hours, respectively.
Table 1. The number of bacteria A. hydrophila growing after formalin treatment at various concentrations.
| Formalin Concentration (ppm.) | Bacterial count | ||||||
| 15 min | 1 | 2 | 3 | 6 | 12 | 24 | |
| 0 | 5.80×10⁶ | 5.67×10⁶ | 5.35×10⁶ | 4.95×10⁶ | 4.50×10⁶ | 3.75×10⁶ | 2.85×10⁶ |
| (6.76) | (6.75) | (6.73) | (6.70) | (6.65) | (6.57) | (6.45) | |
| 25 | 4.60×10⁶ | 4.75×10⁶ | 3.05×10⁵ | 1.70×10⁵ | 5.25×10⁴ | 9.55×10³ | 2.90×10³ |
| (6.66) | (5.68) | (5.49) | (5.19) | (4.72) | (3.98) | (3.46) | |
| 50 | 4.45×10⁶ | 4.25×10⁵ | 1.68×10⁵ | 3.20×10⁴ | 5.05×10³ | 6.15×10² | 0 |
| (6.65) | (5.63) | (5.23) | (4.51) | (3.71) | (2.79) | ||
| 75 | 4.20×10⁶ | 3.15×10⁵ | 1.07×10⁵ | 1.35×10⁴ | 2.30×10³ | 1.38×10² | 0 |
| (6.62) | (5.49) | (5.03) | (4.12) | (3.36) | (2.14) | ||
Remark Number in the parenthesis are logarithmic values of the mean
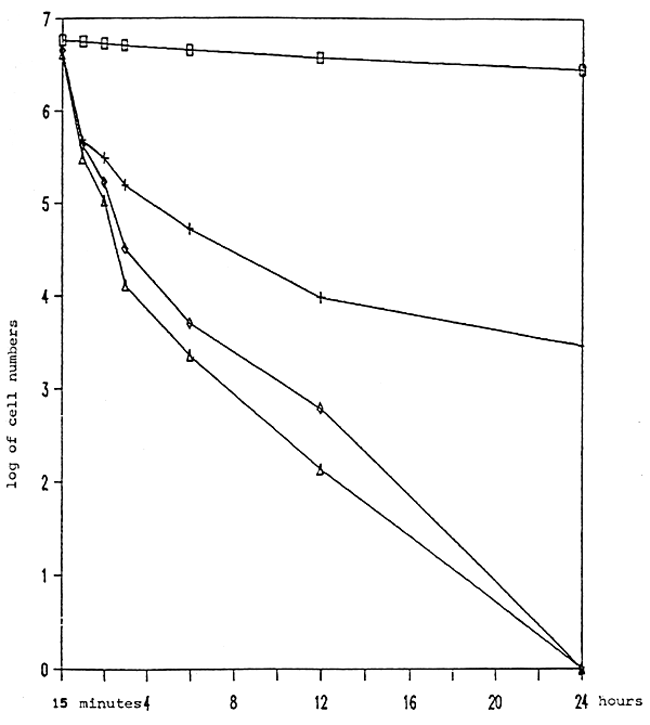
| ▟ CONTROL | + 25 ppm. | ◊ 50 ppm. |
Fig. 1. Toxicity of formalin to A. hydrophila
The results of these experiments support the findings of earlier investigators, Braswell and his colleagues (1970) who reported that 15–25 ppm formalin applied to nutrient broth with bacteria significantly inhibited the growth rate of the bacteria.
The relatively large organic load of a fish pond might decrease the effective concentrations of formalin in the ponds and simultaneously provide a greater nutrient base for bacterial and protozoan repopulation. Formalin concentration of 25 to 50 ppm provides effective reduction of ciliates protozoa (Bell et al., 1987) and bacterial colonies in water and does not cause much damage to fish tissues. This 25–50 ppm range of formalin concentration is the representative mode of formalin treatment.
Degradation rate of formalin in aquaria and fiberglass tanks.
Degradation rate of formalin in aquaria and fiberglass tanks was correlated to the time and test conditions. Aeration significantly caused a higher degradation rate. In the aerated aquaria with fish, formalin was degraded more rapidly than in other groups which were aerated without fish, non-aerated with and without fish (Fig. 2, 3). It is possible that part of the formalin may have been absorbed by the fish through the skin.
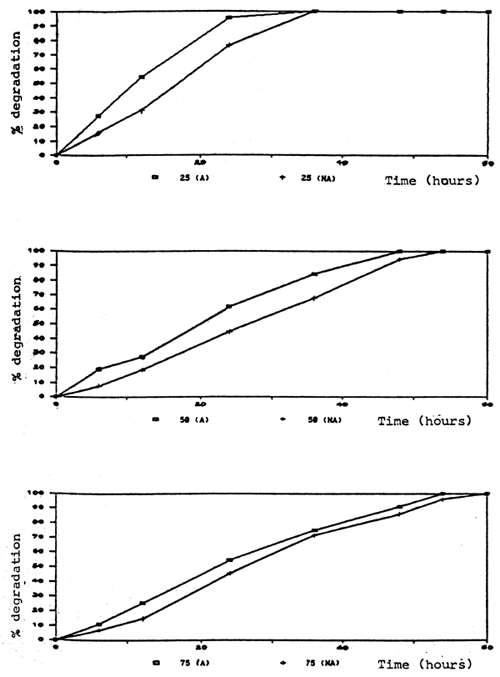
Fig. 2. Percent degradation of formalin at various concentrations in aquaria with fish.
(A) = aerated (NA) = non-aerated
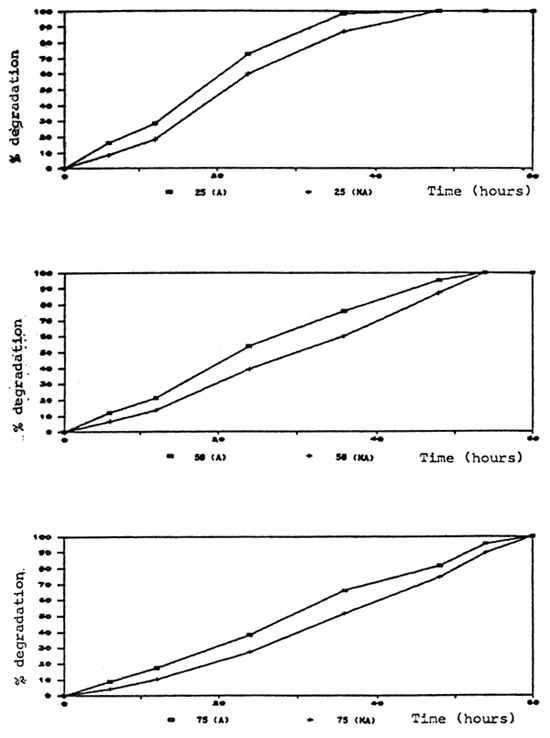
Fig. 3. Percent degradation of formalin at various concentrations in aquaria without fish.
(A) = aerated (NA) = non-aerated
Formalin at 25 ppm was completely removed from the water within 36 hours in both aerated and non-aerated conditions. At the 75 ppm degradation rate was slower than at 25 and 50 ppm in both test conditions (Tables 2, 3, 4, 5, 6).
In fiberglass tanks, the degradation rate of formalin was slightly slower than in aquaria (Table 7). The degradation of formalin at the concentrations of 25 to 50 ppm was similar in the early hours (P<0.05), however, formalin at 25 ppm degraded more quickly and completely within 48 hours compared to 60 hours for 50 ppm (P>0.05).
In aerated condition, residual formalin at 24 hours after treatment from the starting concentrations of 25, 50 and 75 ppm were 1.31, 21.20 and 36.95 ppm, respectively. Over the same time, 6.69, 30.44 and 43.69 ppm of residual formalin were detected in the non-aerated group which had the started concentration of 25, 50 and 75 ppm, respectively. This suggests that retreatment of formalin in the aquaria at the concentration of 25 ppm may be repeated at 24 hours after the first treatment.
Residual formalin from the fiberglass tanks containing green water at 24 hours after treatment from the starting concentrations of 25 and 50 ppm were 10.82 and 29.86 ppm, respectively. Thus, 24 hours after the first treatment, 15 and 20 ppm of formalin can be added to maintain the concentration of 25 and 50 ppm.
Effect of formalin on water quality
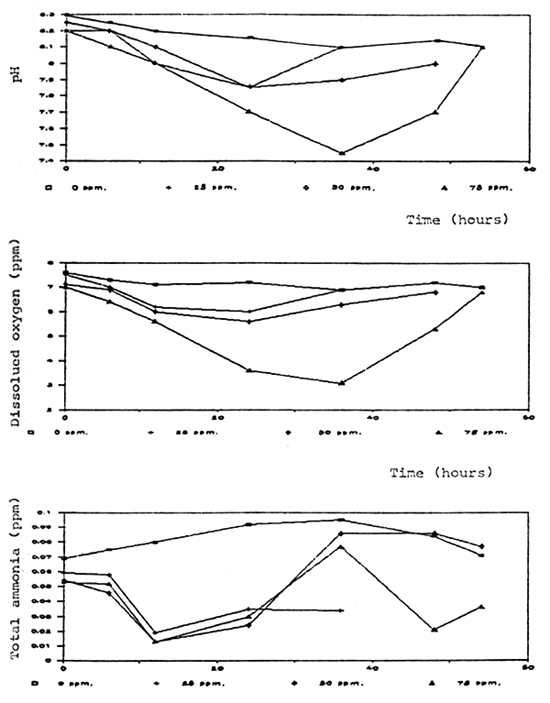
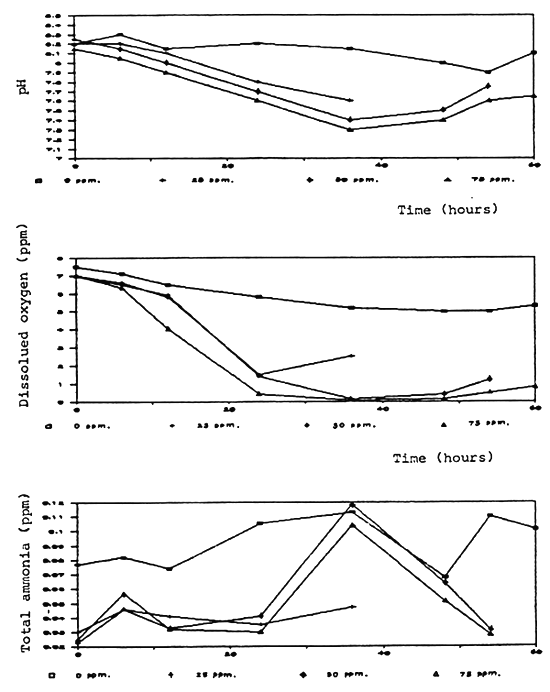
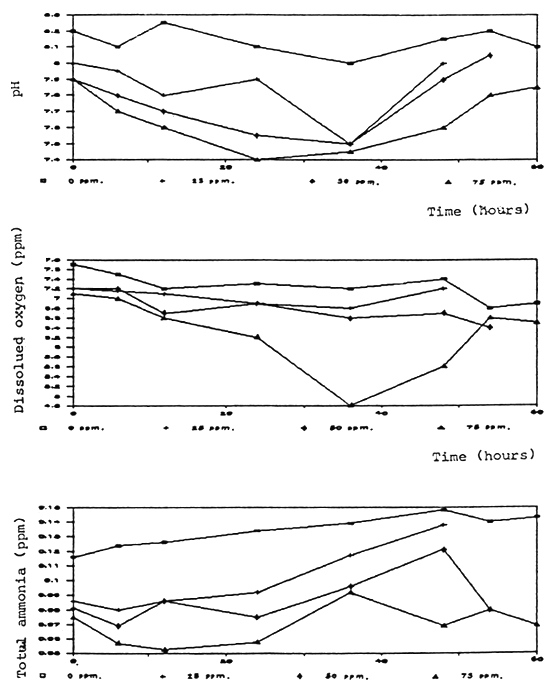
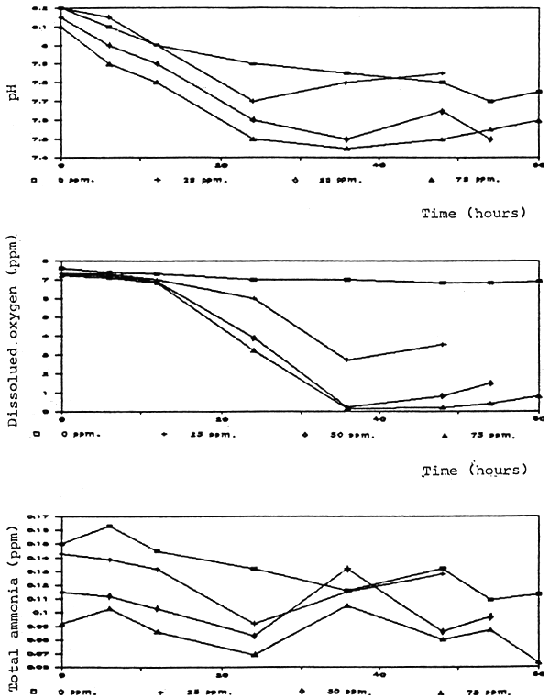
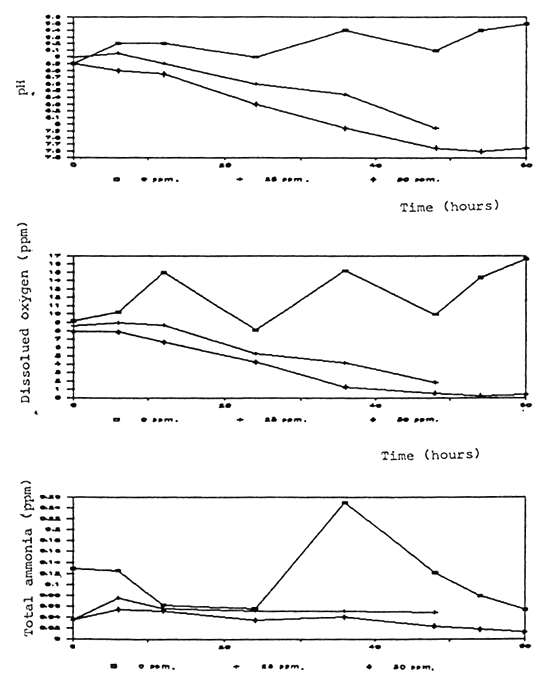
Dissolved oxygen was significantly reduced after application of formalin especially in the non-aerated aquaria (Fig. 4, 5, 6, 7, 8). A similar conclusion was reported by Chalor (1985); Temdoung et al., (1987) and Vinich et al., (1987). Roberts and Shepherd (1979) explained that formalin removed oxygen from the solution and this effect reached a peak approximately 24 hours after it had been added to a pond. Formic acid is produced in the oxidation reaction of formaldehyde (Wellborn 1979). On the other hand, death of planktons from the formalin treatment in the water reduced photosynthesis and caused oxidation reaction of dead organisms to lower the dissolved oxygen in the tank (Allison, 1962).

Other water quality parameters were unchanged except pH and ammonia which slightly decreased after formalin application. The formic acid and the methylenetetramine compound produced from ammonia and formalin reaction (Tongchai 1982) may cause low pH and low ammonia in the water, respectively.
An indefinite treatment with formalin in green water pond may cause oxygen deficiency which is dangerous to some aquatic animals that cannot tolerate low oxygen condition. Thus, aeration or water change is recommended in the formalin treatment ponds.
The toxicity of formalin to planktons
The reduction in plankton counts in fiberglass tanks was correlated to the time and test conditions (Table 8, 9, 10). Formalin at a concentration of 50 ppm reduced the number of plankton more significantly than 25 ppm and 0 ppm (control).
Table II shows that 50 ppm formalin increases the turbidity value of the water more than 25 ppm does.
RECOMMENDATIONS
The findings of this study show that 25–50 ppm appears to be the appropriate formalin dose for pond treatment to reduce the levels of external fungi, protozoans, ectoparasitic monogeneans, crustaceans and bacteria A. hydrophila. Oxygen deficiency may occur in the green water ponds after treatment with formalin, so that formalin treatment should be done in the early morning of a sunny day when photosynthesis of phytoplankton will increase oxygen content.
REFERENCES
Allison, R. 1957. Some new results in the treatment of ponds to control some external parasites of fish. Prog. Fish-Cult. 19(2): 58–63.
AOAC. 1984. Official Methods of Analysis. 14th ed., William Byrd Press, Inc., Virginia. 1421 p.
APHA, AWWA and WPCA. 1981. Standard Methods for the Examination of Water and Wastewater. 15th ed., American Public Health Association, Washington, D.C. 1134 p.
Bell, T.A., C.S. Arume and D.V. Lightner. 1987. Effecacy of formalin reducing the levels of peritrichous ciliates on cultured marine shrimp. J. Fish. dis. 10: 45–51.
Buchanan, R.E. and N.E. Gibbons. 1974. Bergey's Manual of Determinative Bacteriology. 8th ed., The Williams and Wilkins co., Baltimore. 1268 p.
Chalor, L. 1985. Fish Diseases. Fisheries Faculties, Kasetsart University, Bangkok. 227 p. (In Thai).
Collins, C.H. and P.M. Lyne. 1976. Microbiological methods 4th ed., Butterworths. (Publishers) Inc., London. 521 p.
Davis, B.D., D. Renato, N.E. Herman, S.G. Harold and W. Barry. 1973. Microbiology 2nd ed., Harper & Row Publisher, New York. 1562 p.
Goodman, L.S. and G. Alfred. 1975. The Pharmacological Basis of Therapeuties. 5th ed., Macmillan Publishing Co., Inc, New York. 1704 p.
Grasshoff, H. 1976. Methods of Seawater Analysis. Verlag Chemic, New York. 317 p.
Kabata, Z. 1985. Parasites and Disease of Fish Culture in the Tropics. Taylor & Francis, London. 318 p.
Roberts, R.J. and C.J. Shepherd. 1979. Handbook of Trout and Salmon Disease. The Whitefriars Press Ltd., London. 172 p.
Steel, R.G.D. and J.H. Torrie. 1986. Principles and Procedures in Statistics. McGraw-Hill, New York. 633 p.
Temdoung Pungkachonboon, C. Limsuwan and S. Chinabut. 1987. Toxicity of formalin to common carp, Cyprinus carpio L. In: Proceeding of the 25th Kasetsart University Conference, Fisheries Section, Kasetsart University, Bangkok. 13–22 p. (In Thai).
Vinich Tunsakul, Tongsuk Sai-Lee and Akaluck Sae-Loaw. 1987. Acute toxicity and treatment effect of formalin to early larvae prawn, Macrobrachium rosenbergii (De Man). In: Proceeding of the 25th Kasetsart University Conference Fisheries Section, Kasetsart University, Bangkok, 23–33 p. (In Thai).
Wellborn, T.L. 1979. Control and therapy, pp 61–62. In: J.A. Plumb (ed.). Principle Disease of Farm-Raised Catfish. Sothern cooperative Series No. 225. Alabama.
Table 2. The percentage of formalin degradation rate at various time scales after the treatment in aquaria contained fish
| Formalin Concentration (ppm) | percent degradation of formalin* | |||||||
| 0 | 6 | 12 | 24 | 36 | 48 | 54 | 60 hours | |
| 25 (A) | 0 | 27.42a | 54.38a | 95.41a | 100a | 100 | 100 | 100 |
| 25 (NA) | 0 | 16.30b | 31.43b | 76.29b | 100a | 100 | 100 | 100 |
| 50 (A) | 0 | 19.10a | 27.58a | 61.74a | 84.38a | 100a | 100a | 100 |
| 50 (NA) | 0 | 7.58b | 18.86b | 44.82b | 67.72b | 94.26b | 100a | 100 |
| 75 (A) | 0 | 10.98a | 25.37a | 54.48a | 74.83a | 91.17a | 100a | 100a |
| 75 (NA) | 0 | 6.82b | 14.82b | 45.55b | 71.64b | 85.77b | 96.27b | 100a |
Remark (A) = aerated
(NA) = non-aerated
* Values within a column of the same concentration and a different letter are significantly different.
Table 3. The percentage of formalin degradation rate at various time scales after treatment in aquaria without fish.
| Formalin Concentration (ppm.) | percent degradation of formalin* | |||||||
| 0 | 6 | 12 | 24 | 36 | 48 | 54 | 60 hours | |
| 25 (A) | 0 | 16.09a | 28.57a | 72.54a | 98.17a | 100a | 100 | 100 |
| 25 (NA) | 0 | 8.49b | 18.13b | 59.73b | 86.84b | 100a | 100 | 100 |
| 50 (A) | 0 | 11.83a | 21.13a | 53.66a | 75.74a | 95.13a | 100a | 100 |
| 50 (NA) | 0 | 6.35b | 13.59b | 39.41b | 60.35b | 87.06b | 100a | 100 |
| 75 (A) | 0 | 9.12a | 17.25a | 38.34a | 65.83a | 81.88a | 95.46a | 100a |
| 75 (NA) | 0 | 4.21b | 10.41b | 27.25b | 51.85b | 74.56b | 89.03b | 100a |
Remark (A) = aerated
(NA) = non-aerated
* Values within a column of the same concentration and with different letters are significantly different.
Table 4. The concentration of formalin residual at various time scales after treatment in the aquaria without fish.
| Formalin Treatment | Formalin residual (ppm) | ||||||||
| Concentration (ppm) | 0 | 6 | 12 | 24 | 36 | 48 | 54 | 60 hours | |
| 1 | 0 | 0 | 0 | 0 | 0 | 0 | 0 | 0 | 0 |
| 25 | 28.12 | 23.60 | 20.09 | 7.72 | 0.52 | 0 | 0 | 0 | |
| 50 | 55.78 | 49.18 | 44.06 | 25.85 | 13.53 | 2.71 | 0 | 0 | |
| 75 | 82.43 | 74.94 | 68.21 | 50.84 | 28.18 | 14.94 | 3.71 | 0 | |
| 2 | 0 | 0 | 0 | 0 | 0 | 0 | 0 | 0 | 0 |
| 25 | 27.23 | 24.92 | 22.30 | 10.97 | 3.59 | 0 | 0 | 0 | |
| 50 | 56.52 | 52.94 | 48.84 | 35.26 | 22.40 | 7.33 | 0 | 0 | |
| 75 | 80.69 | 77.29 | 72.28 | 58.71 | 38.85 | 20.55 | 8.22 | 0 | |
Remark Treatment 1 = aerated
Treatment 2 = non-aerated
Table 5. Percent degradation of formalin at various time scales after formalin treatment with aeration.
| Formalin Concentration (ppm) | percent degradation of formalin * | |||||||
| 0 | 6 | 12 | 24 | 36 | 48 | 54 | 60 hours | |
| 25 (F) | 0 | 27.42a | 54.38a | 95.41a | 100a | 100a | 100 | 100 |
| 25 (NF) | 0 | 16.09b | 28.57b | 72.54b | 98.17a | 100a | 100 | 100 |
| 50 (F) | 0 | 19.10a | 27.58a | 61.74a | 84.38a | 100a | 100a | 100 |
| 50 (NF) | 0 | 11.83b | 21.13b | 53.66b | 75.74b | 95.13b | 100a | 100 |
| 75 (F) | 0 | 10.98a | 25.37a | 54.48a | 74.83a | 91.17a | 100a | 100a |
| 75 (NF) | 0 | 9.12a | 17.25b | 38.34b | 65.83b | 81.98b | 95.46b | 100a |
Remark (F) = with fish
(NF) = without fish
* Values within a column of the same concentration and with a different letters are significantly different.
Table 6. Percent degradation of formalin at various time scales after formalin treatment in non-aerated experiment
| Formalin Concentration (ppm) | percent degradation of formalin* | |||||||
| 0 | 6 | 12 | 24 | 36 | 48 | 54 | 60 hours | |
| 25 (F) | 0 | 16.30a | 31.43a | 76.29a | 100a | 100a | 100 | 100 |
| 25 (NF) | 0 | 8.49b | 18.13b | 59.73b | 86.84b | 100a | 100 | 100 |
| 50 (F) | 0 | 7.58a | 18.56a | 44.82a | 67.72a | 94.26a | 100a | 100 |
| 50 (NF) | 0 | 6.35a | 13.59b | 39.41b | 60.35b | 87.06b | 100a | 100 |
| 75 (F) | 0 | 6.82a | 14.82a | 45.55a | 71.64a | 85.77a | 96.27a | 100a |
| 75 (NF) | 0 | 4.21a | 10.41b | 27.25b | 51.85b | 74.56b | 89.83b | 100a |
Remark (F) = with fish
(NF) = without fish
* Values within a column of the same concentration and with a different letter are significantly different.
Table 7. Percent degradation of formalin at various time scales after formalin treatment in fiberglass tank with fish.
| Formalin Concentration (ppm) | percent degradation of formalin | |||||||
| 0 | 6 | 12 | 24 | 36 | 48 | 54 | 60 hours | |
| 25 | 0 | 19.25a | 31.60b | 58.02c | 79.53d | 100h | 100h | 100h |
| 50 | 0 | 14.35a | 25.25b | 42.74c | 59.85e | 81.02f | 92.83g | 100h |
Remark * Values within a column of the same concentration but with a different letter are significantly different.
Time (hours)
Fig. 4 Water quality aerated aquaria with fish after formalin treatment
Time (hours)
Fig. 5 Water quality in non-aerated with fish after formalin treatment
Time (hours)
Fig. 6 Water quality in aerated aquaria without fish after formalin treatment
Time (hours)
Fig.7 Water quality in non-aerated aquaria without fish after formalin treatment
Time (hours)
Fig. 8 Water quality in fiber-glass tank after formalin treatment
Table 8. Numbers of planktons in untreated control fiberglass tank experiment at various time scales.
| Plankton | No. of plankton (cell/liter) | |||||
| Before treatment | treatment | |||||
| 0 | 6 | 30 | 54 | 78 hours | ||
| Coelastrum | 1,521 | 1,459 | 1,253 | 894 | 835 | 328 |
| Synedra | 1,357 | 1,236 | 1,020 | 1,003 | 668 | 365 |
| Dictyosphaerium | 1,303 | 1,251 | 859 | 798 | 572 | 201 |
| Anabaenopsis | 981 | 902 | 852 | 821 | 547 | 281 |
| Oocystis | 857 | 841 | 784 | 674 | 434 | 206 |
| Desmid | 509 | 497 | 256 | 208 | 137 | 91 |
| Scenedesmus | 49 | 48 | 39 | 33 | 16 | 18 |
| Pediastrum | 79 | 27 | 22 | 21 | 16 | 16 |
| Chroococcus | 48 | 42 | 38 | 34 | 32 | 0 |
| Staurastrum | 18 | 17 | 12 | 11 | 11 | 9 |
| Oedogonium | 9 | 6 | 6 | 4 | 3 | 3 |
| Keratella | 12 | 9 | 7 | 7 | 3 | 2 |
| Anabaena | 3 | 2 | 0 | 0 | 0 | 0 |
| Brachionus | 90 | 79 | 60 | 25 | 18 | 18 |
| Filinia | 8 | 5 | 3 | 3 | 2 | 0 |
| Nauplius | 12 | 12 | 11 | 9 | 3 | 0 |
| Copepod | 4 | 3 | 3 | 2 | 0 | 0 |
| Unidentified-green algae | 5 | 5 | 3 | 3 | 2 | 0 |
| Unidentified blue-green algae | 139 | 139 | 138 | 123 | 73 | 59 |
| Total | 7,004 | 6,580 | 5,366 | 4,673 | 3,372 | 1,597 |
Table 9. Numbers of planktons in fiberglass tank experiment before and after treated with formalin at the concentration of 25 ppm.
| Type of Plankton | No. of plankton (cell/liter) | |||||
| Before treatment | Treatment | |||||
| 0 | 6 | 30 | 54 | 78 hours | ||
| Coelastrum | 1,530 | 1,304 | 1,100 | 884 | 502 | 57 |
| Synedra | 1,415 | 1,228 | 810 | 774 | 522 | 274 |
| Dictyosphaerium | 1,282 | 1,030 | 663 | 584 | 256 | 57 |
| Anabaenopsis | 976 | 886 | 818 | 704 | 223 | 45 |
| Oocystis | 866 | 820 | 644 | 573 | 374 | 51 |
| Desmid | 534 | 491 | 264 | 241 | 112 | 58 |
| Scenedesmus | 81 | 74 | 53 | 38 | 18 | 7 |
| Pediastrum | 68 | 40 | 30 | 21 | 8 | 5 |
| Chroococcus | 68 | 44 | 43 | 42 | 39 | 2 |
| Staurastrum | 18 | 16 | 14 | 12 | 10 | 5 |
| Oedogonium | 26 | 16 | 10 | 8 | 4 | 2 |
| Keratella | 16 | 14 | 14 | 12 | 4 | 2 |
| Anabaena | 6 | 4 | 4 | 2 | 0 | 0 |
| Brachionus | 78 | 64 | 24 | 21 | 10 | 3 |
| Filinia | 10 | 8 | 6 | 6 | 2 | 1 |
| Nauplius | 17 | 4 | 4 | 2 | 1 | 0 |
| Copepod | 12 | 8 | 6 | 3 | 2 | 2 |
| Unidentified-green algae | 8 | 8 | 7 | 6 | 6 | 0 |
| Unidentified blue-green algae | 188 | 175 | 133 | 99 | 76 | 33 |
| Total | 7,199 | 6,234 | 4,647 | 4,032 | 2,169 | 604 |
Table 10. Numbers of plankton in fiberglass tank experiment before and after formalin treatment at the concentration of 50 ppm.
| Type of plankton | No. of plankton (cell/liter) | |||||
| Before treatment | Treatment | |||||
| 0 | 6 | 30 | 54 | 78 hours | ||
| Coelastrum | 1,362 | 1,180 | 1,020 | 418 | 214 | 51 |
| Synedra | 1,226 | 965 | 791 | 422 | 404 | 229 |
| Dictyosphaerium | 1,248 | 779 | 531 | 194 | 118 | 28 |
| Anabaenopsis | 994 | 809 | 757 | 340 | 108 | 43 |
| Oocystis | 858 | 642 | 502 | 243 | 193 | 44 |
| Desmid | 519 | 331 | 122 | 54 | 43 | 27 |
| Scenedesmus | 76 | 69 | 41 | 24 | 15 | 5 |
| Pediastrum | 58 | 51 | 38 | 38 | 8 | 8 |
| Chroococcus | 48 | 22 | 17 | 14 | 13 | 2 |
| Staurastrum | 23 | 16 | 8 | 5 | 3 | 3 |
| Oedogonium | 10 | 8 | 6 | 4 | 2 | 2 |
| Keratella | 16 | 14 | 12 | 2 | 2 | 1 |
| Anabaena | 8 | 2 | 2 | 1 | 1 | 0 |
| Brachionus | 50 | 48 | 37 | 14 | 8 | 3 |
| Filinia | 15 | 5 | 4 | 2 | 1 | 0 |
| Nauplius | 6 | 3 | 2 | 0 | 0 | 1 |
| Copepod | 6 | 6 | 4 | 2 | 2 | 1 |
| Unidentified-green algae | 11 | 8 | 6 | 2 | 1 | 0 |
| Unidentified blue-green algae | 163 | 142 | 73 | 56 | 54 | 17 |
| Total | 6,697 | 5,100 | 3,973 | 1,835 | 1,190 | 465 |
Table 11. Water turbidity in fiberglass tank experiment before and after formalin treatment at the concentration of 25 and 50 ppm.
| Formalin Concentration (ppm.) | Turbidity (cm.) | |||||
| Before treatment | Treatment | |||||
| 0 | 6 | 30 | 54 | 78 hours | ||
| Control | 33.0 | 33.0 | 34.0 | 33.0 | 28.4 | 25 |
| 25 | 34.0 | 34.5 | 36.5 | 43.0 | 49.3 | 47 |
| 50 | 34.5 | 35.0 | 40.5 | 53.5 | 54.5 | 58.5 |
