![]()
![]()
![]()
| TYPE OF CONTAINER | NUMBER OF CONTAINERS | AVERAGE NUMBER OF CRABS PER CONTAINER | TOTAL NO. OF CRABS PER CONTAINER TYPE | ||
| SMALL | MED | LARGE | |||
| CARTON | 149 | 27 | 20 | 15 | 2235 – 4023 |
| ‘HAND’ BAG | 42 | 22 | 15 | 10 | 420 – 924 |
| CHILLYBIN | 18 | 42 | 33 | 23 | 414 – 756 |
| SUITCASE | 3 | 60 | 45 | 33 | 99 – 180 |
| PLASTIC BAG | 1 | 15 | 12 | 8 | 8 – 15 |
| VEGETATION CATEGORY | LAND AREA | MEAN CPUE | CRAB POPULATION | ||
| Actual (ha) | % Total | Actual | % Total | ||
| Coastal Forest | 2999 | 11.5 | 0.378 | 137560 | 75.8 |
| Primary Forest (Coastal) | 1002 | 3.8 | 0.070 | 10820 | 6.0 |
| Primary Forest (Inland) | 2046 | 7.9 | 0.014 | 4910 | 2.7 |
| Light & Scattered (Coastal) | 5685 | 21.8 | 0.063 | 25840 | 14.2 |
| Light & Scattered (Inland) | 6406 | 24.6 | 0.004 | 2310 | 1.3 |
| Fernland Regions | 7915 | 30.4 | 0 | 0 | 0 |
| TOTAL | 26050 | 100 | NA | 181440 | 100 |
TABLE 3 Male and female morphometric data
| MEAN TL (MM) | MEAN WGHT (GM) | SAMPLE SIZE | NO. ON ISLAND | % TOTAL POPULATION | |
| MALES | 32.5 | 375 | 91 | 96160 | 53 |
| FEMALES | 26.9 | 180 | 123 | 85280 | 47 |
TABLE 4 Niue coconut crab size frequency data for females.
(Size class = 2mm thoracic length)
| SIZE CLASS (mm) | POPULATION | CUMULATIVE | ||
| % Total | Actual | Percent | Actual | |
| 16 – 18 | 2.68 | 2286 | 2.68 | 2286 |
| 18 – 20 | 0 | 0 | 2.68 | 2286 |
| 20 – 22 | 2.68 | 2286 | 5.36 | 4572 |
| 22 – 24 | 9.82 | 8375 | 15.18 | 12947 |
| 24 – 26 | 28.57 | 24363 | 43.75 | 37310 |
| 26 – 28 | 18.75 | 15990 | 62.50 | 53300 |
| 28 – 30 | 16.96 | 14463 | 79.46 | 67763 |
| 30 – 32 | 11.61 | 9901 | 91.07 | 77664 |
| 32 – 34 | 6.25 | 5330 | 97.32 | 82994 |
| 34 – 36 | 2.68 | 2286 | 100 | 85280 |
TABLE 5 Niue coconut crab size frequency data for males.
(Size class = 2mm thoracic length)
| SIZE CLASS (mm) | POPULATION | CUMULATIVE | ||
| % Total | Actual | Percent | Actual | |
| 12 – 14 | 0.67 | 644 | 0.67 | 644 |
| 14 – 16 | 0.67 | 644 | 1.34 | 1288 |
| 16 – 18 | 0.67 | 644 | 2.01 | 1932 |
| 18 – 20 | 0 | 0 | 2.01 | 1932 |
| 20 – 22 | 1.33 | 1279 | 3.34 | 3211 |
| 22 – 24 | 12.67 | 12184 | 16.01 | 15395 |
| 24 – 26 | 7.33 | 7049 | 23.34 | 22444 |
| 26 – 28 | 12.00 | 11539 | 35.34 | 33983 |
| 28 – 30 | 13.30 | 12789 | 48.64 | 46772 |
| 30 – 32 | 8.67 | 8337 | 57.31 | 55109 |
| 32 – 34 | 9.33 | 8972 | 66.64 | 64081 |
| 34 – 36 | 6.0 | 5770 | 72.64 | 69851 |
| 36 – 38 | 5.33 | 5125 | 77.97 | 74976 |
| 38 – 40 | 4.67 | 4491 | 82.64 | 79467 |
| 40 – 42 | 2.67 | 2568 | 85.31 | 82035 |
| 42 – 44 | 2.67 | 2567 | 87.98 | 84602 |
| 44 – 46 | 1.33 | 1278 | 89.31 | 85880 |
| 46 … 58 | 10.69 | 10280 | 100 | 96160 |
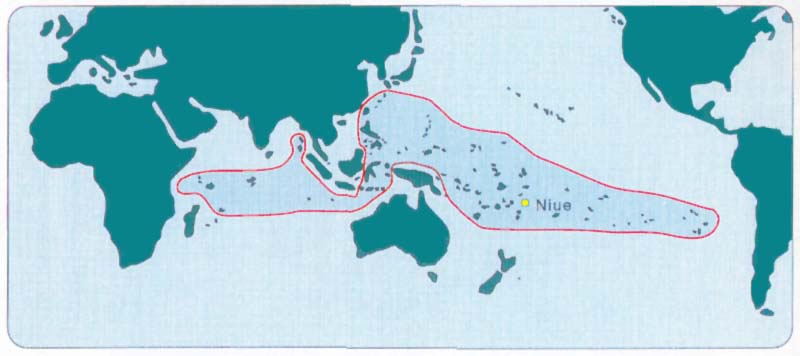
WORLD DISTRIBUTION OF THE COCONUT CRAB BIRGUS LATRO (L.) (BOUNDED AREA)
Map of Niue showing 5 major habitat categories based on vegetation type and distance from the coast.
(Coastal: < 2 km from coast; Inland: > 2 km from coast)
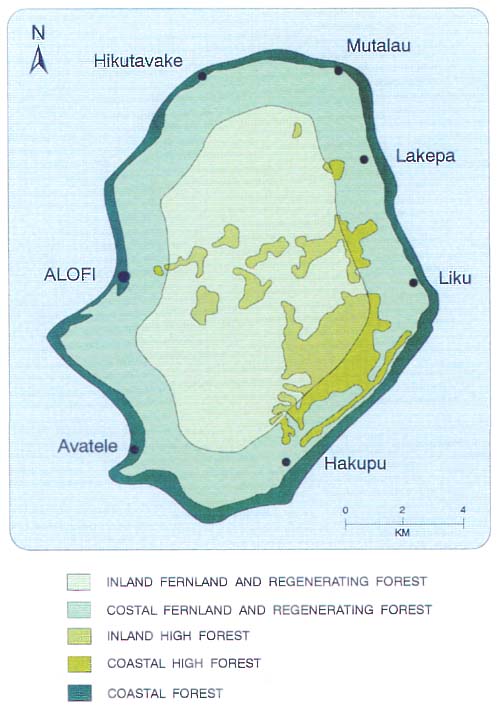
FIGURE 3 Position of population survey transects
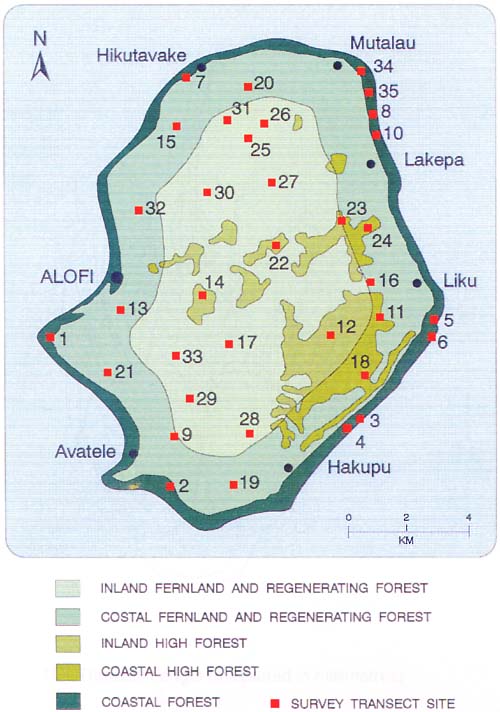
Figure 4 Coconut Crab indicating the position of the Thoracic Length (TL) measurement.
TL - Thoracic Length (measured in millimetres)
Figure 5 Size frequency distribution (1990) for A Male and B Female coconut crabs on Niue Island.
Figure 6 Size frequency distribution for female coconut crabs on Niue for A 1990 and B 1988.
A 1990
B 1988
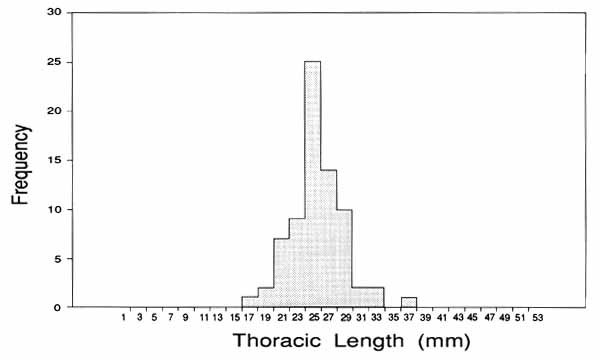
Figure 7 Size frequency distribution of female coconut crabs on Niue, Vanuatu and Christmas Island
Thoracic Length (mm)
Figure 8 Size frequency distribution of male coconut crabs on Niue, Vanuatu and Christmas Island
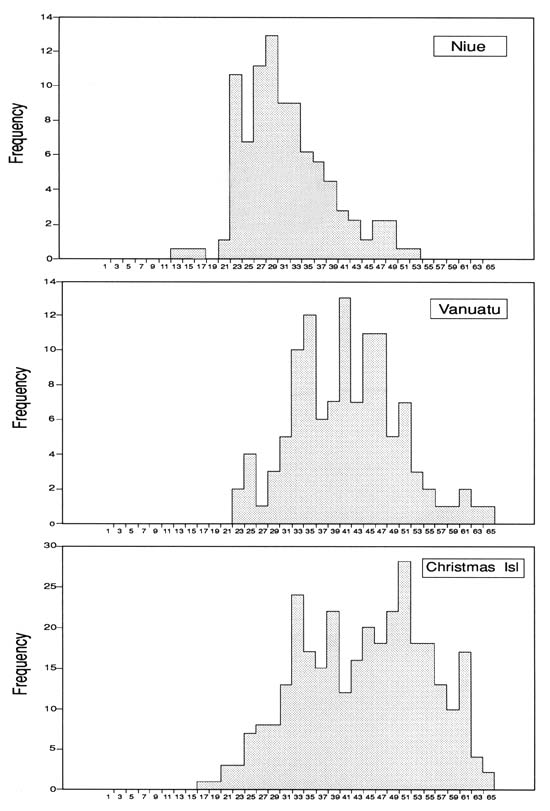
Thoracic Length (mm)
Von Bertalanffy growth curves for A Male and B Female coconut crabs showing the approximate age/size at which crabs become sexually mature
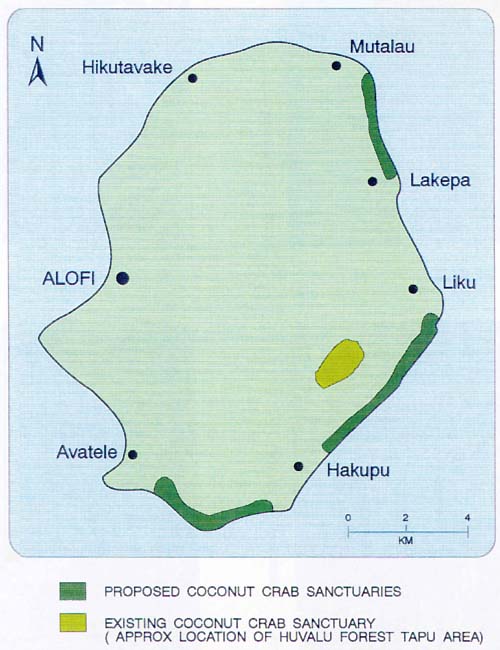
Location of Existing and Proposed Coconut Crab Sanctuaries
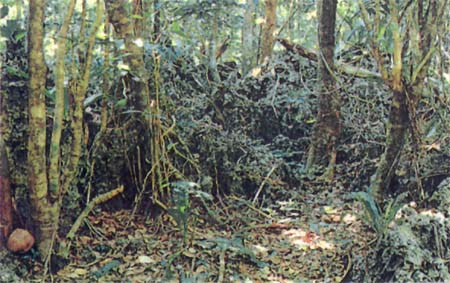
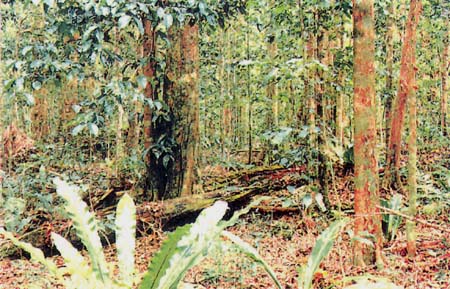
| Plate 1 Coastal Forest | Plate 2 High Forest |
 |  |
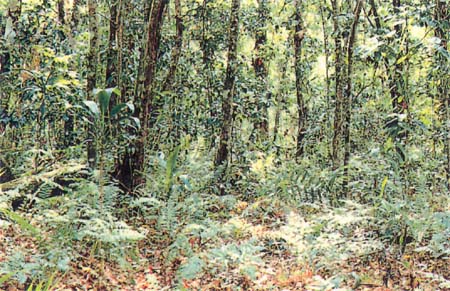
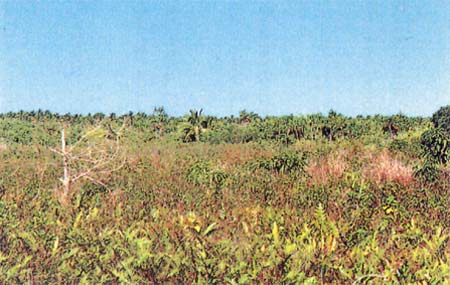
| Plate 3 Regenerating Forest | Plate 4 Fernland |
 |  |
![]()
![]()
![]()