![]()
![]()
![]()
3.1 FIELD STOCK SURVEY
A daily log of the survey is found in Appendix 3.
3.1.1 FAKAOFO ATOLL
Seventy tows in the lagoon, 2 tows on the ocean side of the atoll, and 3 reef flat transects were made at this atoll. Figure 2 is a xerographic-reduced aerial photographic map showing the tow numbers, tow length and direction of the tow (line and arrowhead, respectively), transects, sites where dives were made and other relevant information to this survey.
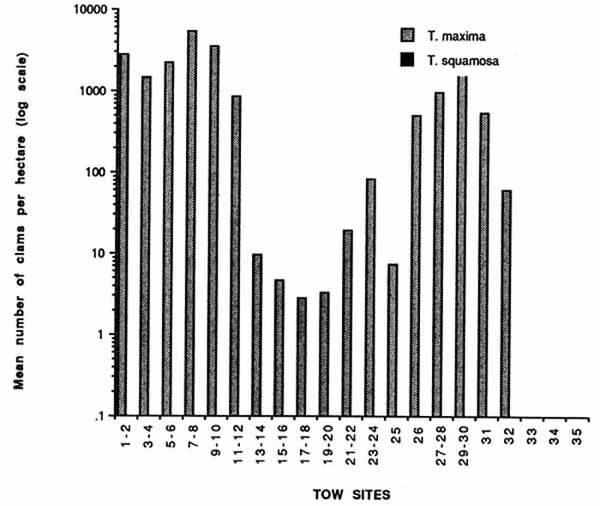
The clam abundance (mean number of clams per hectare) at the tow sites in Fakaofo are shown in Fig. 3. The abundance of T. maxima (fahua nao) varied greatly with highest densities (4000-28,116 Tm/ha) found in the N-NW, S-SE sections of the lagoon. These areas had a greater complex of coral patch reefs, bommies, pinnacles, etc. associated with them than low abundance (<50 Tm/ha) areas on the E-NE & W sides of the lagoon. The abundance of T. squamosa (fahua taka) is seriously low (<6 Ts/ha) and they were found in only 17.1% of the tows. Tow numbers are combined where replicate tows were made, single where a single tow represented the area or combined for patch reefs in the lagoon which showed similar densities of clams (Fig. 3 and Table 1). Appendix 4 lists field survey tow records by individual tows. The tow depth range, substratum description (% coral cover, % live coral), tow distance, area of tow and clam counts are listed in the appendix. Table 2 shows densities of T. maxima found at each of the 3 transect sites on the Fakaofo reef flats.
An estimate of the stocks of T. maxima and T. squamosa in Fakaofo Atoll are found in Table 1. A more accurate picture of the distribution of clams in the lagoon can be seen by looking at small sections of the lagoon and central patch reefs (see also the map of Fakoaofo, Fig. 2). These estimates are summed at the end of Table 1 to show total population estimates for the ‘lagoon only’ of 1,488,313 T. maxima and 695 T. squamosa. The population estimates for the lagoon + reef flat are 1,809,294 ± 270,242 T. maxima and 695 T. squamosa.
FIGURE 2:
Xerographic-reduced aerial photographic map of Fakaofo Atoll. The arrows with numbers adjacent to them indicate the length and direction of the tow and the tow number. Suggested Reserve sites, dive sites, and reef flat transects are shown on the map.
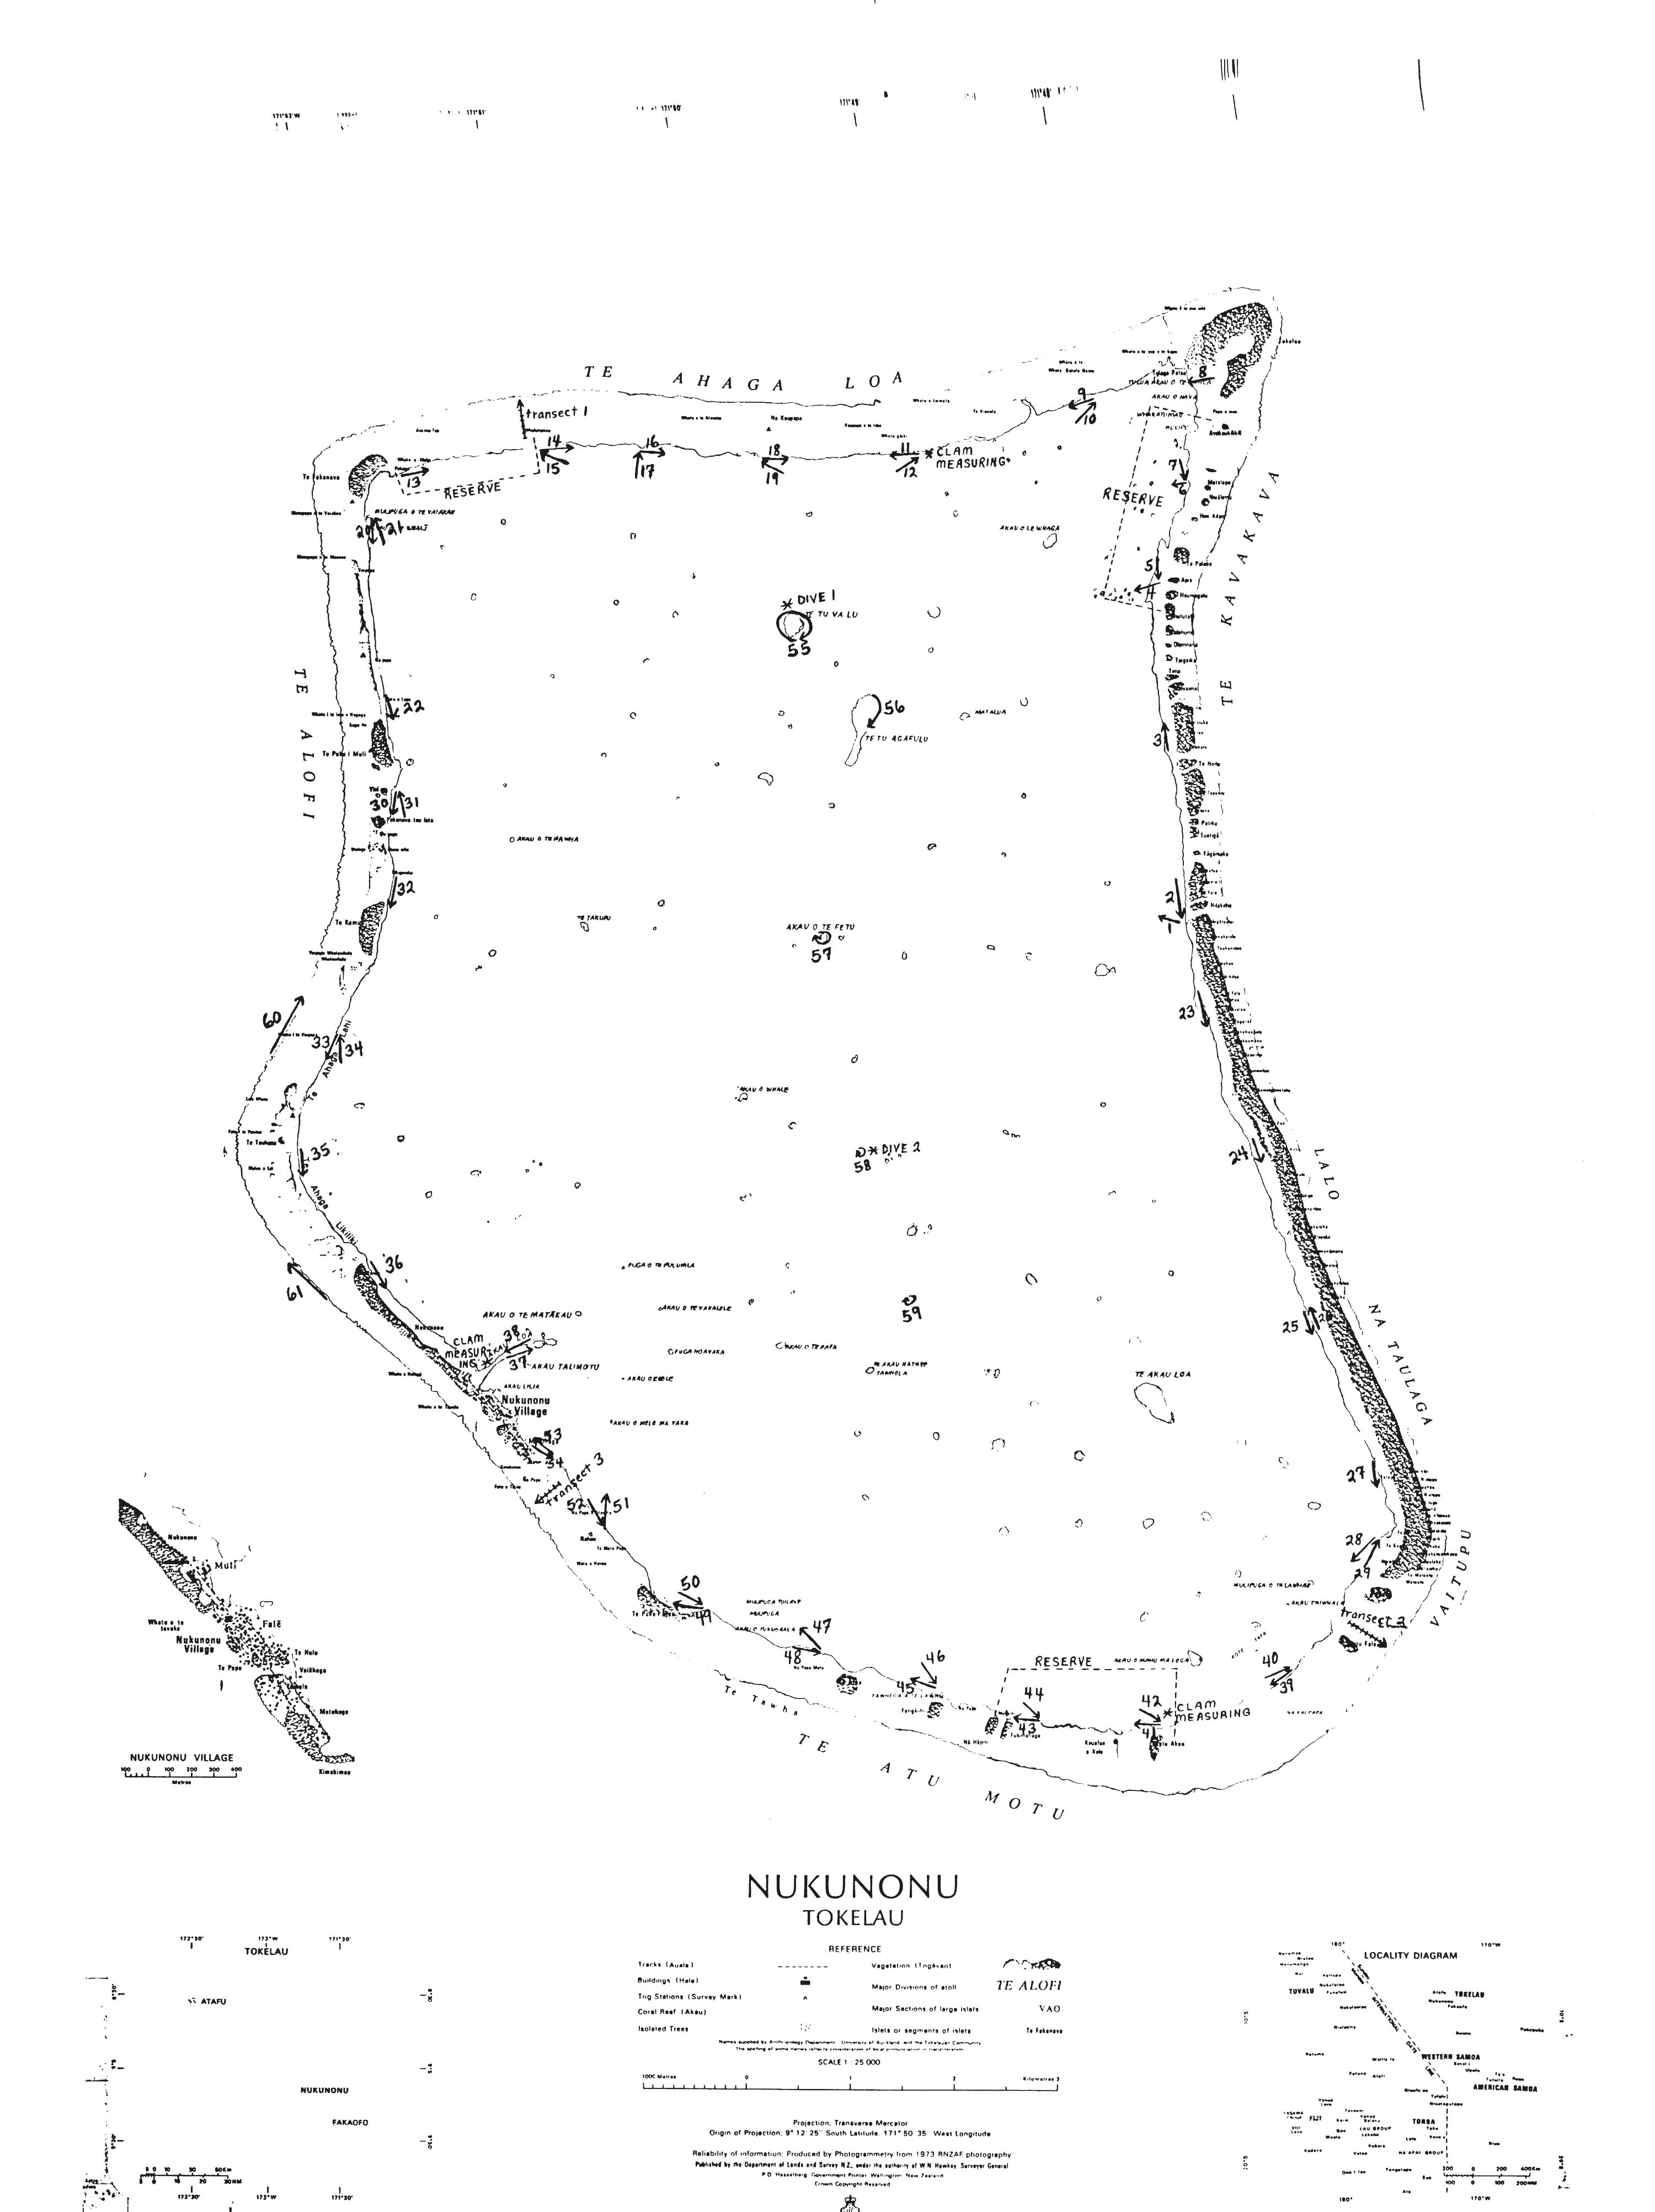
FIGURE 3:
Clam abundance at tow sites, Fakaofo Atoll. Abundance is in mean number of clams per hectare. The Y-axis is in log scale.
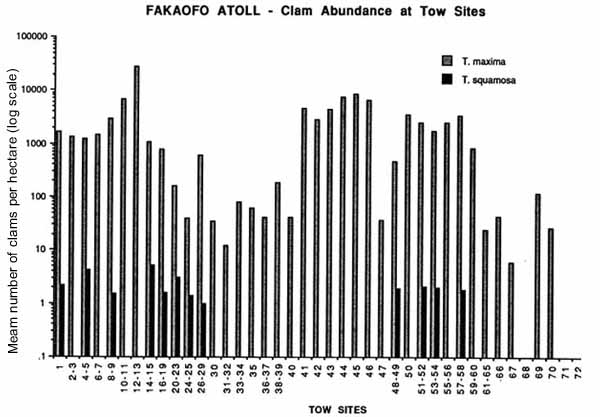
TABLE 1:
Fakaofo Atoll, area of tows and stock estimate of clams on
reef areas adjacent to tows. Tm (T. maxima), Ts (T.
squamosa).
| Tow no(s). | Area (ha) covered by tow(s) | Estimate of adjacent reef area similar to tow site (ha) | Estimated total numbers of clams present [Tm, Ts] |
| 1 | 0.45 | 12.5 | 20,575 Tm 27 Ts |
| 2–3 | 0.84 | 14.0 | 19,180 Tm |
| 4–5 | 0.93 | 29.6 | 36,881 Tm 127 Ts |
| 6–7 | 0.94 | 23.4 | 34,585 Tm |
| 8–9 | 0.66 | 31.2 | 94,286 Tm 47 Ts |
| 10–11 | 0.45 | 31.2 | 210,010 Tm |
| 12–13 | 0.18 | 12.5 | 351,458 Tm |
| 14–15 | 0.96 | 14.0 | 15,120 Tm 73 Ts |
| 16–19 | 1.90 | 29.6 | 23,664 Tm 47 Ts |
| 20–23 | 1.60 | 34.3 | 5,453 Tm 107 Ts |
| 24–25 | 0.73 | 31.2 | 1,248 Tm 43 Ts |
| 26–29 | 1.00 | 43.7 | 26,001 Tm 44 Ts |
| 30 | 0.20 | 15.6 | 546 Tm |
| 31–32 | 0.50 | 23.4 | 281 Tm |
| 33–34 | 0.46 | 28.1 | 2,260 Tm |
| 35 | 0.11 | 9.4 | 577 Tm |
| 36–37 | 0.27 | 15.6 | 636 Tm |
| 38–39 | 0.27 | 14.0 | 2,644 Tm |
| 40 | 0.32 | 3.9 | 158 Tm |
| 41 | 0.25 | 4.7 | 21,752 Tm |
| 42 | 0.22 | 9.4 | 26,704 Tm |
| 43 | 0.29 | 7.8 | 33,943 Tm |
| 44 | 0.27 | 15.6 | 113,880 Tm |
| 45 | 0.27 | 6.2 | 53,963 Tm |
| 46 | 0.30 | 8.6 | 55,023 Tm |
| 47 | 0.27 | 9.4 | 346 Tm |
| 48–49 | 0.53 | 26.5 | 12,358 Tm 50 Ts |
| 50 | 0.25 | 21.8 | 75,915 Tm |
| 51–52 | 0.47 | 21.0 | 52,008 Tm 45 Ts |
| 53–54 | 0.50 | 23.4 | 41,230 Tm 47 Ts |
| 55–56 | 0.53 | 24.9 | 62,390 Tm |
| 57–58 | 0.54 | 21.0 | 70,867 Tm 38 Ts |
| 59–60 | 0.53 | 20.3 | 16,630 Tm |
| 61–65 | 2.04 | 156.0 | 3,900 Tm |
| 66 | 0.27 | 9.4 | 412 Tm |
| 67 | 0.49 | 6.2 | 38 Tm |
| 68 | 0.32 | 7.8 | 0 Tm |
| 69 | 0.16 | 6.2 | 736 Tm |
| 70 | 0.19 | 24.9 | 655 Tm |
| Reef Flat | |||
| Estimates | 0.63 | 970.0 | 320,876 ± |
| (n=3) | 270,242 Tm | ||
| Total Estimates: | |||
Lagoon only | 848.3 | 1,488,313 Tm | |
695 Ts | |||
| Lagoon + Reef Flat | 1,818.3 | 1,809,189 ± | |
270,242 Tm | |||
695 Ts | |||
The overall density of T. maxima in suitable lagoon areas is 1745 Tm/ha and 0.82 Ts/ha. When the reef flat area is also included for T. maxima (no Ts found on the reef flat) the density drops to 995 Tm/ha. The suitable area estimated in the lagoon was 848ha; this is 46.6% of the combined lagoon + reef flat areas. These stock estimates cover only the lagoon to depths of about 12–15m and the reef flat. They do not cover the deeper lagoon (which may have T. squamosa to about 20m if the water is usually clear) nor the ocean side of the atoll reef. Two separate ocean tows were made to look for clams (see Appendix 4) but none were encountered.
Tridacna maxima and T. squamosa made up 99.95% and 0.05% of the ‘lagoon only’ population. Since no T. squamosa were found on the reef flat it is not necessary to compare the percentages for the combined area.
There is a high percentage of dead coral in the lagoon. The mean live coral at all tow sites was 30 ± 18.8% and the mean coral cover (vs. sand) was 39 ± 22.3%. In comparison, the two ocean tows had 70% live coral and 100% cover.
3.1.2 NUKUNONU ATOLL
Fifty-nine tows in the lagoon, 2 tows on the ocean side of the atoll, and 3 reef flat transects were made at this atoll. Figure 4 is a xerographic-reduced aerial photographic map showing the tow numbers, tow length and direction of the tow (line and arrowhead, respectively), transects, sites where dives were made and other relevant information to this survey.
FIGURE 4:
Xerographic-reduced aerial photographic map of Nukunonu Atoll. The arrows with numbers adjacent to them indicate the length and direction of the tow and the tow number. Suggested Reserve sites, dive sites, and reef flat transects are shown on the map.

The clam abundance at the tow sites in Nukunonu are shown in Fig. 5. The abundance of T. maxima varied between sites to a greater degree than at Fakaofo. The highest densities were up to 26,400 Tm/ha found along the N-NE and S-SE portions of the lagoon. As noted for Fakaofo, there was a greater complex of coral patch reefs, bommies, and pinnacles generally than in the lower abundance (<50 Tm/ha) areas on the E and W-SW sides of the lagoon. Again, the abundance of T. squamosa is critically low (<4 Ts/ha) and they were found in only 6.8% of the tows. As in Fakaofo, tow numbers are combined where replicate tows were made, single where a single tow represented the area or combined for patch reefs in the lagoon which showed similar densities of clams (Fig. 5 and Table 3). Appendix 4 lists the field survey tow records by individual tows. Table 2 shows densities of T. maxima at the 3 transect sites on the reef flats of Nukunonu.
An additional method used to assess clam numbers at tow sites 14–19 is described at the end of Table 3. Basically, this method was used to compare with the counts obtained by one of the divers. The number of bommies counted by this diver was dependent upon his sweep of view and although we attempted to count bommies within 7m of the boat keel it may have included a larger area at times. The results showed a discrepancy between numbers counted by one diver and those estimated by the bommie counting method (mean 182 ± 140% higher for the bommie counting method when tow 14 was excluded [it was 8.2% lower for the bommie counting method]). Direct counts as we have adopted for the survey appear to be more consistent, even though high density of clams in some areas makes direct counts difficult.
FIGURE 5:
Clam abundance at tow sites, Nukunonu Atoll. Abundance is in mean number of clams per hectare. The Y-axis is in log scale.
NUKUNONU ATOLL - Clam Abundance at Tow Sites
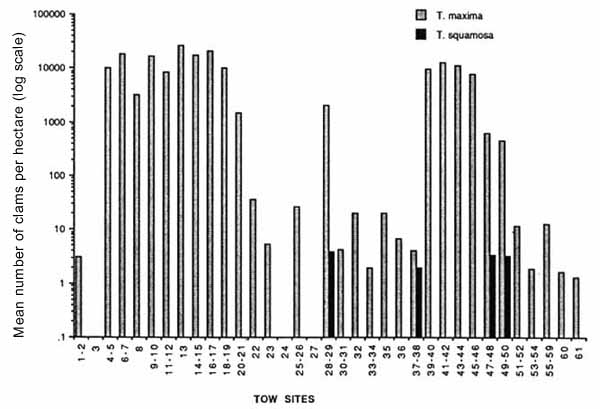
TABLE 2:
Reef flat transects; summary of results at three Tokelau
atolls for abundance of Tridacna maxima (clams/ha).
| Atoll | Transect | Transect | Transect | Mean±s.d. |
| 1 | 2 | 3 | ||
| Fakaofo | 9.5 | 505.0 | 478.0 | 330.8±278.6 |
| Nukunonu | 167.0 | 168.0 | 567.0 | 300.7±230.6 |
| Atafu | 16.7 | 66.7 | 41.7±35.4 | |
TABLE 3:
Nukunonu Atoll, area of tows and stock estimate of clams on
reef areas adjacent to tows. Tm (T. maxima), Ts (T.
squamosa). *See special additional estimate tried in these
high density areas; the area covered here was by one diver
only, the other diver made counts of number of bommies of
various sizes (see bottom of this Table and Tow Records in
Appendix 4).
| Tow no(s). | Area (ha) covered by tow(s) | Estimate of adjacent reef area similar to tow site (ha) | Estimated total numbers of clams present [Tm, Ts] |
| 1–2 | 0.64 | 18.7 | 58 Tm |
| 3 | 0.21 | 24.2 | 0 Tm |
| 4–5 | 0.36 | 53.0 | 546,736 Tm |
| 6–7 | 0.17 | 39.0 | 725,635 Tm |
| 8 | 0.21 | 23.4 | 76,097 Tm |
| 9–10 | 0.28 | 48.4 | 805,000 Tm |
| 11–12 | 0.37 | 37.4 | 313,672 Tm |
| 13 | 0.11 | 20.2 | 535,392 Tm |
| 14–15* | 0.13 | 26.5 | 475,927 Tm |
| 16–17* | 0.10 | 28.1 | 603,720 Tm |
| 18–19* | 0.13 | 27.3 | 280,152 Tm |
| 20–21 | 0.42 | 17.2 | 25,036 Tm |
| 22 | 0.39 | 15.6 | 562 Tm |
| 23 | 0.38 | 18.7 | 99 Tm |
| 24 | 0.26 | 20.3 | 0 Tm |
| 25–26 | 0.49 | 21.8 | 579 Tm |
| 27 | 0.25 | 14.0 | 0 Tm |
| 28–29 | 0.53 | 23.4 | 48,789 Tm 89 Ts |
| 30–31 | 0.47 | 10.9 | 46 Tm |
| 32 | 0.30 | 17.2 | 343 Tm |
| 33–34 | 0.50 | 18.7 | 37 Tm |
| 35 | 0.25 | 15.6 | 312 Tm 62 Ts |
| 36 | 0.30 | 21.8 | 146 Tm |
| 37–38 | 0.50 | 20.3 | 81 Tm 40 Ts |
| 39–40 | 0.50 | 31.2 | 305,011 Tm |
| 41–42 | 0.38 | 31.2 | 397,301 Tm |
| 43–44 | 0.40 | 23.4 | 263,016 Tm |
| 45–46 | 0.44 | 31.2 | 235,560 Tm |
| 47–48 | 0.87 | 24.9 | 15,338 Tm 85 Ts |
| 49–50 | 0.60 | 21.0 | 9,582 Tm 69 Ts |
| 51–52 | 0.70 | 15.6 | 178 Tm |
| 53–54 | 0.53 | 14.0 | 27 Tm |
| 55–59 | 2.85 | 57.8 | 43,037 Tm |
| Reef Flat | |||
| Estimates | 0.61 | 1179.0 | 354,525 ± |
| (n=3) | 271,877 Tm | ||
| Total Estimates: | |||
Lagoon only | 832.0 | 5,707,468 Tm | |
345 Ts | |||
Lagoon + Reef Flat | 2,011.0 | 6,061,993 ± | |
271,877 Tm | |||
345 Ts | |||
| Tow # | Small (s), Medium (m), Large (l) bommies | Aver. # clams [area covered by diver counting bommies (ha)] | # clams if area adjusted to other diver counts |
| 14 | s-17; m-12; 1–3 | 4,588 clams [0.24ha] | 1,338 clams [0.07ha] |
| 15 | s-29; m-32; 1–5 | 10,126 clams [0.21ha] | 2,893 clams [0.06ha] |
| 16 | s-23; m-18; 1–9 | 9,010 clams [0.17ha] | 2,650 clams [0.05ha] |
| 17 | s-18; m-11; 1–5 | 5,416 clams [0.19ha] | 1,425 clams [0.05ha] |
| 18 | s-18; m-12; 1–5 | 5,620 clams [0.18ha] | 1,561 clams [0.05ha] |
| 19 | s-89; m-9; 1–3 | 6,841 clams [0.19ha] | 2,880 clams [0.08ha] |
An estimate of the stocks of T. maxima and T. squamosa in Nukunonu Atoll are found in Table 3. The ocean tows are not included in the stock estimate but their results can be seen in Appendix 4. The estimates do include those for the reef flat separately, and combined with the lagoon area estimates. The total population estimates for the ‘lagoon only’ are 5,707,468 T. maxima and 345 T. squamosa. The estimates for the combined lagoon + reef flat are 6,062,210 ± 271,877 T. maxima and 345 T. squamosa (see Table 3).
The overall density of T. maxima in suitable lagoon areas is 6860 Tm/ha and 0.41 Ts/ha. When the reef flat area is also included for T. maxima only, the density is reduced to 3014 Tm/ha. The suitable area estimated in the lagoon was 832ha; this is 41.4% of the combined lagoon + reef flat areas.
Tridacna maxima and T. squamosa made up 99.99% and 0.01% of the ‘lagoon only’ populations.
The mean live coral at all tow sites was 12.8 ± 11.3% and the mean coral cover (vs. sand) was 22.1 ± 20.6%. Generally, the highest percentage of live coral was associated with higher density clam areas. The 2 ocean tows had 85–90% live coral and 100% cover.
3.1.3 ATAFU ATOLL
Thirty-three tows in the lagoon, 2 tows on the ocean side of the atoll, and 2 reef flat transects were made at this atoll. Figure 6 is a xerographic-reduced aerial photographic map showing the tow numbers, tow length and direction of the tow (line and arrowhead, respectively), transects, sites where dives were made and other relevant information to this survey.
The clam abundance at the tow sites in Atafu are shown in Fig. 7. The abundance of T. maxima varied between sites. The highest densities were up to 5430 Tm/ha found in the S-SE and S-central patch reefs in the lagoon. The lower abundance (<50 Tm/ha) areas here were on the N, W, and NE sides of the lagoon. Here, the situation for the T. squamosa population is dire indeed; none were found throughout the survey.
FIGURE 6:
Xerographic-reduced photographic map of Atafu Atoll. The arrows with numbers adjacent to them indicate the length and direction of the tow and the tow number. Suggested Reserve sites, dive site, and reef flat transects are shown on the map.
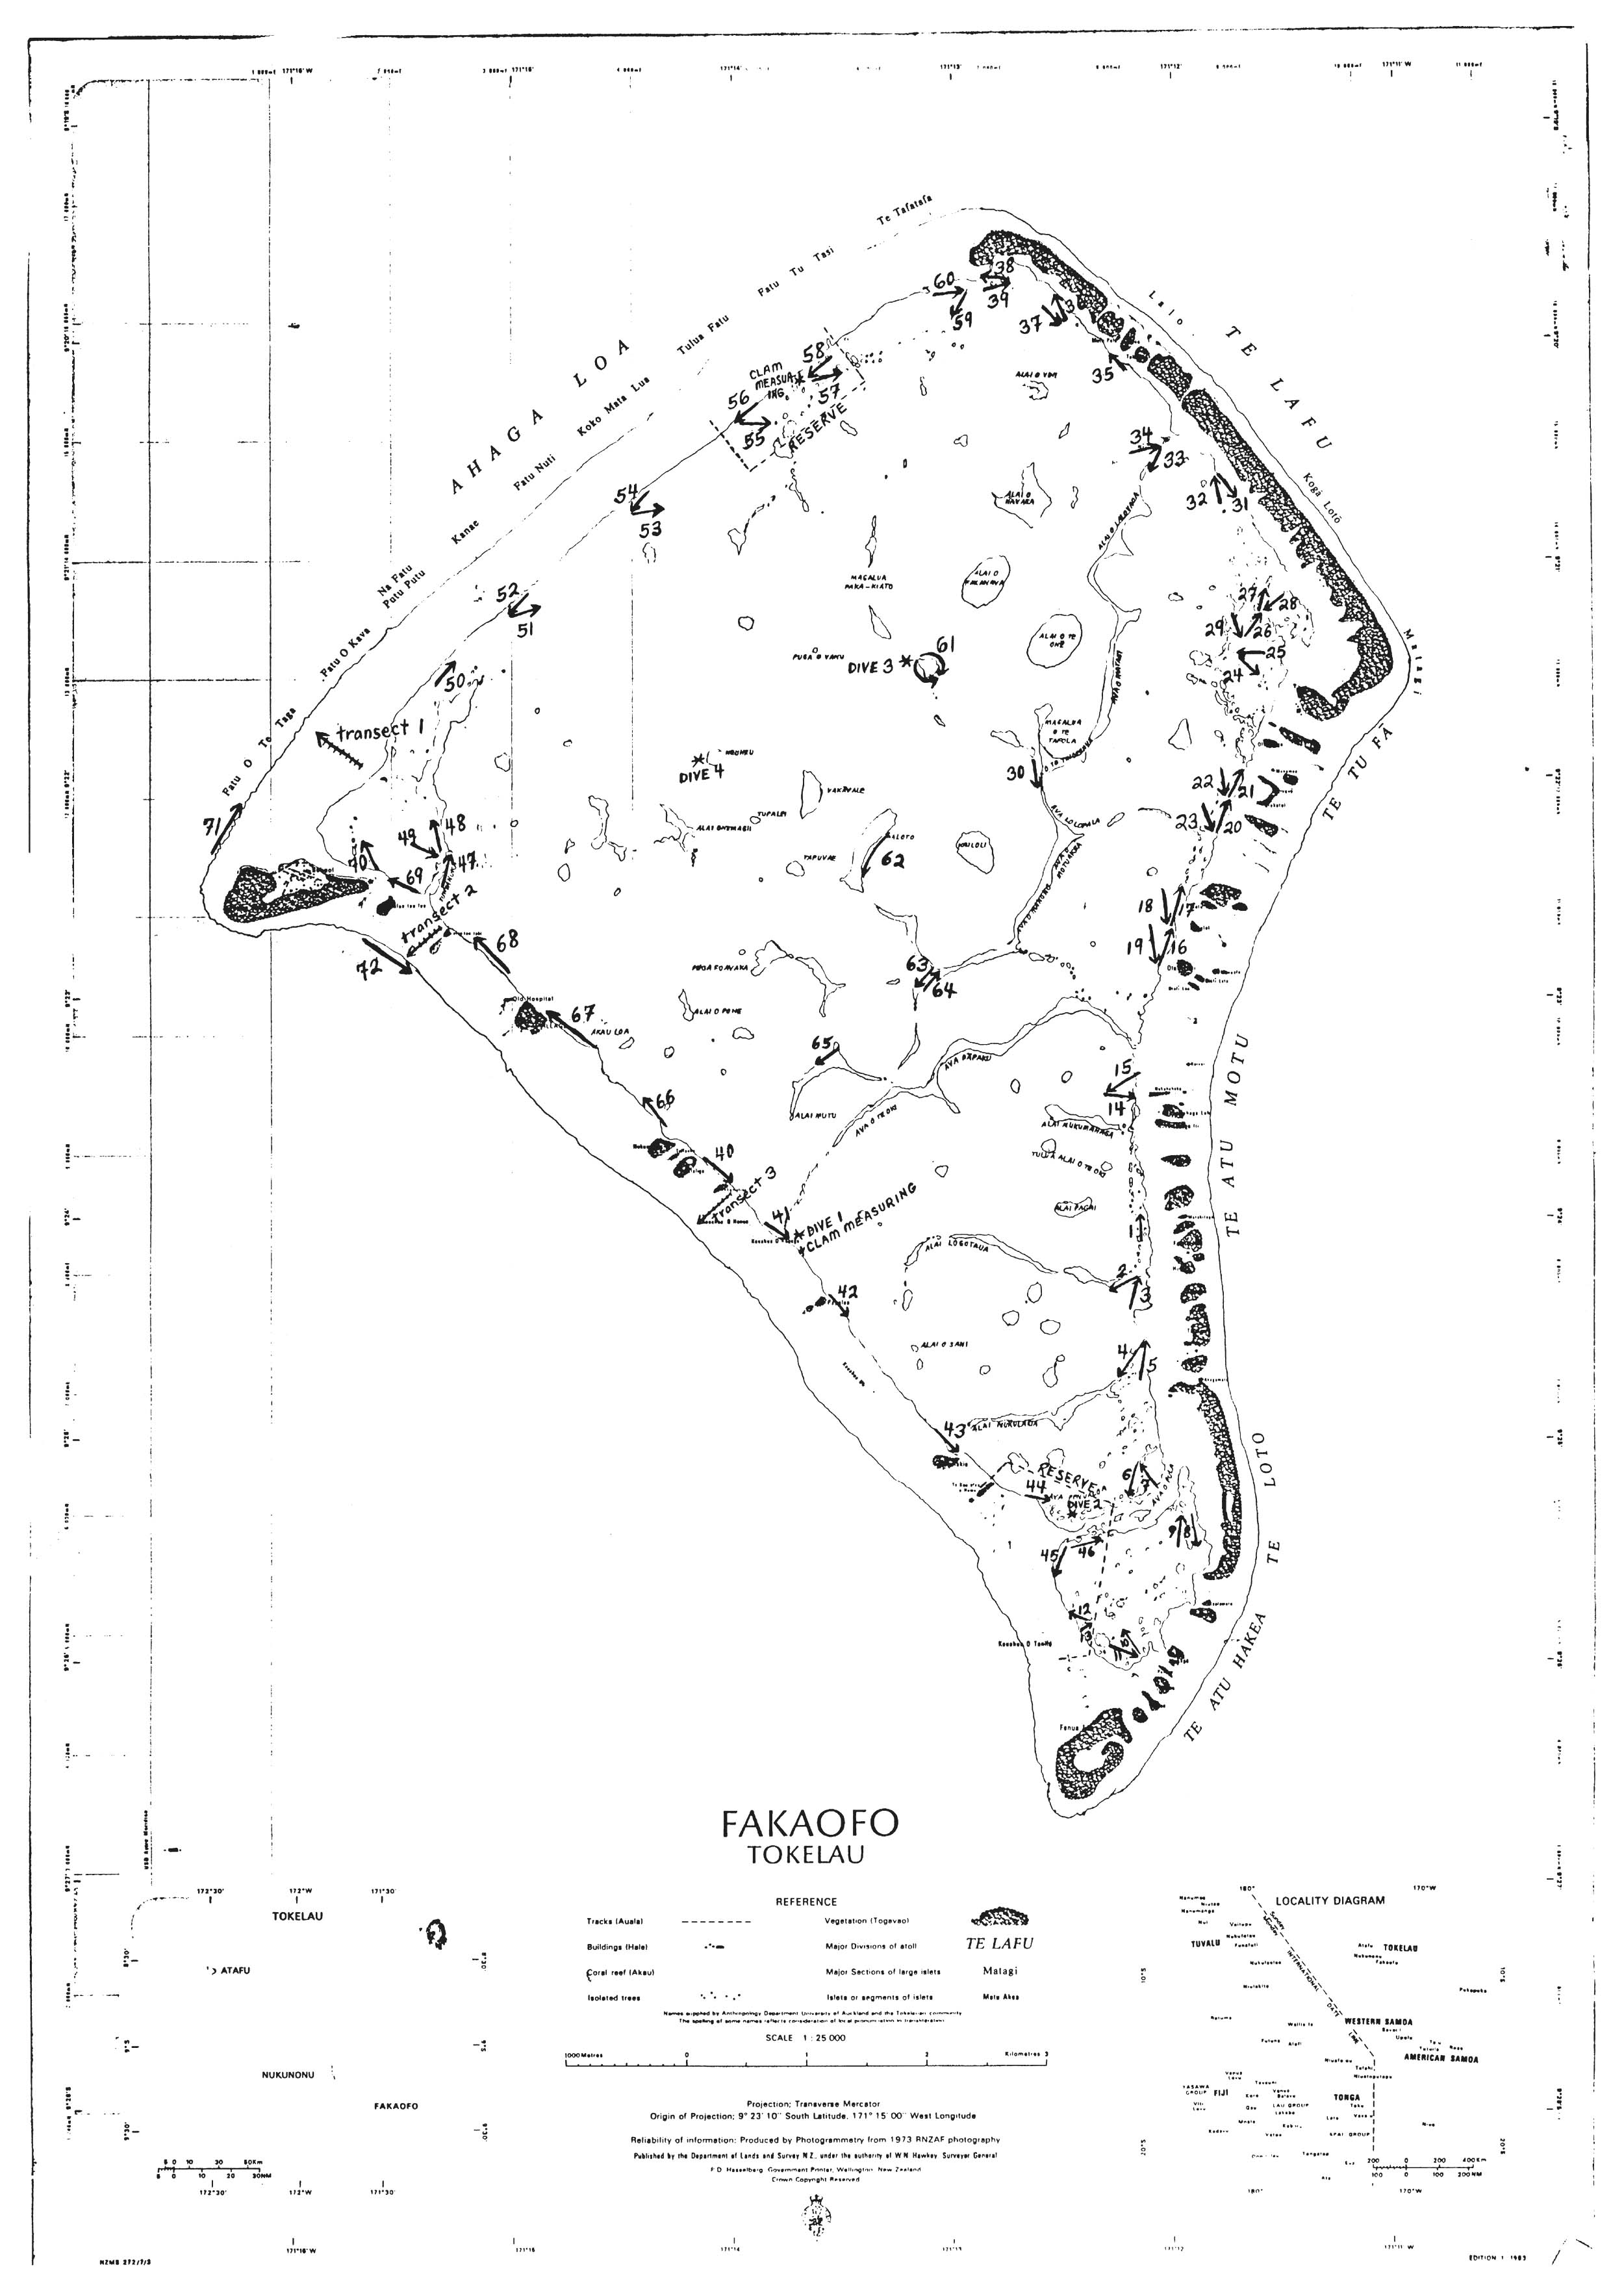
FIGURE 7:
Clam abundance at tow sites, Atafu Atoll. Abundance is in mean
number of clams per hectare. The Y-axis is in log scale.
ATAFU ATOLL - Clam Abundance at Tow Sites
The results of the tows are shown both in Fig. 7 and in Table 4. As at Fakaofo and Nukunonu, tow numbers are combined where there were replicate tows and single for single tows. Here, however, the patch reefs tows have been kept separate rather than combined as was done at the other two atolls because there was a direct relationship between density of clams and distance from the village on these patch reefs. Appendix 4 lists the field survey tow records by individual tows. Table 2 shows the densities of T. maxima at the 2 reef flat transect sites on Atafu.
An estimate of the stock of T. maxima in Atafu Atoll is found in Table 4. The ocean tows are not included in the stock estimates but no clams were encountered (see Appendix 4). The estimates do include those for the reef flat separately, and combined with the lagoon area estimate. The total population estimate for the ‘lagoon only’ is 360,095 T. maxima. The estimate for the lagoon + reef flat is 384,034 ± 20,320 T. maxima (see Table 4).
The overall density of T. maxima in suitable lagoon areas is 841 Tm/ha. When the reef flat area is also included the density is reduced to 383 Tm/ha. The suitable area estimated in the lagoon was 428ha; this is 42.7% of the combined lagoon + reef flat areas.
The mean live coral at all tow sites was 6.6 ± 7.2% and the mean coral cover (vs. sand) was 9.7 ± 11.2%. At the 2 ocean tow sites the live coral varied in shallow water (<8m) from 5–10% to the shelf/dropoff area with 60% live coral. The coral cover (vs. sand) was 100% on the ocean side.
TABLE 4:
Atafu Atoll, area of tows and stock estimate of clams on
reef areas adjacent to tows. Tm (T. maxima); note that no
T. squamosa were found in surveyed areas.
| Tow no(s). | Area (ha) covered by tow(s) | Estimate of adjacent reef area similar to tow site (ha) | Estimated total numbers of clams present [Tm,Ts] |
| 1–2 | 0.36 | 21.8 | 61,807 Tm |
| 3–4 | 0.59 | 18.7 | 27,181 Tm |
| 5–6 | 1.05 | 18.7 | 41,514 Tm |
| 7–8 | 0.47 | 17.2 | 93,174 Tm |
| 9–10 | 0.44 | 18.7 | 45,453 Tm |
| 11–12 | 0.56 | 45.2 | 39,268 Tm |
| 13–14 | 0.84 | 27.3 | 259 Tm |
| 15–16 | 0.84 | 50.0 | 235 Tm |
| 17–18 | 0.36 | 45.2 | 127 Tm |
| 19–20 | 0.30 | 26.5 | 88 Tm |
| 21–22 | 0.36 | 20.3 | 393 Tm |
| 23–24 | 0.48 | 26.5 | 2,153 Tm |
| 25 | 0.27 | 12.5 | 92 Tm |
| 26 | 0.31 | 14.0 | 7,062 Tm |
| 27–28 | 0.57 | 11.7 | 11,150 Tm |
| 29–30 | 0.41 | 6.2 | 20,074 Tm |
| 31 | 0.25 | 17.2 | 9,129 Tm |
| 32 | 0.25 | 15.6 | 936 Tm |
| 33 | 0.17 | 15.6 | 0 Tm |
| Reef Flat | |||
| Estimate | 0.33 | 574.0 | 23,935 ± |
20,320 Tm | |||
| Total Estimate: | |||
Lagoon only | 428.0 | 360,095 Tm | |
Lagoon + Reef Flat | 1,003.0 | 384,030 ± | |
20,320 Tm | |||
3.2 FIELD MEASUREMENT OF CLAMS
The size-frequency histograms of T. maxima in Fakaofo lagoon compare the population in the south-east and north sides of the lagoon (Fig. 8; refer to Fakaofo map, Fig. 2). The mean size of clams are significantly different (t-test, unequal sample size, p<0.01) between the two sites, with the smaller clams found in the south-east portion of Fakaofo lagoon.
In Nukunonu lagoon the size-frequency histograms of T. maxima compare the population at the northern and southern ends of the lagoon, remote from the village, with Akau Loa directly in front of the village (Fig. 9; refer to Nukunonu map, Fig. 4). The mean size of the north and south sites was significantly different (t-test, equal sample size, p<0.01) with the smaller clams in the northern end of the lagoon. The mean size of the Akau Loa sites was highly significantly different (t-test, equal sample size, p<0.001; smaller) than the south and the north sites.
In Atafu lagoon the size-frequency histograms of T. maxima compare the population in the south and eastern sides of the lagoon (Fig. 10; refer to Atafu map, Fig. 6). The mean size of clams are not significantly different (t-test, equal sample size, p<0.05 [p<0.4]).
3.3 VILLAGE QUESTIONAIRE SURVEY
A summary of the answers to the questions are coded in Appendix 5 (refer to the questions in Appendix 2). The results will be discussed for each atoll.
3.3.1 FAKAOFO ATOLL
The average consumption rate of clams (question 1) for the whole population is 1–2×/month. Young men (but not young women) eat clams more often than this on average. All of the men from all age groups collect clam themselves (question 2) except 14% of the old men which have the family collect them. About 60% of the women overall collect clams themselves while 40% have their families collect. The clams being collected range in size from 4–20cm for T. maxima with the average size being about 8–10 cm (question 3). The older women seemed to eat the smallest-sized clams of all groups. Occasionally T. squamosa larger than 25cm were collected by young and middle age people.
FIGURE 8:
Size-frequency histograms of Tridacna maxima at two reef areas in Fakaofo Atoll lagoon. The mean size ± standard deviation are shown for the population at each reef area.
FIGURE 9:
Size-frequency histograms of Tridacna maxima at three reef areas in Nukunonu Atoll lagoon. The mean size ± standard deviation are shown for the population at each reef area.
FIGURE 10:
Size-frequency histograms of Tridacna maxima at two reef areas in Atafu Atoll lagoon. The mean size ± standard deviation are shown for the population at each reef area.
Responding to question 4a, 60%, 80% and 86% of young, middle and old age men believed clams were becoming scarcer. The remaining percentages believed that either clam stocks could not be depleted or there was no change from the past. Young, middle and old age women reponded that clams were becoming scarcer with 100%, 86% and 40%, respectively. Sixty percent of the old women and 15% of middle age women indicated that clam stocks could not be depleted or that there is no change from the past. In question 4b, men responded with 40% (young), 66% (middle) and 85% (old) indicating that there were more clams in the past than today, there was a higher use today by people, or clams were larger in the past. Younger men also answered that there was no change (20%) and all age groups of men had responses saying they did not know (40%-young, 33%-middle, 28%-old). Responses of the women were: young (100%), middle (86%), old (60%) saying that there were more clams in the past, a higher use today, or diving was necessary today to collect clams. Old women also indicated there was no change or it was easier today to collect clams (40%).
On question 5 all men and women had seen the two species present in Tokelau but only 14% of middle-aged women and 33% of old men had also seen dead shells of larger species outside of Tokelau. Many people expressed disbelief that there are species of clam other than those present in Tokelau, and especially at the size of T. gigas.
On question 6, the response of men and women was that there were no traditional taboos or customary laws regarding the taking or use of giant clams. Less than half of the men or women in each age group mentioned that they knew of the Council of Elders' restriction on the collection of clams purely for export (to Samoa).
Eighty percent, 60% and 100% of young, middle and old age men believed there should be some restrictions on fishing clams (question 7a). Young (50%), middle (28%), and old (20%) age women also believed there should be fishing restrictions. The others disagreed with restrictions. In response to question 7b, young (20%), middle (40%) and old (28%) age men said there was a relationship between reduction of adult clam stocks on the reef and the number of clams on the reef in the future; they saw a reduction of numbers of clams in the future. Young (25%), middle (14%), and old (0%) age women saw the same relationship. A response saying there would be an increase of numbers in the future was answered by 20% (young), 20% (middle), and 28% (old) age men and by 0% (young), 57% (middle) and 40% (old) age women. This response comes from a belief that when the clam is cut out of the shell with a small knife, some of its eggs are spread in the water which helps the reproduction of the clams… therefore, it is good to fish for clams to “help” the clams reproduce better. Other responses were that they saw a relationship but could not answer for the future or that there was no relationship.
Forty percent (young), 80% (middle), 71% (old) of the men and 100% (young), 57% (middle), and 20% (old) of the women answered question 8 by saying the people would accept restrictions on fishing made by the Council. Some men and women said they would not accept the restrictions of that some people would accept them but others would poach clams from a restricted area of take more than they were alloted.
Question 9 was answered with nearly 100% men and women in favour of the government starting experiments on culturing of clams (only 1 middle age women was not in favour). More than 70% of all age groups of men and women believed that experimental cages and juvenile clams would be safe, but usually if the Council of Elders were involved and/or there were a fisheries caretaker to watch it. Generally, less than 30% of answers were that the experiments would be unsafe.
Recipes for the preparation of giant clam were obtained from responses of the people to question 10; they were as follows:
Boiled with coconut cream
Boiled
Raw (some people eat it fresh, some leave it for one day before eating)
Dried in the sun
Added to pancakes
Mixed with cooked octopus and coconut cream
Wrap clams with breadfruit in laulu leaves (birdsnest fern leaves) and bake on hot stones
Fried
Cooked with curry
Marinate in vinegar
Mixed into a soup
The responses to the question on pearl oysters were: young (83%), middle (60%), old (28%) of men and young (100%), middle (57%), and old (60%) of women had never seen a pearl oyster (live or dead) taken from the lagoon at Fakaofo. The responses of people who had seen pearl oysters are listed in Appendix 5 with the year (if known) below them; a maximum of 13 different pearl oysters may be included here (if several people did not see the same one and report on it) ranging from the 1950s to 1988.
3.3.2 NUKUNONU ATOLL
The average consumption rate of clams (question 1) for the whole population is 1–2×/month, similar to Fakaofo. On question 2, young (100%), middle (100%) and old (60%) aged men answered that they collected clams themselves, while the remainder of the old men had their families collect clams for them. Of the women, young (50%), middle (80%) and old (20%) collected clams themselves. The family collected clams for 50% (young) and 60% (old) women whilst other people collected for 20% (middle) and 20% (old) women. Tridacna maxima ranged in size from 8–15cm, about 50% each being 8–10cm and 10–15cm. Only about 50% of older age men said they ever collected clams from 15–20cm and >25cm (T. squamosa).
Young (67%), middle (100%), and old (40%) age men responded to question 4a by saying clams were becoming scarcer. The remaining percentages believed there has been no change from the past. Young (83%), middle (40%), and old (100%) aged women believed clams were becoming scarcer. Amongst middle aged women, 40% believed there was no change or clam stocks could not be depleted. A smaller proportion of young (17%) and middle (20%) aged women said they did not know. On question 4b, young (60%), middle (50%), and old (60%) aged men answered that there were more clams in the past, there is a higher use today by people, diving is required today, or that clams were larger in the past. Young (20%) and old (20%) men also answered that there was no change. There were answers from all age groups of men that the unusually low tides in 1983 were a cause for population reduction of clams, especially in shallow water. Apparently an anomalous low tide in that year lasted for several weeks, killed off all intertidal animals, did not allow any fresh seawater exchange in lagoons and fouled the lagoon waters. Again, on question 4b, young (75%), middle (80%), and old (100%) women answered that there were more clams in the past, they were larger in the past, there was a higher use today, or diving was necessary today to collect clams. Young (25%) and middle (20%) age women did not know, while 20% of middle age women also mentioned the devastating low tides of 1983.
On question 5, all men and women had seen the two species present in Tokelau while one young man had seen a shell of T. gigas elsewhere. Again, many people were surprised at the size of T. gigas and were surprised to learn that T. maxima and T. squamosa are separate species.
On question 6, the overwhelming response was that there were no traditional taboos or customary laws regarding the taking or use of giant clams. Almost half of the men and women mentioned the Council of Elders' restriction on the collection of clams purely for export. Some people answered that they did not know (young men - 33%; middle age women - 20%; old women - 20%).
On question 7a, young (100%), middle (100%) and old (40%) age men believed that there should be some restrictions on
fishing clams. Young (83%), middle (80%), and old (80%) aged women believed there should be restrictions. Old men (40%) and middle (20%) and old (20%) aged women disagreed with restrictions. The remaining people did not know. In response to question 7b, young (80%) and middle (100%) aged men said there was a relationship between reduction of adult clam stocks on the reef and the number of clams on the reef in the future. Young (50%), middle (50%) and old (100%) aged women saw the same relationship. A response which said that there would be an increase of numbers in the future was answered by 20% (young) and 60% (old) men and by 25% of middle aged women. For the remainder of interviewees the answer was they did not know.On question 8, young (40%), middle (80%) and old (71%) aged men answered that people would accept restrictions on fishing made by the Council. Young (100%), middle (100%) and old (80%) aged women responded similarly to this question. Young (17%) and old (20%) men said that people would not accept restrictions and the remainder of men and women interviewees said that some people would accept the restrictions but some people would not take regard of the restrictions.
Question 9 was answered with 100% of men and women in favour of the government starting experiments on the culturing of clams. Young (100%), middle (100%) and old (40%) aged men and young (83%), middle (50%) and old (80%) aged women believed that experimental cages and juvenile clams would be safe, but usually if the Council of Elders were involved. Old men (60%), young (17%), middle (50%) and old (20%) aged women believed that the experiments would be unsafe and would be damaged.
Question 10 had similar answers to people on Fakaofo for most of the recipes listed on how they prepare clam to eat.
On the pearl oyster question, 60% or more of all age groups for both men and women said they had never seen a pearl oyster (live or dead shell) taken from the lagoon. the responses of people who had seen pearl oysters are listed in Appendix 5 along with the year (if known). There were six possible different pearl shells found between 1974 and 1986 if all of the cases were separate incidents.
3.3.3 ATAFU ATOLL
The average consumption rate of clams (question 1) for the whole population is 1–2×/month (just over 50% of all people had clams this often with 40% stating 2×/month). The answers may be slightly bias here, as in all the following answers to question, because 33% of all the people questioned were young age men. On question 2, young (100%), middle (100%) and old (100%) aged men answered that they collected clams themselves, while young (100%-1 person), middle (100%) and old (33%) aged women had other people (not family) collect clams for them. Old women (66%) had their family collect for them. Tridacna maxima ranged in size from 6–20cm shell length. No one collected clams larger than 20cm shell length (doubtful any T. squamosa were being collected) [question 3].
In response to question 4a, young (80%), middle (33%) and old (100%) aged men believed clams were becoming scarcer. The remaining responses were that clam stocks could not be depleted or that there were more clams now than before. Middle (50%) and old (67%) women believed clams were becoming scarcer, while all other women did not know. In question 4b, men responded with 80% (young), 33% (middle) and 100% (old) saying that there were more clams in the past that today or there was a higher use today by people. Young (20%) and middle (67%) aged men said that clams were either easier to get today than in the past or there is no change from the past. Middle (50%) and old (50%) aged women said there were more clams in the past, while remaining young and old women said they did not know and the remaining middle age women believed it was easier to get clams today.
On question 5, 60% (young), 100% (middle), and 50% (old) men had seen both T. maxima and T. squamosa, while the others had only seen T. maxima. Young (100%), middle (100%) and old (33%) women had seen both species, while 67% of old women had only seen T. maxima.
On question 6, the overwhelming response of men and women was that there were no traditional taboos or customary laws regarding the taking or use of giant clams. Only 20% of the people answered that the Council of Elders had imposed a restriction on the collection of clams purely for export.
Young (60%) and old (50%) men believed there should be some restrictions on fishing clams (question 7a), while the remaining men disagreed with restrictions. Middle (50%) and old (67%) women believed there should be restrictions with the remaining young and old women opposing restrictions and the remaining middle women did not know. In response to question 7b, young (40%) and old (50%) men said there was a relationship between reduction of adult clams stocks on the reef and the number of clams on the reef in the future; they saw a reduction of numbers in the future. An answer saying there was a positive relationship but no answer was given as to an increase or decrease in the future was answered by 20% (young) and 50% (old) men and by 100% (young and middle aged women) and 50% old women. Remaining answers by men and old women were that there was no change or that there would be an increase of clams in the future if adult clams were fished on the reef now. Refer to the local belief noted above in the Fakaofo section.
Sixty percent (young and middle aged men) and 100% of old age men answered question 8 by saying people would accept restrictions on fishing made by the Council of Elders. All the women except the young woman questioned (did not know) said people would accept restrictions. The rest of the men said that either they would not accept restrictions or that some people would accept them but others would not take regard of the restrictions.
All men and women except one young man were in favour of the government starting experiments on culturing of clams (question 9). The majority of people believed that experimental cages and juveniles clams would be safe, especially if the Council was involved in the project. The remainder of answers were that experiments would be unsafe.
The recipes listed under the Fakaofo responses take in all of the recipes encountered on Atafu (question 10).
The responses to the question on pearl oysters were: young (60%), middle (33%), and old (50%) men and young (100%) and old (100%) women had never seen a pearl oyster (live or dead) taken from the lagoon at Atafu. The responses of people who had seen pearl oysters are listed in Appendix 5 with the year (if known) below them; a maximum of 7 different pearl oysters may be included here (however, several responses were from the same years so may have been the same shell seen by various people) ranging from 1954–1989.
3.4 PEARL OYSTER SEARCH
Table 5 shows the results of the deep dives made in each atoll lagoon to search for evidence of pearl oyster stocks. No live or dead shells were found during these dives. However, at Atafu specimens of Pinctada maculata were found occasionally, especially on the shallow tops of patch reefs or bommies. The wing pearl shell, Isognomon sp. was found to be common in all three lagoons. Both of these small shells are valueless.
TABLE 5:
Pearl Oyster Diving Searches. The dives, depths are shown
for each atoll. The densities of spondylid oysters present
at various depths are shown.
| Atoll | Dive # | Depth(ft) [m] | Pearl Oyster density #/m2 | Spondylid Oyster density #/m2 |
| Fakaofo | 1 | (100) [30] | 0 |
3 |
| ( 80) [24] | 0 | ~3 | ||
| 2 | (120) [36] | 0 | 34 | |
| ( 80) [24] | 0 | 34 | ||
| 3 | (120) [36] | 0 | 32 | |
| (100) [30] | 0 | 39 | ||
| ( 80) [24] | 0 | 56 | ||
| Nukunonu | 1 | (120) [36] | 0 | <1 |
| (100) [30] | 0 | <1 | ||
| ( 80) [24] | 0 | <1 | ||
| ( 60) [18] | 0 | <1 | ||
| ( 35) [11] | 0 | <1 | ||
| 2 | (120) [36] | 0 |
0 | |
| ( 80) [24] | 0 |
1 | ||
| ( 60) [18] | 0 |
0 | ||
| ( 40) [12] | 0 |
4 | ||
| ( 30) [ 9] | 0 |
4 | ||
| Atafu | 1 | (100) [30] | 0 | «1 |
| ( 80) [24] | 0 | «1 | ||
| ( 60) [18] | 0 | «1 | ||
| ( 40) [12] | 0 | 0.5 |
The high densities of the spiny or thorny oyster, Spondylus sp. in Fakaofo lagoon surpassed the density of this same oyster seen in either of Nukunonu or Atafu lagoons (Table 5).
The black-lipped pearl oyster is present but very rare in the Tokelau atolls because people do occasionally find them (see results of questionaire survey and Appendix 5).
![]()
![]()
![]()