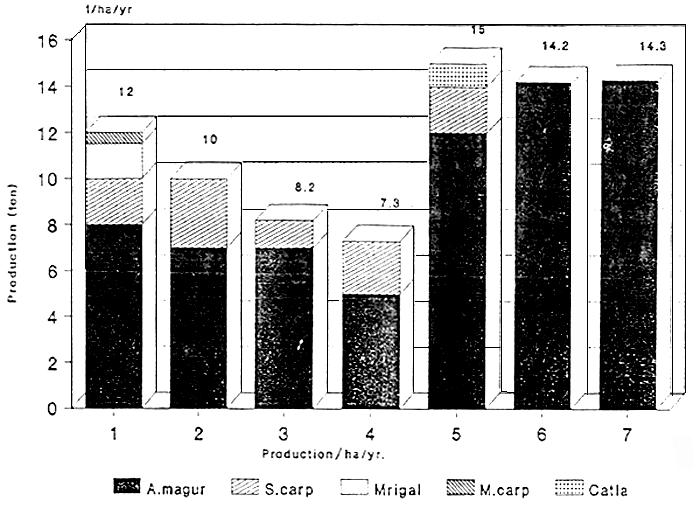
Production results of African magur and other carps, (silver carp, catla, mrigal and mirror carp) obtained in the different culture systems are presented in Table-VI and Fig.1.
The culture period, in different culture systems, ranged from a minimum of 60 days (Gochihata AFL; Pond No.5) to a maximum of 129 days (Natore FSMF; Pond No.4). The maximum net production of 4740 kg/ha/103 days (14.2 t/ha/yr. in 3 crops) was obtained in magur monoculture system in pond no.6 at Natore FSMF and the minimum net production of 2908 kg/ha/129 days (7.3 t/ha/yr. in 2.5 crops) was obtained in magur-chicken integrated culture systems in pond no.4 at Natore FSMF (Table VI).
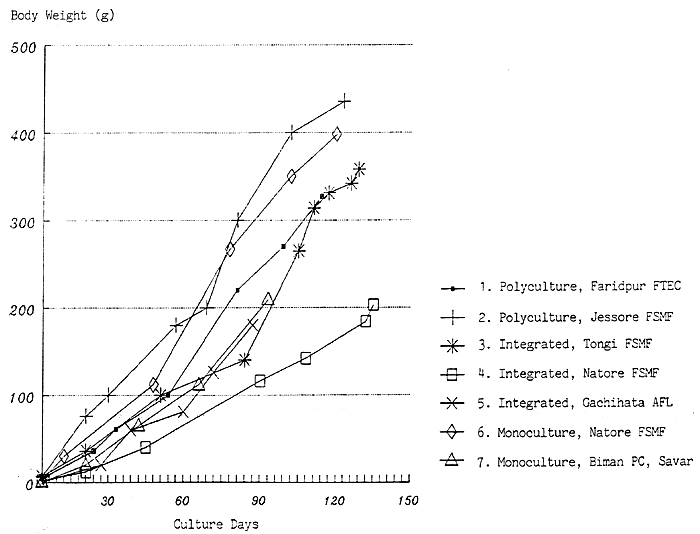
The growth of African magur, as indicated by the increase in average weight of fish sampled in the different days during the culture period, until harvest, under the different culture systems, are presented in Table VII. The results are also shown graphically in Fig. 2.
The growth rate of magur ranged from a minimum of 1.56 g/day to a maximum of 3.94 g/day with an average of 3.12 g/day (Table-VII). The maximum growth rate of magur (3.94 g/day) was observed in polyculture system in pond no.2 at Jessore FSMF. The minimum growth rate (1.56 g/day) was found in magur-chicken integrated system (pond no.4) at Natore FSMF.
The apparent Feed Conversion Ratio (FCR) and feed cost under different magur culture systems are given in Table-VIII)
TABLE - VI: PRODUCTION DETAILS UNDER DIFFERENT CULTURE TECHNIQUES
| Fish Farm and Culture System | Pond area (m2) | Date of harvest | Species | Fish harvested (No.) | Survival (%) | Av.wt. (g) | Gross total wt.(kg) | Net total wt.(kg) | Culture period (day) | Estimated Net Production t/ha/yr | ||
| Pond | Hectare | Pond | hectare | |||||||||
| 1. Faridpur FTECMagur dominated Polyculture | 1090 | 14-Dec-90 | A. Magur | 1044 | 75 | 327 | 341 | 3128 | 334 | 3066 | 94 | 12 in 3 crops |
| S.carp | 83 | 79 | 542 | 45 | 413 | 44 | 403 | 94 | ||||
| Mrigal | 678 | 90 | 85 | 58 | 532 | 52 | 480 | 94 | ||||
| M.carp | 4 | 80 | 1775 | 7 | 64 | 7 | 61 | 79 | ||||
| Total | 1009 | 451 | 4137 | 437 | 4010 | |||||||
| 2. Jessore FSMF Magur dominated Polyculture | 1420 | 29-Dec-90 | A. Magur | 1012 | 83 | 436 | 441 | 3106 | 433 | 3052 | 109 | 10 in 3 crops |
| S. carp | 26 | 52 | 146 | 4 | 28 | 2 | 16 | 95 | ||||
| Catla | 150 | 88 | 365 | 55 | 387 | 42 | 296 | 95 | ||||
| Total | 1188 | 500 | 3521 | 477 | 3364 | |||||||
| 3. Tongi FSMF Magur-Chicken Integrated | 1335 | 19-Dec-90 | A. Magur | 823 | 51 | 358 | 295 | 2210 | 281 | 2105 | 115 | 8.2 in 2.5 crops |
| S.carp | 327 | 100 | 581 | 190 | 1423 | 132 | 987 | 111 | ||||
| Catla | 110 | 99 | 445 | 49 | 367 | 27 | 201 | 111 | ||||
| Total | 1260 | 534 | 4000 | 440 | 3293 | |||||||
| 4. Natore FSMF Magur-Chicken Integrated | 2500 | 08-Mar-91 | A. Magur | 2004 | 67 | 203 | 407 | 1628 | 401 | 1604 | 129 | 7.3 in 2.5 crops |
| S.carp | 635 | 90 | 600 | 381 | 1524 | 262 | 1048 | 127 | ||||
| Catla | 256 | 97 | 348 | 89 | 356 | 64 | 256 | 127 | ||||
| Total | 2895 | 877 | 3508 | 727 | 2908 | |||||||
| 5. Gachihata AF Ltd. Magur-Chicken Integrated | 3050 | 10-Nov-91 | A.Magur | 5172 | 52 | 180 | 931 | 3052 | 927 | 3040 | 60 | 15 in 4.5 crops |
| S.carp | 265 | 88 | 332 | 88 | 289 | 76 | 249 | 60 | ||||
| Catla | 95 | 95 | 242 | 23 | 75 | 18 | 59 | 60 | ||||
| Total | 5532 | 1042 | 3416 | 1021 | 3348 | |||||||
| 6. Natore FSMF Magur Monoculture | 225 | 21-Dec-90 | A.Magur | 271 | 60 | 398 | 108 | 4800 | 107 | 4740 | 103 | 14.2 in 3 crops |
| 7. Biman Poultry Complex, Savar Magur Monoculture | 2200 | 27-Jul-91 | A. Magur | 3785 | 38 | 209 | 791 | 3595 | 786 | 3573 | 66 | 14.3 in 4 crops |

Magur Polyculture, Faridpur FTEC
Magur Polyculture, Jessore FSMF
Magur Integrated, Tongi FSMF
Magur Integrated, Natore FSMF
Magur Integrated, Gachihata AFL
Magur Monoculture, Natore FSMF
Magur Monoculture, Biman Savar
Fig.1. Fish Production (t/ha/yr) under various Culture System
TABLE-VII: GROWTH RATE OF AFRICAN MAGUR UNDER DIFFERENT CULTURE SYSTEMS
| 1. Faridpur FTEC Magur Polyculture | 2. Jessore FSMF Magur Polyculture | 3. Tongi FSMF Magur Integrated Poly. | 4. Natore FSMF Magur Integrated Poly. | 5. Gachihata A.F.Ltd. Magur Integrated Poly. | 6. Natore FSMF Magur Monoculture | 7. Biman PC, Savar Magur Monoculture | |||||||
| Culture Period (day) | Average Weight (g) | Culture Period (day) | Average Weight (g) | Culture Period (day) | Average Weight (g) | Culture Period (day) | Average Weight (g) | Culture Period (day) | Average Weight (g) | Culture Period (day) | Average Weight (g) | Culture Period (day) | Average Weight (g) |
| 1 | 5 | 1 | 6.5 | 1 | 7 | 1 | 2 | 1 | 0.4 | 1 | 3 | 1 | 0.5 |
| 8 | 15 | 15 | 76 | 7 | 13 | 15 | 12 | 7 | 5 | 6 | 8 | 15 | 20 |
| 16 | 36 | 23 | 100 | 15 | 36 | 31 | 40 | 14 | 12 | 13 | 30 | 30 | 65 |
| 24 | 61 | 39 | 180 | 25 | 50 | 61 | 116 | 21 | 20 | 33 | 112 | 45 | 112 |
| 36 | 100 | 47 | 200 | 35 | 100 | 80 | 142 | 28 | 35 | 43 | 167 | 66 | 209 |
| 45 | 175 | 56 | 300 | 53 | 124 | 122 | 184 | 35 | 60 | 54 | 267 | ||
| 56 | 220 | 77 | 400 | 57 | 140 | 129 | 203 | 42 | 81 | 77 | 350 | ||
| 73 | 270 | 109 | 436 | 65 | 207 | 49 | 126 | 105 | 398 | ||||
| 94 | 327 | 79 | 265 | 56 | 166 | ||||||||
| 90 | 314 | 60 | 180 | ||||||||||
| 100 | 331 | ||||||||||||
| 110 | 342 | ||||||||||||
| 115 | 358 | ||||||||||||
| Growth rate of magur (g/day) | |||||||||||||
| 3.42 | 3.94 | 3.05 | 1.56 | 2.99 | 3.76 | 3.16 | |||||||
| Average growth rate of magur : 3.12 g/day | |||||||||||||

Fig.2. Growth of African Magur under various culture systems
TABLE-VIII: FEED COST AND FEED CONVERTION RATIO
| Fish Farm and Culture System | Pond Area (m2) | Amount of feed given (kg) | Cost of feed | Net fish produced (kg) | Feed Convertion Ratio (FCR) | |
| Total (Tk.) | Per kg (Tk/kg) | |||||
| 1. Faridpur FTEC Magur dominated Polyculture | 1090 | 1545 | 6129 | 3.97 | 437 | 3.53:1 |
| 2. Jessore FSMF Magur dominated Polyculture | 1420 | 1349 | 10578 | 7.84 | 477 | 2.83:1 |
| 3. Tongi FSMF Magur-Chicken Integrated Polyculture | 1335 | 2387 | 13742 | 5.76 | 440 | 5.42:1 |
| 4. Natore FSMF Magur-Chicken Integrated Polyculture | 2500 | 649 | 4228 | 6.51 | 727 | 0.89:1 |
| 5. Gachihata AF Ltd. Magur-Chicken Integrated Polyculture | 3050 | 1304 | 6847 | 5.75 | 1021 | 1.28:1 |
| 6. Natore FSMF Magur Monoculture | 225 | 572 | 4152 | 7.26 | 107 | 5.35:1 |
| 7. Biman Poultry Complex, Savar Magur Monoculture | 2200 | 3830 | 11860 | 3.10 | 786 | 4.87:1 |
The chicken sub-system alone did not come out with profitable results. Out of two batches of broiler chicken at Tongi FSMF, the second batch made a minimum profit of 7.5% over operating cost. The layer chicken at two demonstration ponds (Natore FSMF and Gachihata A.F. Ltd.) could not make profit. The detailed results of chicken sub-systems in three demonstration ponds are given in Table IX and X.
Costs of production and cost benefit analyses of magur under the different culture systems are also presented in Tables IX and X.