![]()
![]()
A.K.M. Aminul Haque
As the Sun is the source of energy needed to sustain life on Earth, so is the Ocean a reservoir of the solar energy reaching the surface of the same.
To understand Ocean as an Environment for Mariculture let us form an idea about the scope of Mariculture. In simple expression, Mariculture is ‘Marine Aquaculture’, which in its wider sense includes, (a) culture of fisheries organisms in specially constructed structures under condition that can be controlled, at least to an extent, and (b) replenishing the open marine environment with young of exploited species to be later harvested after allowing a growing period.
Let us now understand Oceanic Environment. Geographers and mapmakers recognize four major oceanic areas in the world. These are : (i) the Indian Ocean, (ii) the Pacific Ocean, (iii) the Atlantic Ocean, and (iv) the Arctic Ocean. The Pacific and the Atlantic Oceans are considered divided at the equator into the North and the South Pacific, and the North and the South Atlantic Oceans respectively.
The environment of the oceans may be classified as (a) Physical environment, (b) Chemical environment, and (c) Biological environment. These are mutually inter-depended and inter-related with cause-and-effect relationship.
The variations observed in the physical, chemical and biological environments are produced primarily due to (a) rotation of the Earth round its own axis, (b) revolution of the Earth round the Sun, (c) gravitational force, (d) lunar periodicity, etc.
The oceans cover about two-thirds of the surface of the Earth, and land areas ( the continents) about one-third. This rough proportion of 2:1 is when the surface areas (i.e., two dimensions of length and breadth) are compared. When we consider productive space the Oceans have got a third dimension, depth, so that when we look at land for agricultural production we consider area (length x breadth). But in case of oceans - and for that matter, all waterbodies we are concerned with volume (length x breadth x depth) so that compared to land, space available for biological production, the productive potential of oceans, is not just two-fold, but many, many times more.
And when we consider the environment of the oceans there is yet a very active fourth dimension, time, which is always at work. This will mean that at any point of space, oceanic environment is always changing with time; the water is flowing and moving, and the time also is flowing.
The physical environment of the oceans is characterized by its vast expanse, vast depth, huge volume of water, bottom topography -- characterized by underwater mountains and canyons, continental shelves, rugged coastline, perpetual darkness beyond the photic limits, waves, tides and currents.
Man's interference -- dumping of various kinds of wastes (industrial junks and other wastes, nuclear rubbishes, etc), construction of oil-rigs, OTEC platforms, testing of nuclear devices, etc. -- all bring about changes, most often with undesirable effects on the physical environment of the oceans.
The chemical environment of the oceans, likewise, is characterized by its natural salinity, the concentration of which, as also the kinds of dissolved chemicals, vary from region to region.
Wherefrom all the salts of the oceans are derived is a mystery. We cannot explain this mystery by saying that the salt has been drained into the oceans by the rivers. The mysterious thing is that the rivers, which have been pouring their waters into the ocean for at least a couple of thousand million years, carry a different assortment of minerals from that which the ocean contains. Of the materials carried down by the rivers and dissolved in the water, about 2% contain chlorine in some form and about 60% contain carbon. In the oceans, on the otherhand, almost the opposite is true : 90% of the dissolved minerals called “salts” are chlorides and one-half percent carbonates.
Salt water is heavier than freshwater, so that when the two meet the former will tend to sink. This sets in a sort of vertical current. While the density of freshwater is maximum at 4oC, that for salt water is below 0oc; this fact also sets in movement of water. Chemical effluents and wastes of industries, oil spills, radio-active fall-outs, acid rains, etc., bring about pollution of the chemical environment.
The biological environment, on the other hand, is characterized by the myriads of kinds and numbers of plants and animals -- from microscopic to whale-sizes. The fact that these plants and animals do not come up to the land for their food and other requirements of life-processes, would establish that they get all their life's requirements right in the water of the ocean. There must, therefore, have been a very efficient system of regeneration and a continuous process of recycling going on in the oceans to enable the oceanic environment to meet all the requirements of the myriads of organisms -- big and small -- in the vast aquatic environment.
Natural phenomena, like cyclones, hurricanes, tidal surges, underwater volcanic eruptions, tsunamis, etc., may, however, bring about local and regional disruptions in the environment. Also due to human exploitation of the oceanic resources and various degrading activities the apparent physico-chemico-biological balance may get upset, at times with catastrophic consequences.
The effects of pollution of oceanic environment is bound to be global in nature, irrespective of the place of origin, due to the continuous movement -- both horizontal and vertical -- of the mass of water.
Ocean surface, down to about 1 cm the ‘surface microlayer’ is extremely important for oceanic phenomena. Wind blowing over oceans drives surface currents and causes waves. Rates of transfer of energy and water between the ocean and the atmosphere might get altered so as to modify weather conditions. Role of surface microlayer in transferring agriculturally important nutrients, such as, nitrogen, phosphorus and potassium into the atmosphere has still to be properly defined. Monitoring the pollution of the oceans must also take account of the microlayer because fall-out over oceans may be concentrated by organisms in the microlayer and hence enter various food-webs.
Ocean and atmosphere are inextricably linked. There is a continuous transfer of momentum, energy and matter at the ocean-atmosphere interface. The ocean absorbs much of solar radiation that manages to penetrate the Earth's atmosphere, and acts as a heat reservoir--slowly heating up in summer and cooling in winter.
On an average only about 70% of solar radiation, that reaches the Earth, penetrates the atmosphere, and about 30% is reflected back into space from clouds and dust particles. Of the 70%, again, on an average, about 17% get absorbed in atmosphere, about 23% reach the surface of the Earth as diffuse light, and about 30% reach the surface as direct sunlight. Much of ultra-violet radiation is absorbed in ozone layer. And it is good to remember that of the surface of the Earth 2/3rds constitute ocean surface.
Oceanic circulation involve both surface current and the so-called “deep circulation”, which is fed by cold, dense water sinking at the polar regions and moving towards the equator.
The over-all pattern of oceanic circulation is thus 3-dimensional, and it is necessary to understand movements of dissolved or suspended pollutants.
A very important aspect of oceanic circulation is that it causes areas of high fish productivity along some continental coasts. The moving mass of deep water rich in nutrients, when confronted by the coast, wells up at certain points. This ‘up-welling’ is rich in nutrients on account of decay of organic matter sinking from the surface, and these up-welling points are thus regions of high biological productions. Although these up-welling points constitute only about 0.1% of total oceanic area, they account for about 25% of world's annual fish catch.
Periodically harvest fails, due to one reason or the other, spelling disaster to the economy of the region involved.
The coastal regions are the most intensively exploited areas of Earth. About 2/3rds of world's population live in the coastal areas. Seas covering continental shelves make up only 8% of the total oceanic area, but most of the fish harvest comes from these waters. Ironically, this is the area which may be heavily polluted by human activities--both on land and in sea -- through exploitation of the valuable physical resources, besides the biological ones, of the continental shelves. This area again gets sediments supplied from inland by rivers and glaciers, and from local sources by wind, waves and currents. Longshore transport by waves and currents moves these sediments along the coast until they either disappear down submarine canyons, or are shifted on to deeper parts of the shelf.
The ocean is a self-replenishing source of food for the myriads of plants and animals that inhabit it. Not only that, it is an important source of food for man and feed for his livestock, poultry and aquacultural organisms.
Kinds of plants and animals harvested for food in any region depend on the accessibility of the fishing grounds, availability of the food-items and the demand for them, which may again be governed by the region's taste for particular food-items, and extent of other available food resources. Likewise, kinds of plants and animals cultured for food in a section of the Sea depend on the accessibility and controllability of the section, congeniality of the environment for the species to be cultured, and extent of development of marketing system.
Estuaries are meeting places--of sea water and freshwater, of freshwater and salt water flora and fauna, of land-borne and sea-borne sediments and pollutants, and of seafarers.
This area is characterized by very rich contents of organic material, suspended sediments and various pollutants.
Man has been making all endeavors by evolving and adopting various technologies to artificially enhance the natural production of oceans. Species yielding high monetary returns, and especially those that can be reared in small areas, are usually included in aquacultural -- and maricultural --programmes. These mostly cover finfishes, mollusks, arthropods, and marine algae.
Depending on the species of choice, Mariculture employs floating cages and net-cages, pens and corrals, trays, rafts, poles, hanging nets, etc., for culture of the desired species.
Here, culturable fisheries organisms (finfishes, mollusks, crustaceans, and algae) are bred and reared to marketable size under, to a large extent, controlled conditions. The habitat chosen for mariculture is usually the edges of the ocean, its inshore bays, coves and creeks, inlets and similar sheltered areas, but may also be the relatively calmer portions of open seas.
Sea ranching, on the otherhand, represents a transitional and special form of mariculture, where hatchlings/larvae of water organisms are obtained by induced propagation methods, and reared to a certain size in a controlled environment, and later put into the open sea to grow in freedom to the desired size, and then caught by conventional fishing methods. This method is attempted, for example, for plaice in British waters and kuruma prawn (Penaeus japonicus) in Seto Inland Sea in Japan. Sea ranching may require international understanding among nations as this may raise the question of ownership of international waters.
Productivity of marine environment may also be improved by pumping nutrient-rich deep water to the surface to create an artificial upwelling system. This has been tried in the Virgin Islands, British Columbia and Alaska and other places with success.
Man derives his origin from water, and almost as a corollary, has got to turn to water for his sustenance.
Luqueman Ahmed
Joint Chief
M/O. Fisheries & Livestock
Fisheries resources play an important role in the diet and life of the Bangladesh people, supplying as estimated 80 percent of the total animal protein food locally produced, providing employment to about 1.2 million commercial fishermen and part-time employment to 9–10 million rural families and contributing 12 percent of total merchandise export earnings.
The inland waters account for nearly 80 percent of the total fish production. Of the total inland harvest, an estimated 80 percent comes from the open water capture fisheries and the rest from the closed water culture fisheries.
Open water inland fisheries consist of (i) rivers, canals, tidal creeks and estuaries, (ii) beels, haors and other flood plains including monsoon flooded paddy fields, (iii) road-side canals, borrowpits, etc.
The inland open water fisheries have already significantly shrunk or degraded over the past years due to natural phenomena and man-made changes including barraging of the river for irrigation and dyking of the river banks and closing of innumerable canals and creeks as measures to reclaim agricultural land from flood and saline tidal water. In the desperate national efforts to increase food grain production for the increasing population, new irrigation and flood control projects will be implemented further reducing or altering the natural aquatic environment with the resultant adverse impacts on open water fisheries. However, the development processes will create, as have already created in the past, new areas where water can be supplied or gathered and stored with various degrees of control and for various lengths of time. Some further development work relevant to aquaculture, artificial stocking with fish and shrimp fry and appropriate management in coordination with agricultural crop farming, could make the new areas possibly productive enough to greatly reduce or even offset the loss of natural fisheries.
In 1991, the total area under flood control, drainage and irrigation (FCDI) was 34.64 lakh hactres of which irrigation covered 4.27 lakh hactres. Except for about 2.47 lakh hactres of brackish water areas located within coastal polders seasonally utilized for brackish water aquaculture, other FCDI projects find no particular use for fish production.
The Fourth Five Year Plan emphasizes the need for organized fisheries development in the FCDI Project of BWDB. The FAO/World Bank Co-operation Mission for Third Fisheries Project has also recommended to focus on the development of fisheries as essential components of the FCDI Projects.
If 10 percent of the FCDI area (3.46 lakh hactres) were brought under fish production, the area alone could produce without much difficulty, at least 1.73 lakh tons incremental production of fish contributing 55 percent to the country's total target increase (3.1 lakh tons) in fish production by the end of the Fourth 5/Year Plan. The value of increased production should be Tk. 519 crores (@ Tk. 30/kg) annually.
In order to develop fishery in the FCDI Project areas, the Master Plan Organisation has suggested 8 key policies of which the related major policies are:
Institutional arrangements have to be made to mandate co-ordination amongst the concerned Government development agencies viz. BWDB, LGEB and BRDB and the Fisheries Directorate, FCD. Once the co-ordination unit is cleared by the Planning Commission its recommendations for planning and design of water projects should be binding on all agencies. Fundamental to the success of recommended policies, is an adequate information gathering system with baseline data of fish species, their habitats, and their production in the selected water areas.
Fishery development programmes within FCD and FCDI projects should be the responsibility of the DOF. To ensure smooth co-ordination between engineering operations and fishery needs, local co-ordination units consisting of engineers and fishery specialists should be set up for successful implementation of activities. Design and operation manuals for FCD and FCDI projects should include guide-lines and procedures for controlled water manipulation to ensure a properly managed fishery.
Certain land and water resources should be allocated
exclusively for fishery use:
- Baors (ox-bow lakes) in the Southwest region, capable
of producing over 700 kg of fish per hectare of water
surface per year without supplementary feeding but with
proper management should be allocated exclusively for
growing fish. Aquaculture is potentially of much greater
economic value than using boar water for irrigation.
A broad environmental policy should be adopted to make certain that, at the stage of designing new barrages/regulators/water control structures, adequate provisions are built into the design to allow fish migration and movements as naturally as possible.
For implementing the above policies the MPO opines that one of the most important priorities to improve fisheries planning is establishing an adequate data base and information gathering system with respect to species and their habitats and production. Better information on the consequences of proposed FCD and FCDI project on fisheries is needed to quantify losses of fisheries for economic evaluation, and develop compensatory or replacement measures where possible.
In order to utilise the potential of Fisheries Development in the FCDI Project area, a Memorandum of understanding (MOU) was signed with BWDB on 14, February, 1990. Accordingly, fisheries development activities was undertaken in some FCDI Projects through fingerling release only. The experimental fish production efforts have been attempted in the Meghna-Dhonagoda Irrigation project (MDIP). The experiences gained through experimental model practised in MDIP area suggest emergence of devising an acceptable model for integrated fisheries development in the number of water bodies created within the FCDI project areas.
In the context a development project has been drawn up at a total cost of Tk. 1176.00 lakh which has been approved by ECNEC. During the project period total 15,320 ha water areas of various types will be developed under the project. At the implementation of the project annual fish production has been targetted 12,100 tons. Besides, production from Livestock activities will earn worth Tk. 8.07 crores annually.
It is expected that all the above projects, programmes and policies will help sustainable development of fisheries sector without imparing the environment.
Prof. Abu Tweb Abu Ahmed
Department of Zoology
Dhaka, University
1. Itroduction
Recently biodiversity has assumed a great significance worldover. However, the subject is not at all new to the biologists who have been always trying to highlight the importance of its preservation. However, now both politicians and public are convinced to preserve biodiversity for immediate as well as longterm benefits to the mankind. In our country ‘green-house effect’, ‘ozone hole’, ‘sea-level rising’ etc. are now somehow entered in the public consciousness, but the seriousness of the loss of biodiversity is yet to be appreciated.
The term Biodiversity i.e. biological diversity refers to the variety and variability among the living organisms (biota) including the genetic variability within species and population, their interactions, and the ecological processes which they influence or perform. It covers all forms of life and the habitats Now conservation of biodiversity has been accepted world over as essential - to maintain the varied forms of life we eat, use and live with. Wild plants and animals also play a crucial role in the human arts and culture. The living species now known are only a fraction of what exist. So far, approximately 1.4 million species of biota have been identified, through the anticipated number of species may be over 100 million.
Due to her unique position in the sub-tropical region, and within the delta of the three great rivers, the Ganges, the Brahmaputra and the Meghna (covering an area of 14.30 million hectares) Bangladesh is very rich in biodiversity.
2. Aquatic Environment : Bangladesh
Bangladesh is a riverine country in the subtropical region, having 256 rivers, of which 54 are international rivers. The rivers, ponds, beels, haors, lakes, flood plains, brackish and marine water bodies form her aquatic environment. Due to warm temperature, good rainfall and rich soil the aquatic environment is rich in varieties of aquatic plants and animals. But the conservation of our aquatic resources is rather difficult because the aquatic ecosystems are poorly understood, relatively unmanageable, shared by multiple users, and highly vulnerable to human interactions and climatic changes.
The biodiversity of our aquatic environment includes :
1. Diversity of the Aquatic Habitat
The aquatic habitats of Bangladesh broadly fall under the following categories :
The extent of different types of aquatic habitats are summarized as follows :
| Types of water body | Area (ha) | ||
| (a) | Inland Open waters | ||
| 1. | Rivers (during dry season) | ||
| The Ganges | 27,165 | ||
| The Padma | 42,325 | ||
| The Jamuna | 73,666 | ||
| The Meghna (upper) | 33,592 | ||
| The Meghna (lower) | 40,407 | ||
| Other rivers and canals | 262,580 | ||
| 479,735 | |||
| 2. | Estuarine area | 551,828 | |
| 3. | Beels and haors | 114,161 | |
| 4. | Kaptai lake | 68,800 | |
| 5. | Inundable flood plains (seasonal) | 5,486,609 | |
| 6,221,398 | |||
| (b) | Closed waters | ||
| 1. | Ponds and tanks | 146,890 | |
| 2. | Baors (oxbow lakes) | 5,488 | |
| 3. | Brackish water farms | 108,000 | |
| 260,378 | |||
| (c) | Marine waters | ||
| 1. | EEZ | 70,000 sqr km | |
The above water areas get extended in rainy season. Beyond EEZ also lies the vast marine water area for common use.
In prehistoric time our water bodies were mainly the flowing rivers and flood plains and fresh and brackish water swamps including the mangroves. Man made lakes and ponds were constructed primarily for domestic use. But with the advent of agricultural revolution in the fifties the characteristics of aquatic habitats changed widely due to the construction of embankments and water management structures. Increased population pressure and construction of roads and houses also added to the change. These changes imposed alteration of the aquatic environment. For example, the mangrove swamps have been converted to paddy fields and fish farms in the south and south eastern parts of Bangladesh.
The flood plains have also been reduced because of the construction of different flood control structures. The earlier estimated flood plains of 6,300,723 ha have now been reduced to 5,486,609 ha by permanently drying up 814,114 ha under flood control measures. Due to siltation, water logging and drainage congestion, many areas have been coverted into man-made ecological disaster areas. Increase in water pollution from various sources and saline intrusion in the southern parts have added to the severity of the problems.
II. A. Biodiversity of Aquatic Plants
The aquatic flora ranges from the tiny phytoplanktons to the macrophytes and mangroves. But unfortunately very little information is available on our aquatic flora. On the basis of the scattered works done in the country, the aquatic flora diversity can be summarized as follows:
| Plant Groups | No. of genera (approx.) | |
| A. | Freshwater | |
| Phytoplankton (algae) | 156 | |
| Fern | 6 | |
| Bryophytes | 2 | |
| Angiosperms | 67 | |
| B. | Mangroves in Sunderbans | No. of species |
26 | ||
| C. | Marine algae | 168 |
Due to lack of adequate field studies the extent of plant species being extinct/endangered is not known. But denudation of the mangrove forests, change of wetland habitats, use of agrochemicals and environmental degradation have already threatened many plant species. Therefore, conservation measures need to be taken up to save aquatic flora. A ‘germplasm’ banks should be established to preserve the plant genetic resources.
II. B. Biodiversity of Aquatic Animal Species
Bangladesh is very rich in the diversity of aquatic animal species due to its geographical position, warm climatic condition, sufficient rainfall, river flow and diversified aquatic habitats. The water bodies sustain large varieties of animals, a feature which is just contrary to the temperate regions where the number of animal species are less.
The aquatic fauna including the tiny protozoans and the giant marine mammals - the whale are available in our waters. But due to lack of complete zoological survey there is not adequate database on our aquatic fauna. However, the diversity of aquatic and some semi-aquatic animal species reported so far is summarized below :
| Animal Groups | Habitat | No. of species (approx) |
| Shrimp | Fresh and marine water | 56 |
| Grabs | Marine | 11 |
| Fresh water | 4 | |
| Lobsters | Marine | 3 |
| Molluscs | Fresh water | 26 |
| Marine | 301 | |
| Fish | Fresh water | 260+13 exotic spp. |
| Marine | 475 | |
| Frogs | Fresh water | 10 |
| Turtle & | Fresh water | 24 |
| Tortoise | Marine | 4 |
| Crocodiles | Fresh water | 1 |
| Marine | 1 | |
| Ghorial | Fresh water | 1 |
| Snakes | Fresh water | 6 |
| Marine | 18 | |
| Birds | Fresh water & Marine | 200 |
| Mammals | ||
| Otters | Fresh water & Marine | 3 |
| Whale | Marine | 3 |
| Porpoise | Fresh water | 1 |
| Dolphins | Fresh water | 1 |
| Marine | 8 |
Many of our wild animals (23 species including amphibians, reptiles, birds and mammals have been declared as endangered species in the Red Data book of IUCN, whereas we have already lost (extinct) 1 species of crocodile, 2 species of birds and 3 species of mammals from our aquatic resource. A number of fish species (about 12 including Mohashale, Nandina, Cheng, Gochi, Gozar etc) are being considered as endangered/threatened due to their gradual disappearance as a result of habitat change, environmental degradation and disease outbreak.
A trend of 1.24% yearly decrease in the fish production in inland open water (including flood plains) fisheries which provide about 70% of our catch has been projected as one of the impacts of human intervention in flood plain through construction of embankments and polders. Therefore, measures against flood problems must be ecologically sustainable to preserve biodiversity of the aquatic resources.
III. Aquatic Genetic Diversity
Our aquatic environment is rich in genetic diversity having varieties of well adopted plants and animals. But in recent decades large scale destruction of aquatic habitats by the construction of flood control and irrigation structures; dams and barrages; conversion of mangrove swamps into agricultural lands and fish farms; coral reef destruction (in St. Martins Island); siltation, drainage congestion and water logging; and salinization of wetlands have created threat to our aquatic biota. Our exploitation of the aquatic resources, displacement of or irreversible genetic changes in natural populations by induction of exotic species (like HIV rice; exotic fish species), disease (EUS), and predators (like African magur) and massive use of agrochemicals are deterrent the preservation of our genetic diversity. In general, conservation of aquatic genetic diversity and development works involving natural aquatic resources have been largely incompatible. That is why the aquatic ecosystems and the biota are seriously threatened like the more publicized terrestrial bioms and biota. Conservation of some aquatic flora like mangroves and fauna like frogs, turtles and whales have been benefitted from publicity and public awareness, but equally threatened status of many fresh water species is less appreciated.
The importance of conservation of genetic diversity has been well accepted, yet strategy to undertake such activities is yet to forcefully initiated. Considerable decrease in the open water inland fish production, but increased demand of fish has pushed the intensification of aquaculture which also sometime acts against the protection of genetic diversity.
Conclusions :
Any loss of biodiversity is normally irreversible and perhaps difficult and expensive to restore, if at all possible. Awareness should be created so that people can understand the value of preservation of biodiversity. For years, the progressive loss of biodiversity largely escaped the attention of planners and even ecologists, chiefly because the effect were not obvious or immediate. The past concern over the erosion of biodiversity has been more an academic exercise having little to do with economic or ecological necessity. But fortunately now those who are concerned for sustainable development clearly understand the necessity to protect our biodiversity and genetic resources. Immediate conservation measures should be adopted to protect important threatened species and their natural habitats. It is important to establish “germplasm” and “gene” bank. Ex-situ fish gene banks certainly have an important role in research and aquaculture breeding, but are difficult and costly to establish and maintain. Therefore, in-situ conservation of genetic diversity holds great promise. But, of course, the first priority should be given to the study and documentation of the status of biodiversity of aquatic organisms. For this, field research, training, database development and awareness creating programs are needed with adequate funding support.
MAHIUDDIN AHMED
Joint Director, Dept. of Environment, Dhaka
INTRODUCTION
Bangladesh is endowed with vast areas of inland open water in the form of rivers, flood plains, estuaries, lakes and lagoon. Thus the country offers great potential for development of inland fishery and aquaculture.
Inland fisheries resources of Bangladesh cover an area of about 4.3 million ha of which 94% comprise open water for capture fisheries and 6% closed water systems. Moreover the three main rivers viz. the Padma (the Ganges), Meghna and Jamuna/ Brahmaputra and 700 rivers and tributaries totalling 22155 km, dissect various terrains in their linear drift. The vast inland water areas in the form of 2.8 million ha of haors 114,161 ha of beels and 5,480 ha of ox-bow lakes offer remarkable scope and potential for fish production.
According to the studies conducted by the Department of Fisheries of Bangladesh, declining trends are already discernible in the capture fisheries of Bangladesh. A host of man induced stresses due to large scale water abstraction for irrigation, construction of embankments for flood control, siltation and soil erosion due to deforestation in the catchment water, pollution from industrial, agricultural and municipal waste, etc. have left a trial of devastating effects on fish stocks of the country.
1. AQUATIC POLLUTION :
Aquatic pollution or water pollution involves addition of undesirable materials or heat in the water. Thus making the water harmful to human beings, animals and desirable aquatic life. Water pollution changes the quality of our surface and sub-soil waters to such a degree that its suitability either for human consumption or for the support of man's natural life process decrease or cease. The major aquatic pollutants which cause the aquatic pollution are : oxygen demanding wastes, disease causing agents, plant nutrients, synthetic organic compounds, oil, inorganic chemicals, mineral substances, sediments, radioactive substances and heat.
1.1 Sign of aquatic pollution :
The major signs of aquatic pollution are as follows:
1.1.1 Bad taste for drinking water
1.1.2 Offensive odours from lakes, rivers and sea beaches
1.1.3 Profuse growth of aquatic weeds
1.1.4 Oil and grease floating on water surface
1.1.5 Depletion of fish population in fresh water, river water
and sea water.
2. TYPES OR SOURCES OF AQUATIC POLLUTION VIS-A-VIS FISHERY :
The main types/sources of aquatic pollution are as under :
2.1 Domestic water pollution/Human Settlements :
It includes domestic waste water and waste water from commercial establishments. Urbanization greatly influences both water quantity and quality because of run-off and sewage. In developing countries more than 95 percent of urban sewage is discharged directly into surface water without treatment and thereby polluting the water. Many cities in developing countries lack even sewer system. Bacteria, virus, and parasites in water supplies, remain a more serious threat to living beings than toxic contaminants.
2.2 Industrial pollution
Industry and mining are the principal sources of heavy metals and synthetic organic chemicals in fresh water. The heavy metals from industries include dust from smelting and metal processing, discharge of heavy metal solutions used in plating & galvanizing, metal compounds of paints, plastics, batteries and tanning etc.
Most synthetic organic chemical pollution occurs from industrial sources including chemical and petrochemical refineries, pharmaceuticals manufacturing units, iron and steel plants, wood pulp and paper processing factories etc. Fertilizers & insecticides, are other major sources of pollution.
Most of the polluting industries of Bangladesh discharge their untreated effluent directly into the river. In most of the cases they don't have treatment plant or system of recycling, resulting both lethal and sublethal impact on fish eg. Sylhet pulp and paper Mills at Chhatak, Karnaphully Paper Mills at Chandraghona, Fertilizer Factory at Fanchuganj, Urea Fertilizer Factory at Ghorashal, Hazaribag Tanneries in Dhaka have polluted considerably the water of Surma, Karnaphully, Kushiara, Sitalakhya and Buriganga rivers. Large scale fish kill of Sitalakhya river was due to raw ammonia released from Urea Fertilizer Factory, Ghorashal. Fish mortality in waterways near Mobarakganj Sugar Mills in Jhenaidah and Setabganj Sugar Mills in Dinajpur district is due to the effluent discharge from these mills. Heavy metals such as mercury enters the Karnaphuli river by Chittagong Chemical Complex (CCC) and Karnaphuli Paper Mills (KPM), lead enters from the oil refinery, chromium from tanneries, cadmium from dying and painting and arsenic from Urea Fertilizer Factory. Among the most harmful pollutants known to be discharged are mercury, lead, chromium arsenic and iron.
There are about 30,000 industrial unit in Bangladesh of which about 24,000 are small and cottage industries. According to the survey of Department of Environment in the year 1986, following major polluting industries were identified :
| a) | Textile industries | 298 | Nos. |
| b) | Tanneries | 176 | " |
| c) | Pharmaceuticals & chemical industries | 166 | " |
| d) | Jute product industries | 92 | " |
| e) | Primary & Secondary metal units | 57 | " |
| f) | Rubber & Plastic good producing units | 34 | " |
| g) | Pesticides (producer & formulators) | 25 | " |
| h) | Sugar Mills | 16 | " |
| i) | Distilleries | 3 | " |
| j) | Cement industries | 3 | " |
| k) | Fertilizer industries | 5 | " |
2.3 Agriculture and water pollution :
Agriculture is the leading source of water pollution. Farmers have increased crop production by using large amount of fertilizers and wastes of some of which run-off into streams or percolate in ground water. Other cultural practice, such as frequent ploughing and excessive irrigation aggravate pollution of fresh water with sediments, salts and pesticides.
Inorganic fertilizers, enter into the aquatic ecosystem through run-off or during irrigation. The addition of excess plant nutrient can lead to a disturbance of phosphors nitrogen balance in the systems as well as excessive aquatic plant growth to initiate and intensify eutrophication. dead plants settle to the bottom, and since they are organic, increase the BOD of the system during decomposition. For example, many blue green algal blooms eg. Microcystis, Anabena or blooms caused by Euglena, or the diatoms may cause not only depletion of oxygen of water and thereby creating problems for fish growth but several of these secrete toxigenic substances in the water which are responsible for various ailments in human body.
A large number of pesticides have come into widespread use in recent years. Many of these compounds are nonbiodegradable and only slightly soluble in water. Consequently, when sprayed on crop or farm land they remain in the soil for a long time. During heavy rainfall or when the crops are irrigated, they tend to be carried as a suspended particles into water systems. They enter the food chain in both fresh and marine water systems, under varying concentration and get deposited in fish & other aquatic organisms.
It has been reported that 20 insecticides, 18 fungicides and 2 rodenticides are being used in Bangladesh and many of the pesticides are sold by trade name without mentioning the chemical group or class to which they belong.
2.4 Pollution by oil :
In Bangladesh localized oil pollution is said to be heavy in the vicinity of Chittagong and Chalna port harbours. More than 1000 number of ships and 40–50 oil tanker in Chittagong port, 500 ships in Mongla Port, are handled annually. Besides, numerous river craft, launches and steamers also ply along water ways and discharge waste oil spillage, bilge washing, into the water and create pollution in the marine environment. They affect coastal fisheries in both qualitatively and quantitatively. In case of oil spill, the water quality gets changed seriously and affects the phyto and zooplankton. It also adversely affects the breeding places for shrimp and prawn.
2.5 Pollution by radioactive materials :
Pollution is caused from the wastes of Uranium, and Thorium mainly from nuclear power plant and also from industrial, medical and scientific utilization of radioactive materials. Some are mutagenic and lethal at relatively low concentrations.
2.6 Pollution by heat/thermal pollution :
Certain industrial plants discharge large volume of water having high temperature into the rivers. Such high temperature of water alters the physical, chemical and biological characteristics of aquatic system and thereby cause harm to fish and other aquatic organisms.
3. BANGLADESH STANDARD FOR WATER QUALITY FOR FISH :
The standard value for different parameters/determinants (DOE, 1991) for fish requirements are given below :
| Parameters/determinants | Unit | Standard value for fishing water |
Acidity | mg/L | Less than 20 |
Alkanity (total) | mg/L | 70–100 |
Ammonia (NH3) | mg/L | 0.026 |
Ammonical nitrogen (as N) | mg/L | 1.2 |
BOD | mg/L | 6 |
Carbondioxide | mg/L | 6 |
Chlorine (Residual) | mg/L | 0.01 |
Chloride (as CL) | mg/L | 600 |
Chromium (total) | mg/L | 0.05 |
Coliform (total) | mg/100 mL | 5000 |
Copper | mg/L | 0.4 |
DO | mg/L | 4–6 |
EC | mmhos/cm | 800–1000 |
Hardness (as caco3) | mg/L | 80–120 |
Lead | mg/L | 0.05 |
Mercury | mg/L | 0.001 |
Nitrite | mg/L | 0.03 |
Oil and grease | mg/L | 0.01 |
4. NEEDED ACTION :
4.1 Whenever possible the chemical fertilizer may be replaced by biofertilizer. Similarly biodegradable insecticides should replace the nonbiodegradable ones and biological control should replace the chemical control as much as possible.
4.2 Indiscriminate use of fertilizer should be stopped.
4.3 Proper sanitation both in urban and rural area should be ensured.
4.4 Adequate measures should be taken by the industries to dispose off all types of wastes in a proper manner i.e. following the environmental quality standard.
4.5 All necessary steps to be taken for reutilization of agricultural residues through bio-conversion to industrial products.
4.6 To promote research on waste utilization and waste recovery process.
4.7 Attempts to be taken to control insect pests through biological, microbial or genetical process instead of using toxic chemicals.
4.8 Appropriate legislation of oil spill in the coastal area to be established and implemented as early as possible to minimise marine pollution.
4.9 To minimise the obstruction of water flow being created by the construction of dams, embankment and other water strutures.
Prof. Yousuf Sharif Ahmed Khan
University of Chittagong
1. INTRODUCTION
Marine pollution has become a serious problem all over the world and is getting aggravated in the developing country. The problems relating to marine pollution are complex. Marine Pollution is defined by the United Nations Convention on the Law of the Sea (UNCLOS) as “Introduction by man directly or indirectly of substances or energy into the marine environment including estuaries, which results or is likely to result in such deleterious effects as to harm living resources and marine life, hazards to human health, hindrance to marine activities, including fishing and other legitimate uses of the sea, impairment of quality for use of sea water and reduction of amenities”.
The marine water of Bangladesh gets pollutants, which are washed down from lands or dumped directly. Rivers and waterways which criss-cross the entire country through which also drain waters from upstream countries (India, Nepal, Bhutan and China) carrying pollutants from different sources finally empty into the Bay of Bengal. Most of the pollutants are in the form of sediments, municipal and industrial wastes, agro-chemical residues and chemicals and oil discharge from ships and boats.
2. MAJOR TYPES OF MARINE POLLUTION
2.1 OIL POLLUTION :
Oil pollution results from the crude oil transportation systems, waste oil from ships and mechanized vessels, workshop, refinery. Besides, more than 50% of the oil pollution in the marine environment comes from urban activites and through river run-off. International oil tankers also contribute to the oil pollution in the coastal and marine environment. Localized oil pollution is said to be heavy in the vicinity of the Chittagong and Mongla Port areas, being the centers for tanker traffic and trans-shipment operation.
Nearly, 1200 ships and 40–50 oil tankers in Chittagong Port and about 600 ships in Mongla Port are handled annually. According to the Deptt. of shipping about 2500 registered power-driven river crafts and numerous unregistered small power-driven boats including oil tankers ply in coastal waters of Bangladesh. Besides these, 3000 power-driven trawlers and boats are also engaged in fishing in the Bay of Bengal. Different types of waste oil like balast and bilge-water from ships, tankers, mechanized boats etc. and crude oil leakage, oil emulsion and oil residues from different sources are entering the sea. Ship breaking operations in Chittagong and Mongla are also responsible to some extent for oil pollution. There are now about 150 companies engaged in this business which pollute coastal soil and water. An estimation of oil and oily substances entering the sea in the Chittagong area is given in the Appendix-1.
Accidental oil spillage from oil tanker was also reported in the Bay of Bengal in 1989. An oil tanker, M.T. Filloti spilled out about 2,247 tons crude oil near Kutubdia area of Chittagong and as a result marine resources were badly damaged. Another oil spillage from the tanker T.T. Energy was reported in Khulna region, which caused an oil slick over an area about 64 km. along the Sundarbans mangrove forest in 1992.
Oil pollution affects different species of organisms in different ways. The thin layer of oil on water reduces the light penetration and exchange of oxygen and carbon dioxide across the air-sea interface, interfering with photosythesis and causing depletion of dissolved oxygen. It is reported that fish eggs and larvae are killed at a concentration ranging from 10–5 to 10–3 ml/L of oil. Other studies have shown that fish eggs develop abnormally at oil concentration between 1 to 10 ppm. At a concentration of 0.01 ppm fish eggs hatch deformed hatchlings. Some other sublethal effects include fish behavioural disturbances, changed migratory and reproductive pattern. Larval stages of marine invertebrates are 10 to 100 times sensitive to oil than adult.
Oil pollution is particularly damaging to mangroves. A large quantity of mangrove plants can be destroyed when their roots, pnumetaphores become clogged with oil. Their leaves are sensitive to oil and defoliation result from oil contact.
2.2 INDUSTRIAL WASTES :
Almost all the industries in Bangladesh do not have waste treatment facilities. They discharge their untreated liquid and solid wastes directly or indirectly which finally find their way into the Bay of Bangal. The major industries of the country concentrated in three urbane areas (a) Tajgaon, Hajaribag, Tongi, Demra and Joydevpur in Dhaka. (b) Khalishpur, Shiromoni, Rupsha & Boira in Khulna (c) Nasirabad, Kalurghat, Sholashahar and Patenga in Chittagong.
Presently, there are about 24,000 small & cottage industries of which 903 units were considered potential polluters till 1986 (Appendix-2). But recent estimate shows the number to over 1200 at present.
The polluting industries of Chittagong mainly consist of 19 tanneries, 26 textile milles, 1 oil refinery. 1 TSP plant, 1 Urea plant, 1 DDT plant, 2 chemical industries, 5 fish processing plants, 1 asphalt bitumin plant, 1 steel mill, 1 paper mill and rayon complex, 1 soft drink factory, 2 cement factories, 2 soap and detergent plants, 2 pesticides manufacturing plants, 4 paint and dye manufacturing units and 75 other light industry plants. The polluting industries of Chittagong are shown in appendix-3.
The wastes from the karnafully Paper Mill (KPM) and Karnafully Rayon Complex (KRC) include 0.35 ton of China clay and 4 tons of cellulose fibre daily along with other chemicals like mercury (Hg), black liquor (Na2 SO4 + Na2S + NaOH), acids and chlorine etc. The mercury loss from KPM and KRC is reported to be about 3,000 kg/year. This seems to be one of the most noteworthy examples of pollutants draining into the Bay of Bengal via Karnafully River. Besides, cadmium from dyeing, printing and paint industries & arsenic compounds from Chittagong Urea Fertilizer Limited (CUFL) and chromium from tanneries in Chittagong are also entering the river and sea (Appendix-4). The estimated pollution loads of biodegradable organics in Chittgong area are summarized in Appendix-5.
A total of 165 industries are located in three industrial zones of Khulna namely, Khalispur Shiromony and Rupsha discharging wastes into the Bhairab-Rupsha River system which finally drains into the Bay of Bengal. Match factory, the Khulna ship yard and fish processing units from the Rupsha industrial area discharge their effluent directly into the Rupsha River. The Khulna newsprint mills, hardboard mills, the Goalpara Power station and some jute mills & steel mills from the Khalispur industrial belt discharge untreated wastes directly into the Bhariab River. Khulna newsprint mill continuously discharge nearly 4,500 m3/h of waste water containing high level of suspended solids (300–500 mg/L) and sulphur compounds. It has been estimated that suspended solids may account to 70 × 50,000 kg/yr.
Chromium wastes are discharged from Hazaribag tanneries which include about 160 units. The total quantity received by the Bhuriganga River from this source is about 4,000 m3/day. The maximum concntration of chromium in the Burhiganga River is about 6 u-gm/L.
Another major source of marine pollution is shrimp processing plants which are situated in Chittagong town, Cox' Bazar, Khulna Shatkhira, Patuakhali, Chandpur and Barisal. The shrimp head constitute about 37% of the total body weight of a shrimp, which is discarded. This amounts to be about 11,400 metric tons. Due to lack of dumping ground these wastes are thrown in different coastal water bodies including rivers and cannels.
2.3 MUNICIPAL WASTES:
In general human settlements in the coastal areas of Bangladesh do not have any domestic waste treatment facilities and therefore effluents either directly on indirectly find their way untreated into the rivers and hence to the Bay of Bengal. The populous coastal cities, Chittagong and Khulna, of pollute considerably the marine environment with municipal wastes.
MUNICIPAL WASTES IN CHITTAGONG CITY:
Due to lack of proper sanitation and waste collection facilities, sewage and solid wastes from all over the city find their way into the Karnafully River through 5 canals (Appendix-6). About 480 tons of solid wastes generated daily and excreta of about 2.5 million people contribute to create this problem. The collected solid wastes are dumped in two dumping grounds adjacent to the Karnafully River estuary. The city has about 50,000 sanitary latrines, 24,000 service latrines and 3 public toilets. The excreta collected by the municipalty are stored in 5 large septic tanks for 2 months and then discharged into the canals or rivers.
Considerable amount of blood and viscera of about 400 slaughter animals from Feringhee Bazar and Dewan Hat slaughter houses find their way daily into the river Karnafully. It is estimated that total BOD load coming into the Karnafully River from Chittagong city is 3.5 tons/day which may increase to more than 5.5 tons/day by the year 2000. It has been recorded that about 18,000 coliforms/100 ml are present in the polluted water of the Karnafully River estuary near sewage disposal areas, which is far higher than safe levels (0/100 ml for drinking 200/100 ml for bathing).
MUNICIPAL WASTE IN KHULNA CITY:
The are no saitation and collection facilities for municipal wastes for Khulna city. The raw and decomposed sewage and human excreta from slum area on both sides of the river in Khulna and Mongla enter the river Passsur and hence to the Bay of Bengal. The domestic waste load in Khulna and Mongla port areas was estimated to be approximately 2.2 tons BOD/day.
MUNICIPAL WASTES IN DHAKA CITY:
Dhaka sewage treatment plant has a capacity of 20 million gallon per day (mgd) which is not adequate for the amount Dhaka city generates. The quality of solid wastes produced daily in the city varies between 1500 tons in dry season and 2000 tons in the rainy season. The pollution load of human excreta was estimated to be 250 tons/day in 1988 and it is assumed that it might increase upto 490 tons/day by the year 2000. The average BOD of Dhaka city sewage is around 180 mg/L. The Department of Environment indicates zero D.O. and high BOD ranging between 50 and 150 mg/L in the Buriganga River. The counts of faecal coliforms (FC) and faecal streptococci (FS) in the Buriganga River ranged between 1.3 × 10⁴ to 2.4 × 10⁶ and 2.7 × 10³ to 3.1 × 10⁵ /100 ml respectively. Ratio of FC and FS was always above 4.0, indicating pollution by human excerta and thus the water of the river is not suitable for human use. The faecal contamination of rivers and estuaries is considered as one of the serious environmental problem for Bangladesh as it spreads water-born diseases to coastal inhabitants who use the polluted water for drinking, bathing and swimming.
2.4 AGRUCULTURAL WASTE:
The total amount of fertilizers used at present in Bangladesh is 2043 tons/year, which is increased by 124% over the last four years and 392% since 1977. 20 insecticides, 18 fungicides and 2 rodenticides are being used in our agriculture and public health sector. It has also been reported that the number of registered rice pesticides was 66 upto Feb. 1989 excluding fungicides and rodenticides. However, another estimate showed 253 registered pesticides for agriculture and 85 for public health available in the market of Bangladesh. At present, the total amount of pesticides used annually in the country is about 7200 tons.
Pesticides and fertilizers are dumped or washed away by rain & water into the river systems and ultimately find their way into the sea. It is assumed that 25% of the total amount of pesticides used may reach the coastal water and causes pollution of seawater Apeendix-7). Therefore, the pollution load in the Bay of Bengal in the form of pesticides residue maybe to the tune of about 1800 tons/yr.
The insecticides, D.D. is extremely insoluable in seawater and it takes 1000 tons of water to dissolve a few grams of commercial D.D.T. It affects the photosynthetic capacity of certain algae & thereby interferes with the primary productivity in the sea. It is reported that population of many predatory birds drastically reduced because of the accumulation of D.D.T. in their body fat. This interferes with reproduction. At high concentration the DDT affects the growth, and reproduction of fish and invertebrates. Use of 2–5 ppm D.D.T. per gram body weight to shrimp, crabs, estuarine fish in their food cause 30–100% mortality within 2–10 weeks.
2.5 MANGROVE DEFORESTATION AND SEDIMENTATIN:
Mangrove deforestation has increased the rate of erosion along parts of the coast of Chakaria Sundarbans and Khulna Sundarbans. Mangrove ecosystems throughout Chakaria and Khulna Sundarbans are increasingly being affected by human activities (Appendix -8). Deforestation, having rainfall and natural calamities such as cyclones, tornado, tidal bore etc., cause erosion of soil. Particularly during rainy season these eroded soils are carried to the sea and cause serious pollution problem, the annual load carried in suspension by three river (Ganges-Brhamaputra-Meghna) systems is estimated to be around 2.4 billion tons.
2.6. SOLID WASTES:
Use of non-biodegradable plastic products such as plastic shopping bags, disposable syringes, bowls, nets. PVC nylon ropes, packing items etc. are increasing day by day and causing pollution in the country. In the Dhaka city alone there are nearly fifty plastic factories which produce about 7 to 7.5 millions polythene bags daily. It is reported that plastic bags and other products are also dumped directly in the Chittagong and Mongla port areas. Plastic is as harmful as the oil spillage to marine biota. In the USA about 10,000 marine animals and 1 million birds die every year due to the plastic pollution in the coastal area.
The author recommends the following points to be taken into consideration for prevention of marine pollution of Bangladesh.
Facilities for proper discharge and treatment for oil and oily substances should be developed in the Chittagong and Mongla ports.
A coastal guard system be introduced to detect disposal of waste products and oil spills.
The industrial effluents must be treated economically in such a way that they should not pollute the receiving environment.
Sewage treatment plant should be installed in Chittagong and Khulna cities immediately.
Suitable monitoring systems should be established to prevent pollution.
3. APPENDICES (1 TO 8)
Appendix -1: Oil and oily substances in the Chittagong area.
| Oil and oil emulsion source | Estimated amount of discharge |
| Chronic spillage of crude oil during transportation operations at Chittagong Port. | 6000 metric tons/yeara |
| Ballast waters | Not known |
| Bilge waters | 2.4 million gallons/year |
| Leakage loss of fuel oil from mechanized vessels, dry docks, fish harbours, etc. | Not known |
| Oil emulsion from workshop | Not known |
| Crude oil residue, process oil and wash water from refinery | 50000 metric tons/years |
| Refuse oil from ship-breaking activities near Fauzardarhat | 400 kg/year |
a Assuming 0.5% transportation during crude oil transfer at Chittagong Port.
Appendix-2: Categories distribution of the polluting industries of Bangladesh.
| Industry | Number | Industry | Number |
| Textile Industries | 298 | Chemical Industry | 23 |
| Tanneries | 176 | Sugar Mills | 16 |
| Pharmaceutical Industry | 166 | Paper and Pulp Industries | 5 |
| Jute Industries | 92 | Fertilizer Industries | 5 |
| Iron and Steel Mills | 57 | Distilleries | 3 |
| Rubber and Plastic Industries | 34 | Cement | 3 |
| Insecticides and Pesticides | 25 | Total | 903 |
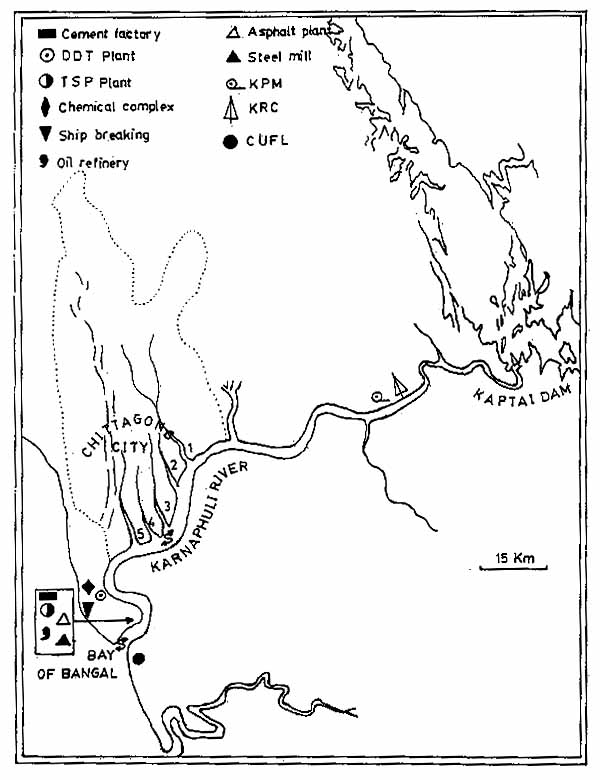
Appendix - 3: Enlarged view of the Karnafully River-estuary showing location of the important source of pollution on its bank.
Appendix-4: Estimated amount of insoluble inorganics entering the water
| Insoluable Inorganic | Probable discharged directly or indirectly to coastal waters in Chittagong | Conc. Level in ground water in Chittagong (ppm) | Conc. Level in surface water and in Bay of Bengal (ppm) | Standard allowable concentration (ppm) |
| Mercury | 500 kg/year | 0.05–0.27 | 0.010 | |
| Lead | 0.50–21.8 | 0.025 | ||
| Chromium | 220 | 0.050 | ||
| Arsenic | 0.015 | |||
| Cadmium | 0.3–2.9 | 0.015 | ||
| Si | 1.9–12.12 | - | - | |
| Al | 0.53–2.32 | - | - | |
| Fe | 0.91–3.42 | 2.62–5.8 | 0.300 | |
| Ca | 3.20–25.2 | 5.20–23.2 | - | |
| Mg | 0.0–10 | 6.57–10.36 | 125 |
(Source; DOE, Cited in ESCAP, 1988)
Appendix-5: Estimated pollution load as Bio-degradable organics in terms of kg BOD/day in the Chittagong area.
| Industrial Zone | Pollution load (Kg BOD/Day) | ||||
| Pollution Source in Chittagong area | Total | Textile | Paper | Leather | Other |
| KARNAFULLY RIVER | |||||
| Kalurghat | 2500 | - | - | 1400 | 110 |
| Nasirabad/Sholashahar | 6400 | 800 | - | 4100 | 1500 |
| Patenga | 2000 | 200 | - | 1800 | |
| Kaptai | 5800 | 2550 | 2100 | 1150 | |
| BAY OF BENGAL | |||||
| Bhatiari | 1000 | 600 | - | 400 | |
| Kumira | 300 | 380 | - | - | |
| Barbkunda | 600 | 600 | - | - | |
| Fauzdarhat | 3200 | 2300 | - | 900 | |
| 218000 | |||||
| KARNAFULLY RIVER | |||||
| Domestic waste load from Chittagong City | 3500 | - | - | - | |
| BAY BENGAL | |||||
| Pollution load from domestic and industrial sewage from the south-estern part of the country through run-off along the Karnafully river system | 2000 | - | - | - | |
| Projected domestic waste load by the year 2000 | 5070 | - | - | - | |
| Projected load for Industrial sewage by the year 2000 | 2000 | - | - | - | |
Source : Chittagong Wastwater Mission Report, 1985 (Cited in ESCAP, 1988)
Appendix - 6: Chittagong City Corporation drainage system showing 5 main sewage canals (1. Chaktai, 2. Firringhee Bazar, 3. Monoharkhali, 4. Namuna Bazar and 5. Majhirghat canals) opening into the Karnafully River estuary.
Appendix-7: Estimated amount of pesticides and other persistant organicas used in agriculture in Bangladesh and probable pollution load in sea water.
| Persistant organis by types | Sales of pesticides throughout the country July 1984-June 1985 (tons) | Amount received by coastal water through river run-off (tons/yr.) | Direct discharge or duming in coastal water (tons/yr) | Estimate pollution in the Bay of Bengal (tons/yr) |
| Organomercural fungicides | - | - | - | - |
| Halogenated hydrocarbons | 40.6120 | 10.453 | - | 10.153 |
| Carbamates | 891.8050 | 222.950 | - | 222.950 |
| Polychlorinated biphenyls | - | - | - | - |
| Organo-phosphorous | 1991.2642 | 498.060 | - | 498.060 |
| Other toxic agro-chemicals | 74.3280 | 18.582 | - | 18.582 |
| DDT | 1038.0000 | 250.000 | - | 250.000 |
(Source : ESCAP, 1988)
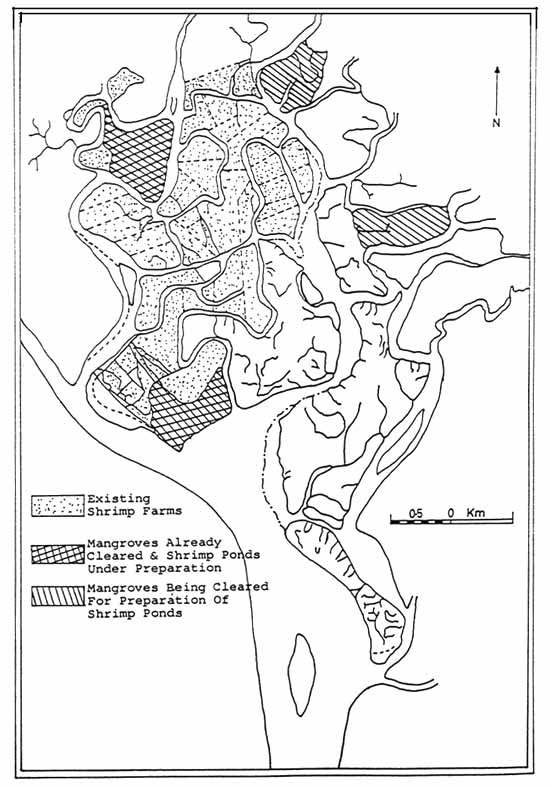
Appendix - 8
Showing temporal and spatial changes and destruction of mangroves as a result of rapid expansion of shrimp farming in the Chakatla Sundarbans. Traced from 1983 aerial photograph.
DR. V.R.P. SINHA
FAO/UNDP Senior Specialist, Fisheries Research Management
and Development
1. Introduction
The purpose of the monitoring programme is to provide the means for assessing the physical, chemical, biological and socio-economic impacts of fisheries activities. These assessments should provide a definitive picture of impacts of fish farming, and fisheries management processes on the external biological and socio-economic environment, plus the impact of these external factors on the fish farming and on the ecosystems.
The lectuer will confine on the environmental monitoring programme in the three ecosystems i.e. brackishwater, oxbow lakes and the reservoirs.
2. Environmental Monitoring Programme
2.1 Brackishwater
Since not much basic informations exist regarding this ecosystem, collection of baseline informations on the estuarine and coastal environment; status of water, aquatic fauna and flora plus land-use patterns in the adjacent populated areas become essential. Similarly assessing socio-economic status of fisherman and farmers in the boardering villages, blocks and districts, prawn and fish marketing structure and trading practices need to be incorporated in the base line study.
2.1.1 Estuarine Water Quality Monitoring
Water quality assessment of estuarine and seawater in terms of physical parameters such as temperature and suspended sediments, and; chemical parameters such as salinity, pH, nitrates, organo-phosphates and sulfides, plus biological and chemical oxygen demand are essential.
Heavy metal and pesticide residues need to be monitored in the water, sediment and food chain by measuring the levels of zinc, mercury, copper, phenols, cyanides, CHC and DDT. In addition to water samples, tissue samples from bivalve and gastropod molluscs should be collected for analysis since these organisms bio-accumulate pesticides and toxins, and are traditional foods for shrimp. If their level reach beyond the accepted norms it will hit the total shrimp export industry
2.1.2 Biological environment
The biological environment should be assessed through the measurement of phyto and zooplankton biomass, macrophyte biomass, planktonic species diversity, macroinvertebrate population and biomass, fish species composition, and total faecal coliform density of the surrounding estuary and coastal waters.
2.1.3 Socio-economic environment
The assessment of socio-economic environment should involve the following: farmer and fishermen population, including family structure, gender analysis, income levels, ownership rights to land, and alternative employment opportunities. Public services such as power, communication, potable water, sanitation, health care and education facilities need to be known. Marketing patterns, including harvest and sale, role of middlemen, market demand in local and seasonal terms, processing capacity for shrimp crops, transport facilities, and pricing/profit sharing policies to be recorded. Assessment is essential of community structure, including the role of cooperative societies and local self government along with financial support, including credit facilities, leasing policies and funding agencies.
2.1.4 Monitoring of Mangrove disruption
The destruction of mangrove in estuary ranks alongside the destruction of seed populations as one of shrimp farming's greatest environmental risks. It is therefore, vital to establish baseline estimates for mangrove forest cover. Such information will provide the guideline of controlling mangrove deforestation if the semi-intensive culture of shrimp undergoes rapid expansion.
Due to the inaccessibility of most mangrove areas for survey work and the sketchiness of information about mangrove, it is recommended that remote sensing exercises should be undertaken to get the full details of the mangrove.
2.1.5 Monitoring of shrimp seed and other fish seed
It is estimated that the species composition of seed catch from the wild comprised of only about 2% of tiger prawns (Penaeus monodon) postlarvae. The remainder of the “non-desirable” crustacea and finfish seed are usually cast upon the shore to perish for lack of any perceived value. Although of little direct use to the shrimp farmers many of these organisms could have entered the economically important fisheries populations (e.g. Clupeid, Sciaenid and Liza spp. finfish) upon maturity. This massive loss of recruitment stock will ultimately degrade the capture fisheries.
2.2 Environmental Monitoring Plan for oxbow lakes
While the informations on ecological status of soil, water, aquatic biology, fauna and flora and land use pattern are essential, it is also important to monitor the lake ecosystem, its catchment and drainage along with socio-economic changes taking place. Thus, it is important that the following programmes need to be undertaken.
2.2.1 Assessment of Site Environment
Lake morphometry and location in terms of situation, area, volume level fluctuation, water balance and evapotranspiration along with micro-climate, precipitation, and weather data need to be collected. Community water use to be assessed interms of fishery, domestic use, waste disposal, jute retting and recreation.
Data on land use management, percentage coverage of agriculture, horticulture, dairy and poultry, forage cultivation, cottage and small scale industry, and forestry are essential to see the trend of change which would eventually take place.
2.2.2 Water Quality Monitoring
Physical parameters should involve transparency, thermal structure whereas chemical parameters should have data on pH, alkalinity, hardness, specific conductivity, Nitrate-N, Phosphate-P, BOD and COD.
The sediment parameters should include granulometry, pH, organic carbon, total and available P, total and available N.
2.2.3 Heavy metal and Pesticide Residues
Heavy metal and pesticide residues interms of zinc, mercury, arsenic, phenols and cyanides, CHC, DDT, and Endosulfan are essential to be known and their quantitative assessment should be made in water, sedimant and in food chain.
2.2.4 Aquatic environment
Biological parameters should include plankton biomass, macrophyte biomass, species diversity and other indices such as macroinvertebrate population, fish species composition/ reptiles & mammals, and the faecal and coliform population. It is also desirable to take up chlorophyll and primary production estimations.
2.2.5 Terrestrial environment
Terrestrial environment assessment should include grassland and forest succession, cropping pattern, production trends, fertiliser and pesticide usage and census of wild and domestic animals in the beel catchment. Monitoring of pesticide residues in crops, dairy and meat products, and soil characteritics is needed.
2.2.6 Socio-economic environment
Socio-economic parameters assessment should include, farmer and fishermen population, family structure and sex ratio, income levels, ownership rights of land holdings, boats, nets etc. and alternative employment avenues. Also information are essential on amenities of power, communication, water supply, sanitation and health care and education.
Marketing pattern assessment should include harvest and sale, middle men intervention, market demand, local, distant, seasonal market, facilities for preservation/icing of fish crop, transport, pricing policy and profit sharing.
Community structure is also to be assessed interms of cooperative societies, village union parishad, financial support, leasing policy and funding agencies.
A schedule of technical programme for monitoring is shown in Appendix 1.
2.3 Reservoir Fisheries
Reservoir fisheries enhancement normally presents the least environmental risk unless intensive penculture or cage culture is undertaken. This is because of the relatively low water productivity and few direct management inputs. Such inputs normally involves annual stocking of major carp, which under most conditions could establish breeding populations and obviate the need for further stocking.
Environmental concerns that can arise will principally consist of degraded water quality from increased settlement or agriculture in the lake watershed. Another point of concern is that that most reservoirs are under the control of other Departments than fisheries department which will be the ultimate decision making authority. Conflicts between the irrigation needs of downstream farmers and the need for fisheries management could create hardship on the growing numbers of fishermen who have settled in the lake vicinity. However, routine monitoring of water quality of the reservoir need to be done as well as of the socio-economic status of the people in the area.
Minimal basic productivity parameters should be profiled on an annual basis. Parameters to be measured should include physical measurements such as transparency and thermal structure, and chemical parameters such as pH, alkalinity, hardness, conductivity, nitrates, organo-phosphates, plus biological and chemical oxygen demand of both the water column and interstitial water of bottom muds.
Biological productivity parameters should be assessed through phyto and zooplankton biomass, macrophyte biomass, species diversity, macroinvertebrate population and biomass, and fish species composition.
2.4. Data Collection
All the above data may be collected at suitable intervals and at suitable sites depending mostly on the site specific requirements. However, physico chemical date should be collected as far as possible seasonally. Date on social environment may be collected once a year or so.
3. Remarks
The changes taking place in the fisheries sector especially because of flow control structures besides lands reclamation for agriculture, brackishwater aquaculture, human settlement, construction of roads, etc. have rendered the fragile aquatic ecology most vulnerable, leading to soil erosion, pollution, loss of mangrove, forests and bioproductivity.
Monitoring and evaluation of the environmental changes at regular intervals will be necessary to understand the impact, and identify suitable corrective measures, wherever necessary.
The computerised GIS utilising the satellite imagery maps and ground data collected/generated by conventional surveys should be utilized to provide a quick, reliable and structured information for assessment and evaluation of environmental impact for planning action programmes to ensure sustainability of the aquatic ecosystem.
Appendix 1
TECHNICAL PROGRAMME FOR MONITORING
A. Ox-bow Lake
| Investigation | Sampling site/schedule | |
| 1. | Site Environment Monitoring | |
| 1.1 | Lake morphometry and location: | Annual |
| Lake situation in rural, semi-urban and industrial belt with varying degree of biotic pressure. | ||
| Area, volume level fluctuation, water balance and evapotranspiration. | ||
| Micro-climate, precipitation, weather data. | ||
| 1.2 | Community water use: | |
| Fishery | ||
| Domestic use | ||
| Waste disposal | ||
| Jute retting | ||
| Recreation | ||
| 1.3 | Land use management | Annual |
| % coverage of agriculture | ||
| Horticulture | ||
| Dairy and poultry | ||
| Forage cultivation | ||
| Cottage and small scale industry | ||
| Forestry | ||
| 2. | WATER QUALITY MONITORING | |
| 2.1 | Physical parameters | Summer, monsoon & Winter (Littoral, pelagic inflow, outflow zones) |
| Transparency | ||
| Thermal structure | ||
| 2.2 | Chemical Parameters | Summer & winter |
| pH | ||
| Alkalinity | ||
| Hardness | ||
| Specific conductivity | ||
| Nitrate-N | ||
| Phosphate-P | ||
| BOD and COD | ||
| 3. | SEDIMENT PARAMETERS | Summer & winter |
| Granulometry | ||
| pH | ||
| Organic carbon | ||
| Total and available P | ||
| Total and available-N | ||
| 4. | HEAVY METAL AND PESTICIDE RESIDUES (in water, sediment and food chain) | Summer & winter |
| Zinc, mercury and arsenic | ||
| Phenols and cyanides | ||
| HCH, DDT, Endosulfan | ||
| 5. | BIOLOGICAL PARAMETERS | Summer & winter |
| Plankton biomass (Phyto and Zoo) | ||
| Macrophyte biomass | ||
| Species diversity and other indices | ||
| Macroinvertebrate population & biomass | ||
| Fish species composition/reptiles & mammals | ||
| Total fecal and coliform population | ||
| 6. | CHLOROPHYLL AND PRIMARY PRODUCTION ESTIMATIONS | Summer & winter |
| 7. | TERRESTRIAL ENVIRONMENT | |
| Grassland and forest succession, cropping pattern, production trends, fertiliser and pesticide usage along ox-bow lake catchment | Annual | |
| Census of wild and domestic animals in the catchment Monitoring of pesticide residues in crops, dairy and meat products | ||
| 8. | CORRELATING GROUND DATA WITH SATELLITE IMAGING TO MONITOR CHANGES IN (if possible) | Annual |
| Macrophyte cover | ||
| Chlorophyll/pigment distribution | ||
| Biological stocks and biomass | ||
| Siltation and geomorphology | ||
| Forest cover and vegetation | ||
| 9. | SOCIOECONOMIC PARAMETERS | |
| 9.1 | Farmer and fishermen population | Annual |
| Family structure and sex ratio | ||
| Income levels | ||
| Ownership rights/land holdings/ boats nets etc. | ||
| Alternative employment avenues | ||
| 9.2 | Amenities | |
| Power | ||
| Communication | ||
| Water supply | ||
| Sanitation and health care | ||
| Education | ||
| 9.3 | Marketing pattern | |
| Harvest and sale | ||
| Middle men intervention | ||
| Market demand, local, distant, seasonal | ||
| Preservation/icing of fish crop | ||
| Transport facilities | ||
| Pricing policy and profit sharing | ||
| 9.4 | Community structure | |
| Cooperative societies | ||
| Village panchayats | ||
| 9.5 | Financial Support | |
| Leasing policy | ||
| Funding agencies | ||

![]()
![]()