![]()
![]()
![]()
by
S.R.A. Tillo1
ABSTRACT
Constructed in 1974, the present saltwater system of the SEAFDEC/AQD Tigbauan Research Station (TRS) consists of five pumps, two sump pits, a buffer, sedimentation and filtration treatment system (BSF), an intake pipe, and a distribution system. Two pumps operate at a time, one to bring in water from the sea to the BSF and the other to pump filtered water to distribution lines. Backwashing is provided. The pumps are operated 24 hours a day. Distribution lines are made of PVC pipes which are buried to protect them from direct sunlight. For even pressure, closed loop pipe connection is employed. Preventive maintenance undertaken to ensure continuous operation includes the intake pipe, sump pits, BSF, pumps and distribution lines. Construction of a similar system is expensive and maintenance cost is high. An intake structure patterned after the Underground Dr Concept is proposed as an alternative.
1. BACKGROUND
The saltwater system at SEAFDEC/AQD of the Tigbauan Research Station (TRS) was constructed in late 1974 to supply the life support system of the station as almost all of its research activities use seawater as culture medium.
At present, the saltwater system of TRS consists of five pumps, two sump pits; a buffer, sedimentation and filtration treatment system (BSF); an intake pipe from the sea; and a distribution system (Figures 1 and 2). Only two pumps operate at a time. The first pumps salt-water to BSF while the second pumps filtered saltwater to the distribution system.
2. OPERATIONS AND MAINTENANCE OF SYSTEM
Saltwater enters the first sump pit through the intake pipe consisting of two 200 mm (8 in)-diameter PVC pipe extended offshore (Figure la). Both pipelines are set one meter below the lowest water level and are held stable by a series of concrete sinkers with ends supported by guy wires or nylon ropes. The flow rate of saltwater in the sump pit depends upon the height of tide. Its flow rate increases when the water level increases or during high tide.
Before saltwater is pumped for distribution, it is first delivered to the buffer and sedimentation tanks and then made to pass through a rapid sand filter before being discharged to the second sump pit. Each sump pit is made of a 2 m diameter concrete structure cast in place with bottoms cemented and water-sealed to prevent freshwater intrusion.
The rapid sand filter is made up of layers of sand and gravel aggregate in which the sand layer is placed on top of the gravel aggregate (Figure 5). A provision for backwashing is made to remove sediments collected on top of the sand layer. The BSF is designed to filter suspended particles bigger than 30 microns.
1 Engineering staff, SEAFDEC/AQD, Tigbauan, Iloilo, Philippines
Backwashing of filter compartments is done one at a time so as not to totally cut off the supply of saltwater to the station. Back-washing could be as frequent as every hour during stormy weather or rainy days when the nearby rivers are flooded causing the saltwater to become turbid. During calm and sunny weather, backwashing is done once every shift of the operator.
In 1980 a test on the flow rate of the filter (BSF) was conducted by the Aquaculture Engineering Group of the Department. The data tabulated in Table 2 shows an average flow of 2.69m3/m/min for the newly back-washed compartment or a total of 10 m3/min.
The pumps are operated 24 hours a day.
Although its nameplate rating is 18.5 kw, the
actual load as observed is 11 kw. At this rate,
power consumption of the two pumps is
528 kwhr per day or  1 172.00/day at current
rates.
1 172.00/day at current
rates.
Any prolonged interruption of pumping operation adversely affects or ruins research activities. To prevent this, the other three pumps are made available as standby or spares in case the other pumps fail. The pumps in use are of centrifugal type made of stainless steel donated by the Government of Japan through the Japanese International Cooperation Agency and have the following specifications and capacity ratings:
| Type | = | FSH |
| Size | = | 125 mm × 125 mm |
| RPM | = | 1 750 |
| Power | = | 18.5 kw |
| Capacity | = | 1.10 m3/min at 42 m head |
| 2.30 m3/min at 31.5 m head |
The pumps, each costing 82 800.00 have
replaced the 20 000.00/unit C.1 pumps of
the system which have been used for nine years.
Operation of stainless pumps is observed to
be trouble-free and ideal for a saltwater system.
The saltwater distribution line is made up of PVC pipes. In the middle of 1980, revision of the distribution lines were undertaken. PVC distribution lines were buried to protect them from direct rays of the sun to prevent rapid deterioration. A closed loop system of pipe connection was employed so that there will be an even distribution of pressure.
Application of preventive maintenance program is imperative to the system. Each part of the system must be properly maintained to ensure continuous operation. The program as applied to the system includes the following:
Servicing of intake pipes to get rid of barnacles, green mussels and other marine growths that may clog the pipelines thereby reducing the seawater flow to the sump pit. This underwater job is done once a month by the Station's Special Underwater Action Team (SUAT) by means of a sewer rod with improvised cleaning tip/scraper (Figure 1b). Like-wise, inspection/repair of the pipe end supports is done to keep the pipelines intact during stormy weather.
Once a month servicing of the sump pit and excavating works is done to get rid of accumulated sand brought into the sump pit during stormy weather or when the saltwater is turbid. This clears the footvalves of the pump and prevents suction of sand that may damage the impeller of the pump.
Cost of servicing the intake pipes and the
sump pit varies from 550 to 650, for oxygen
supply, meals and overtime pay of the divers.
This excludes cost of repair of the pipe end
supports which require replacement of guy
wires or nylon ropes. The work is normally
completed within three days time.
Every six months servicing of the BSF
is done. The job includes cleaning of the sedimentation
tanks to remove deposits of sand
and other objects introduced during pumping.
Filter media of sand and gravel are replaced,
but before this is done, the new media are
cleaned by hydrochloric acid Maintenance
cost reaches up to 3 500 for labor and material.
Regular inspection of pumps and its electrical installations are conducted to anticipate breakdowns of equipment. Main sea-water lines are also regularly inspected to immediately repair leakages and stuck-up control valves.
Seawater shortage has become a problem of TRS since 1980. The increase or expansion of research activities at TRS had exceeded the capacity of the existing design of the system. The existing saltwater system has a maximum rated capacity of 2 400 m3/day. At this capacity, it is impossible for the system to cope with present requirements. In late 1982, a survey was conducted to determine the salt-water requirements of the station. Results are tabulated in Table 1 and show a daily requirement of 4 099.9 m3. The survey also revealed that researchers complained of weak water pressure.
Several efforts were undertaken by the Department to solve the saltwater shortage problem, but no positive results have so far been obtained. The innovations made on this regard are the following:
SWS system — This seawater filter and pump system was easily destroyed by strong wave action so that it is no longer existing.
Deepwell saltwater pump — This failed to meet the salinity requirements so that it was abandoned.
Offshore shallow well system — This also failed to meet the salinity requirements so that it was also abandoned.
3. FUTURE PLANS AND RECOMMENDATIONS
To construct an additional saltwater system similar to the existing one is expensive to maintain because it would employ double pumping. The intake pipes have to be regularly cleaned to remove barnacles and other marine growths that clog the line. There would be a need also for a filtration system the maintenance cost of which would also be high.
The construction of the proposed intake
structure (Figures 3 and 4) patterned after the
“Underground Drainage Concept” (Sunio,
Aqua Engineering) is being considered. The
proposed intake pipe structure will be buried
in the sea with a minimum covering of one
meter, wrapped with graded aggregate as filter
materials. The pipe cannot be colonized by
marine growth and other fouling organisms.
It is affected by oil spills and suspended matter
is removed down to 1.0 micron. Salinity is
not affected but ammonia and other pollutants
are oxidized by the biologically active layer
and there is some reduction in heavy materials.
Estimated cost of construction is 2.0 million.
This proposal, when realized, is expected to
supply a maximum of 6 900 m3/day of saltwater
to the station.
A problem expected in this proposal is the determination of the appropriate location of the intake structure. It was suggested that the intake should be located at a safe distance from the wave breaker zone due to tremendous underwater ground movement which can alter the placement of graded aggregate of the filter material. Thus, it is recommended that hydro-logical, geological and topographical survey of the area be done before implementation of the project.
A concerted effort to implement and logistical support to this proposal must be extended as it can be the solution to the problem of inadequate saltwater supply at TRS.
4. REFERENCES
Technical Memo AE 003, SEAFDEC Aqua-1980 culture Engineering.
Sunio, V. Proposed saltwater system of 1983 Tigbauan Research Station.
Vizcarra, A.T. Survey of saltwater require-1982 ments in Tigbauan Research Station.
Table 1. Saltwater requirements in Tigbauan Research Station as of November 1982*
| Building/facility | Flow-through RQMT (m3/min.) | Batch | ||
|---|---|---|---|---|
| RQMT (m3/day) | Time RQ'D | |||
| 1. | Hatchery I | 0.27 | 315 | 6–10 AM |
| 2. | Hatchery II | 0 | 400 | 3–7 PM |
| 3. | Algal tanks | 0 | 200 | 6–10 AM |
| 4. | Wet laboratory extension | 0.20 | 54 | 8–12 AM |
| 5. | Nursery pondsA | 0 | 408 | 1–5 PM |
| 6. | Wet lab | 0.01 | 16 | 8–12 AM |
| 7. | Natural feeds | 0 | 16 | 11–12 AM |
| 8. | Fish hatchery 8.1 Environmental labB | 0.53 | 0 | |
| 9. | Nutrition wet lab | 0.78 | 0 | |
| Total | 1.87 | 1407 | ||
| 2 692.8 m3/day | ||||
| Grand total RQMT | 4 099.8 m3/day | |||
Note: A - Proposed to be used for shrimps
B - Proposed to be used for milkfish
* - Prepared by Engr. A. T. Vizcarra
Table 2. Filter test data at the TRS saltwater system
| Time (Sec) | Sump pit level (m) | Flow rate m3/min) |
|---|---|---|
| 0 | 3.38 | - |
| 30 | 3.30 | 1.63 |
| 30 | 3.21 | 1.83 |
| 30 | 3.09 | 2.44 |
| 30 | 2.95 | 2.85 |
| 30 | 2.80 | 3.05 |
| 30 | 2.64 | 3.16 |
| 30 | 2.50 | 2.95 |
| 30 | 2.35 | 3.05 |
| 30 | 2.19 | 3.26 |
Average for 1 compartment = 2.69 m3/min
Average for 4 compartment = 10.76 m3/min
Figure 1. Existing saltwater pump system
Figure 1a. Saltwater intake system
Figure 1b. Improvised pipe cleaner
Figure 2. Existing saltwater distribution lines Drawn Not To Scale
Figure 3. Proposed seawater infiltration gallery
Figure 4. Seawater infiltration gallery
Figure 5. Buffer, sedimentation, infiltration treatment system (BSF)
by
Roque C. Sison1
ABSTRACT
The manufacture, storage, transportation and erection of precast components are discussed.
Its possible economical use in the construction of aquaculture structures is advanced.
1. INTRODUCTION
For a year and a half the writer experienced the use of precast concrete in combination with the traditional poured-in-place concrete in construction work. This experience was gained while at work with the engineering staff of the Societe Auxiliare D'Enterprise, a French company engaged in construction work. This company undertook the construction of housing units, school houses, public buildings and water reservoirs in the vast area of Taif, Kingdom of Saudi Arabia.
Observing the efficiency that was gained in the use of precast materials in the construction of the company's projects, it came to mind that indeed these products could be used in the fisheries industry with a difference.
Significant savings could be realized in the construction of storage tanks, fishpond dikes, water supply reservoirs and other structures that are necessary in the conduct of production and research and storage of fisheries produce.
Precast concrete is not a kind of concrete but a method of fabrication. It refers to reinforced or plain concrete members molded in space other than its final position. It is a method of fabrication where most of the work is done on ground surface.
Casting can be done right at the site of construction or on ground purposely organized for such fabrication.
Precasting can be a simple or complex task depending on the required volume or weight of the precast components. It may require only a small area of flat surface and minimal perimeter formwork and human strength to cast, handle and install the elements. In fairly large volume and heavy component production special formworks and equipment have to be used.
2. PRECASTING PROCEDURE
2.1 Fabrication
The job of prefabricating concrete elements may be broken down into four work classification:
Formwork — This work gives the structure to be cast, its needed dimensions, surface finish and configuration. The forms can be made of wood, steel or concrete or in their combination. They are designed for easy stripping and multiple reuse.
Reinforcing work — Reinforcing is a very important feature of precast fabrication. This aspect is concerned with reinforcing specification, dimension, configuration number and location of each piece of reinforcement material and the fixation of the pieces in their respective places. Special reinforcements may be included to take care of stresses occurring during the handling and erection of the elements.
Works on the embedded parts — The placement and fixation of items that need to be embedded in the element require attention. These usually include utility items like electrical conduits, junction boxes, plumbing pipes and items for handling the element such as lifting hooks.
Concreting works — This include the pouring of concrete into the forms, its compaction, surface finishing and concreting. In rush situations, rapid hardening process in curing may be employed.
1 Practicing Civil Engineer, 180-B Mayon Street, Quezon City, Metro Manila, Philippines
In large volume and heavy precast production the following activities have to be undertaken:
The cast forms are cleaned with tools adaptable to them. Usually flat steel pieces are used to scrape off concrete remnants attached to the forms while still fresh. Spraying oil on the form surfaces that will come in contact with the concrete will prevent the bonding between concrete and form material.
When the form has been readied, the reinforcing materials are laid out in it. Spacers are provided to keep the reinforcing materials from sticking out of the surfaces of the finished product.
Fixing the reinforcing pieces in place prevents displacement during concreting. All items to be embedded in the component should be fixed in place before this process.
The concrete is ready to be poured in. One of the many different ways to do this is the use of concrete mixers that mix the concrete components and lift the concrete bucket pouring the concrete into the forms.
The concrete mixture is spread out evenly, compacted and surface finished. Shovels, rakes, trowels, tamplers and vibrators are tools commonly used in this work.
Curing the concrete follows immediately. Rapid hardening process is usually applied to hasten the curing of the concrete. The process permits early stripping and reuse of the forms.
One method of curing entails the use of steam at controlled temperature and moisture.
To determine if the curing is completed, concrete samples are tested for the desired strength.
Stripping follows and the stripped off precast material is conveyed to storage.
The size of the crew and working space depends upon the organizational method of production. Of the methods the production line method and the stand method are the more popular.
In the highly mechanized production line method the element is moved through a series of positions for production while in the stand method, the element is stationary. The crew, equipment and appliances are moved from one element to the other.
2.2 Storage
Storage is another aspect of fabrication that has to be considered.
The storage area should present good working conditions and safe storage of the present components. The storage yard has to be levelled, compacted and provided with adequate surface water drainage. A loop pad for automobiles is laid out on the yard.
Articles stored are located as near as possible to the road. Passages are provided between stacks. Similar components are stored in one stack as this would eliminate future rearrangement of the components. The stored materials are marked and every stack is properly tagged.
If necessary enough components are stacked in reserve to ensure supply for continuous erection.
For the purpose of preserving the components and facilitation of slinging, wooden blocks called “sleepers” are placed under the bottom layer of the components and spacers between layers of components. The components should not rest on the lifting lugs of another underneath. The sleepers and spacers should lie in one vertical line.
The components are stacked in working position, with the lifting lugs up, eliminating their turn-over and facilitating slinging and handling.
2.3 Transporting components
From the storage area the precast articles are transported to the construction site.
During the loading, the load capacity of the vehicle is optimized. The articles are so positioned on the vehicle platform that the axle loads be as equal as possible.
The articles generally are loaded and transported in their working positions. They are secured with ropes, clamps and other security materials.
Rubber lines on the wooden spacers are useful in preventing the articles from slipping.
The transport vehicle should be capable of delivering the articles in good condition. The vehicles, especially those intended for transportation of long size articles have rigid frames, spring suspensions and turning arrangements to preclude the transmission of transportation stresses to the articles. Truck trailers, panel carrier trucks, heavy-duty trailers pulled by prime movers are some of the commonly used transportation equipment.
The articles delivered are stored within the construction site or are taken from the trailer straightaway to the structure being erected. The erection from the transport is called “off the wheels”. This eliminates storage and a number of handling operations, but it requires a well coordinated action of the erection, storage and transportation crews.
In the “off the wheels” method, when the articles are erected as soon as delivered, without storage on the construction site, it is recommended to employ light-capacity panel carrier trucks and trailers each accommodating one or two articles. A heavy flow of articles to the site greatly extends the idle time of the vehicles waiting to be unloaded.
3. INSTALLATION OF PRECAST COMPONENTS
Before the erection proper can begin, the precast place of installation has to be prepared.
The preparation of the place of erection involves the following tasks: establishing the exact location and elevation of the precast element, preparation of the surface by grouting or concreting and preparation of material for its fixation.
After the preparation work, the erection proper may now begin comprising of the following operations:
Preparation of structures for erection, which comprises of inspection of the structures for quality and for presence and correctness of the appropriate axial and checkmarks; straightening of loops, clamps and other protruding parts; provision of all the necessary erection appliances;
Pre-assembly of the structures (if specified by the design), e.g., assembly of separate elements into trusses; slinging of the structures to be erected, i.e., fixation of slings or spreader bars to the structures being erected, preferably in the position in which they will be assembled in the building.
Conveyance of the structures to the place of erection; structure installation and temporary fixation; unslinging of the structures; bringing the structures into their design positions; welding and concreting of the joints; removal of erection appliances.
The prefabricated reinforced-concrete structures must be erected in strict compliance with the sequence of the erection process thus ensuring stability and strength of the erected parts at all stages of erection.
The convenience of erection, terms and costs of erection jobs greatly depend on proper selection of the erecting equipment. The design and performance characteristics of the crane are chosen in accordance with the conditions of work at the construction site involved.
4. PROJECT MANAGEMENT
4.1 Management
Major jobs or tasks may require different types of management and organization. Decisions cannot be made in isolation from other decisions. Organization cannot be patterned along conventional functional lines. These jobs call for project management and project organization.
A project is a package of interrelated elements:
Objectives, goals and end products
Activities, or things to be done
Resources, or what will be used
Constraints, or conditions outside the project manager's control
The project manager is concerned about the following management problems:
Strategic planning — Each project has certain objectives or end products. These have to be carefully defined. There should also be certain performance criteria which the project manager would try to conform to, and if possible, optimize.
Operational planning — The determination of what has to be done in order to meet the project's objectives or produce the desired end products. The particular sequence in which the various activities should be undertaken has to be determined.
Resource allocation — Resources have to be allocated to the different operating units that will perform the various activities. Better patterns for allocating these resources have to be found. In certain cases, project objectives may have to be modified.
Scheduling — Specific calender dates have to be assigned to the performance of activities and utilization of resources.
Control — The operating units will not always conform exactly to plans and schedules. The project manager will have to note deviations and direct changes that may have to be made to follow the plan. Actual performance may deviate from projected performance. The manager will have to evaluate the significance of these deviations and to investigate the possible causes.
For years managers have depended on the conventional bar chart for construction, production, and program management. At best, it is a shaky tool for rough scheduling. Precise sequential relationships among activities are not shown. Due to lack of detail, costly omissions are common. Slack is not indicated and critical activities are not identified.
PERT1 and CPM2 were developed to overcome these faults. These tools require the planner to define precise sequential relationships. Network models clearly indicate these relations. Critical-path analysis indicates project duration and event times, measures slack and pinpoints the critical activities. Possible budget or schedule problems are anticipated. More sophisticated versions of PERT or CPM enable the manager to determine the most effective use of facilities, equipment and manpower.
4.2 Networking and critical-path analysis
Networking and critical-path analysis are the core of both PERT and CPM. Networking is the principal planning tool used to bring out the complex interrelations among project activities and restraints. The network model summarizes the project and relations that could lead to unnecessary costs if not spotted with ample time.
The basic elements of the network model are:
Activities, tasks or jobs
Restraints, or conditions not within the manager's control
Dummies or artificial activities introduced to clarify sequential relations
Events or points marking the beginning or end of an activity.
1 Program, Evaluation and Review Techniques
2 Critical-Path Method
The most common graphical presentation of the network model is the arrow diagram. The arrow diagram represents activities and restraints with solid arrows, dummies as dashed arrows and events by circles or nodes.
The network model represents each activity with a unique arrow; each activity has only one preceding event and one succeeding event. An event does not take place until all activities leading to it are completed. An activity can only start after the event from which it originates takes place. Activities follow, precede, or are concurrent with other activities. Each project starts with a unique event; similarly, it terminates with a unique event.
It is possible to trace a number of paths from the start event to the end event. These chairs of activities and events are called network paths. Given time estimates for individual activities, the length of each path is determined by summing up the individual activity times of all activities on the path. The longest path is called the critical-path. The duration of the project is determined by the length of the critical path. Activities that lie along this path are identified as the critical activities. It is interesting to know that if the objective is to compress project duration, some critical activities will have to be expedited. No amount of expediting or overtime applied to non-critical activities will result in a shorter project duration unless the critical path is also compressed.
The appropriate use of precast elements complementary to cast-in-place concrete elements can give considerable savings and can shorten the construction time. This is primarily because of economics in the cost of forms. Working on the ground with all the needed equipment within easy reach, and the multiple use of forms is far easier than building forms when all these operations must be done above ground. Some activities in the critical path using cast-in-place concrete can be done simultaneously with other activities in the same path using precast concrete. Shortening the critical path will lessen the construction time.
To illustrate, let us take up an example of a reenforced concrete structure project using: (a) cast-in-place concrete, and (b) precast concrete:
EXHIBIT A
Cast-in-place concrete
Cost breakdown
I. Carpentry materials
Roof:
| Dimensions | 0.15×4.2 × 4.2 m | |
| Number of elements | 1 | |
| Concrete volume | 2.65 cubic meters | |
| Plywood quantity | 2.65 × 3 pcs/cu m = 8 pcs 3/8 × 4' × 8' | |
| Form lumber quantity | 2.65 × 200 board feet/ cu m = 530 bd. ft. | |
| Scaffoldings | 75 bd. ft. | |
| Cost of materials: | ||
| Cost of plywood | 8 pcs ×98.00/pc = | 784.00 |
| Cost of form lumber | 605 bd-ft ×5.50/bd.ft = | 3 328.00 |
| Total | 4 112.00 | |
| Walls: | ||
| Dimensions | 0.15 × 3×3 m | |
| Number of elements | 4 | |
| Concrete volume | 1.35 cubic meters | |
| Plywood quantity | 1.35 cu m × 3 pcs/cu m × 2×4 = 33 pcs | |
| Form lumber quantity | 26 bd-ft/sq.m. × 18×4 = 1872 bd-ft. | |
| Bracings | 213 bd-ft. | |
| Cost of materials: | ||
| Cost of plywood | 33 pcs ×98.00/pc. = | 3 234.00 |
| Cost of form lumber | 2085 bd-ft ×5.50/bd-ft = | 11 468.00 |
| Total | 14 702.00 | |
II. Labor
Roof:
Man-hours 1.28 hrs/sq m × 17.64 = 23 man-hours
Cost of labor:
23 man-hours ×5.00/man-hour = 115.00
Walls:
Man-hours 1.59 hrs/sq. m. × 4 × 2 × 9 = 115 hours
Cost of labor:
115 man-hours ×5.00/man-hour = 575.00
Grand total of cost = Cost of materials + Cost of labor = 19 504.00
EXHIBIT B
Precast concrete
Cost breakdown
1. Carpentry materials
Roof:
For the dimensions, number of elements and concrete volume, please refer to Exhibit A.
| Plywood quantity | 8 pcs | |
| Form lumber quantity | 530 bd-ft | |
| Scaffoldings | 0 | |
| Cost of materials: | ||
| Cost of plywood | 784.00 | |
| Cost of form lumber | 2 916.00 | |
| Total | 3 700.00 | |
| Walls: | ||
| For the dimensions, number of elements and concrete volume, please refer to Exhibit A. | ||
| Plywood quantity | 1.35 cu m × 3pcs/cu m × 4 = 17 pcs | |
| Form lumber quantity | 26 bd-ft/sq m × 9 × 4 = 936 bd-ft | |
| Bracings | 0 | |
| Cost of materials: | ||
| Cost of plywood | 17 pcs ×98.00/pc | 1 666.00 |
| Cost of form lumber | 936 bd-ft ×5.50 bd-ft = | 5 148.00 |
| Total | 6 814.00 | |
II. Labor:
Roof:
Man-hours  × 18 =18 man-hours
Cost of labor:
18 man-hours × 5.00/man-hour = 90.00
Walls:
Man-hours = 0.58 man-hours × 9 × 4 = 21 man-hours
Cost of Labor:
21 man-hours × 5.00/man-hour = 105.00
III. Installation
| Equipment | No. of units | Daily rental |
|---|---|---|
| a) 5-tonner crane | 1 | 2 000.00 |
| b) 1-welding machine | 1 | 1 000.00 |
| 3 000.00 | ||
| Miscellaneous tools and materials | 1 000.00 | |
| Total | 4 000.00 | |
| Grand total of costs = Cost of materials + Cost of labor + Cost of equipment = 14 719.00 | ||
As illustrated precast concrete is lesser in cost and requires shorter construction time as compared to the traditional cast-in-place concrete.
Furthermore, it has been advanced that the construction of prefabricated instead of cast-in-place reservoirs reduces the term of construction three times and the cost of construction 40 to 50 percent less on an average. In addition, large panel house construction requires 35–40 percent less labor and 10–12 percent less expenditure than brick house construction, and the time of construction becomes twice shorter.
5. RECOMMENDATIONS
For the people in the field of aquaculture to look into the possibility of utilizing precast concrete in the constructon of their structures.
To establish a good communication environment between the people engaged in aquaculture and those in the precast concrete production. This will give them the chance to discuss their needs, capabilities, and limitations and hopefully arrive at a mutually profitable coexistence.
6. REFERENCES
Besser and Proskurnin, Erection of prefabri-1971 cated reinforced concrete structures.
Clarence W. Dumham, The theory and practice 1966 of reinforced concrete. McGraw-Hill.
D.F. Orchard, Concrete technology. 1962
Levin and Kirkpatrick, Planning and control 1977 with PERT/CPM. McGraw-Hill.
by
Alex V. Guevara1
ABSTRACT
The use of pre-cast gates started in 1981 in connection with the development of a freshwater fishpond in Nueva Ecija province. The advantages of using the pre-cast system are the following: minimal forms required, less wastage of aggregates, case in pouring of concrete, assembly line system of producing gates and structural members, minimum use of skilled workers and less direct supervision involved. Although there are constraints in this system, remedies can be provided to solve the problems.
1. BACKGROUND
Our use of pre-cast gates for fishponds was pioneered in mid-1981. This was in connection with the development of an inland freshwater fishpond at Sta. Rosa, Nueva Ecija province, Luzon, Philippines for the Crust Asian Resources, Inc. The project involved the conversion of 100-hectare riceland into a fish farm.
2. THE EXPERIENCE
One major item of work for the above-mentioned project was the construction of monk gates which were over a hundred in number. With the experience in the pre-cast modular type of construction for the housing industry, the choice of pre-casting the monk gates was immediately approved.
2.1 Advantages
Based on experience, the following are the major items to consider in deciding on the use of a pre-cast system:
Minimal forms required
Less wastage of aggregates
Ease in pouring of concrete
Factory type of producing gates and structural members
Minimum use of skilled workers
Less direct supervision involved
2.2 Problems and solutions
Some objectives were raised that due to the sizes and weights of components there would be difficulties in their installation. However, this problem can easily be remedied by adjusting the handling capability of each structural member. This is because the structural members can be broken into parts, hence, handling capability is easily adjusted to suit the needs.
A second objection raised is the difficulty of connecting components through welding process. This problem can be solved using appropriate panel connections. An example of this is shown in Figures 1 and 2. Figures 4–8 show details of structure of pre-cast water control gate.
3. FUTURE PLANS
It is intended to use pre-cast system of construction for a proposed fishfarm in Legaspi City, Albay (See location plan, Figure 3). The construction of the said farm will be based on the accompanying estimates and sketches.
3.1 GP Agro-Aqua Farms, Inc. cost estimates
(a) Slot panel — 4 pcs
| Vol. concrete | — | 0.185 cu m |
| Wt. of panel | — | 444 kg |
| Total volume | — | 0.814 cu m |
| Item | Qty | UM | Unit cost | Total cost |
|---|---|---|---|---|
| Cement | 8 | bags | 50 | 400.00 |
| 10 mm × 7.5 m | 6 | ea | 32 | 192.00 |
| Sand | 0.2 | cu m | 134 | 96.48 |
| Tie wire | 0.5 | kg | 20 | 10.00 |
| Ga. 8 wire | 2 | kg | 20 | 40.00 |
| Form lumber | ||||
2 in × 4 in × 10' | 4 | pcs | 32 | 128.00 |
2 in × 2 in × 10' | 2 | pcs | 16.32 | 32.64 |
| Assorted CW Nails | 0.25 | kg | 18 | 4.50 |
| 938.62 |
(b) 0.60 Panel — 16 pcs
| Vol. concrete | - 0.106 cu m |
| Wt. of panel | - 254.4 kg |
| Total volume | - 1.696 cu m |
| Item | Qty | UM | Unit cost | Total cost |
|---|---|---|---|---|
| Cement | 17 | bags | 50 | 850.00 |
| Sand | 0.75 | cu m | 70 | 52.50 |
| Gravel | 1.5 | cu m | 134 | 201.00 |
| 10 mm × 7.5 m | 10 | ea | 32 | 320.00 |
| 10 mm × 6 m | 16 | ea | 26 | 416.00 |
| Tie wire | 3 | kg | 20 | 60.00 |
| Ga. 8 wire | 8 | kg | 20 | 160.00 |
| Form lumber | ||||
2 in × 3 in × 10' | 6 | pcs | 24 | 144.00 |
1 in × 3 in × 10' | 6 | pcs | 14 | 84.00 |
| 2 287.50 |
(c) 0.40 Panel — 4 pcs
| Vol. concrete | — 0.25 cu m |
| Wt. of panel | — 600 kg |
| Total volume | — 1 cu m |
| Item | Qty | UM | Unit cost | Total cost |
|---|---|---|---|---|
| Cement | 10 | bags | 50 | 500.00 |
| Sand | 0.5 | cu m | 70 | 35.00 |
| Gravel | 1 | cu m | 134 | 134.00 |
| 10 mm × 7.5 m | 4 | ea | 32 | 128.00 |
| 10 mm × 6 m | 7 | ea | 26 | 182.00 |
| Tie wire | 1 | kg | 20 | 20.00 |
| Ga. 8 wire | 3 | kg | 20 | 60.00 |
| 1 059.00 |
(d) Top beam (Cast in place)
Volume — 0.5 cu m
| Item | Qty | UM | Unit cost | Total cost |
|---|---|---|---|---|
| Cement | 5 | bags | 50 | 250.00 |
| Sand | 0.22 | cu m | 70 | 15.40 |
| Gravel | 0.4 | cu m | 134 | 53.60 |
| Tie wire | 3 | kg | 20 | 60.00 |
| ½ Plywood | 4 | ea | 130 | 520.00 |
| Assorted CW nails | 2 | kg | 20 | 40.00 |
| 2 in × 2 in × 8' | 16 | pcs | 13 | 208.00 |
| 1 147.00 |
(e) Connection dry pack
Volume — 0.4 cu m
| Item | Qty | UM | Unit cost | Total cost |
|---|---|---|---|---|
| Cement | 4 | bags | 50 | 200.00 |
| Sand | 0.2 | cu m | 70 | 14.00 |
| Gravel | 0.4 | cu m | 134 | 53.60 |
| 267.60 |
(f) SUMMARY OF COSTS
| Materials | Total cost | |
|---|---|---|
| Slot panel | 4 pcs | 938.62 |
| 0.60 panel | 16 pcs | 2 287.50 |
| 0.40 panel | 4 kg | 1 059.00 |
| Top beam | 1 wt | 1 147.00 |
| Dry pack | 1 wt | 267.60 |
| 5 699.72 | ||
| Labor (25% of total material cost) | 1 424.93 | |
| 7 124.65 | ||
Figure 1. Panel to panel connection
Figure 2. Wall panel to floor panel connection
Figure 3. Layout of GP Agro-Aqua Farm
Figure 4. Pre-cast gate plan
Figure 5. 0.60 meter panel detail of pre-cast gate
Figure 6. 0.40 meter panel detail of pre-cast gate
Figure 7. Detail of top tie beam of pre-cast gate
Figure 8. Detail showing top tie beam connection gate
by
P.L. Torres, Jr.,2 W. Barros,2 S.J. Jaspe2 and L. Oniate2
ABSTRACT
Ferrocement was first used in the Department in fabrication of broodstock and hatchery tanks for shrimp. In 1981, the Capital Outlay Project at Leganes called for the design and construction of 210 gates, consisting of 2 main gates, 111 secondary gates and 96 tertiary gates. Of the secondary gates, 97 were designed using ferrocement, with 30 and 67 of the sluice culvert type, respectively.
Ferrocement gates were fabricated in panels at a central work station and assembled at site. Panel geometry was controlled such that it could be carried by two or three laborers. A standard mixture ratio of 1:2 (cement:sand) with minimum amount of water was used. Several reinforcing bars arrangement were used with a single layer of gauge No. 20 welded 12 mm × 12 mm wire mesh or chicken wire.
Construction cost appears favorable with respect to reinforced concrete gates but costs more than an equivalent wooden gates. After 3–4 years the ferrocement gates appear to be still functional. The potential is great with more improvements to be undertaken.
1 Full text of this paper has not been made available for publication
2 All staff of SEAFDEC/AQD at the time of Consultative Meeting
by
P.L. Torres, Jr., S.J. Jaspe, L. Oniate and A Silomenio1
ABSTRACT
With the increasing trend to use pumps in aquaculture operations, tests were conducted on push pumps with three different propeller types. Type 21, a stainless two-bladed propeller where the blades were aligned together to form the Letter “I”, was found capable of delivering 10 m3/min at zero head. It was also the most efficient. The Type 2S propeller which has two blades made of brass with the blades forming the letter “S”, was found to have the lowest efficiency and also gave the lowest discharge. The performance of Type 3 propeller which has three blades made of brass is intermediate between the two other types. Push pumps are effective alternative pumping system for aquaculture.
1. INTRODUCTION
Water pumping in Philippine aquaculture is not widely used due mainly to the extensive method of farming. For instance, the depth of culture water in milkfish culture is 30–50 cm and is generally tide-fed. It is however recognized that the capability of a fishpond system to change water at any time irrespective of tidal condition is critical in the operation of coastal fishponds. More and more fish-farmers are therefore employing pumps or are planning to install pumps in their fishfarms as a supplement to tidal flows. As the trend in aquaculture practice is to go intensive, the use of pumps will become more widespread in the near future. Thus, a study of pumping equipment is important to support new technologies in aquaculture.
Pumping conditions in fishponds are typically characterized by low heads and high discharge. Axial flow pumps or the propeller types are therefore best suited for these circumstances. The principles of propeller design are quite developed. However, the adaptation of this technology to practical uses in water pumping is not pervasive because requirements on cost fabrication and maintenance must be satisfied.
Push pumps are propeller pumps where the water is drawn out (pushed) from the drive end of the pump. Thai farmers widely use such pumps in their fishfarms or for irrigating their fields. In the Philippines, the Abesamis fishfarm employs one push pump for each of its production sections. The Abesamis push pump uses off-the-shelf components, such as a standard 5 or 7.5 hp motor drive, and propeller of small boats. The pump motor set is installed on bamboo floats. In Mindoro, large push pumps with about 1 m diameter propeller are used mounted on steel barges.
For the purpose of providing guides to selection of push pumps for use of medium-sized fishponds, tests were conducted on push pumps using three propeller blades commonly used in small boats.
The objective of this study is to test and evaluate the performance of a propeller pump designed and constructed using off-the-shelf parts.
2. MATERIALS AND METHODS
The set-up consists of a pump and motor unit fixed to a common carriage and mounted on float. The pump assembly consists of a propeller and tube. The tube is made of sewed supernylon canvas. Tube-ends corresponding to the intake and discharge points are provided with GI hoods. The propeller is set at the mouth of the intake hood while the discharge hood is fixed at the bottom flashboard of the pond gate. The discharge hood is equipped with a wooden check valve to prevent backflow when the pump is not in operation. The pump assembly is directly coupled through a stainless steel shaft 2.4 m long and 20 mm φ to an electric motor. The shafting is supported by three pillow block bearings and two brass bushings. A fulcrum between the motor and the pump assembly enables the carriage to incline, thus submerging the pump when in operation. The float is made of marine plywood, painted with epoxy enamel. The motor is rated at 7.5 Hp, 240 volts (3 phase), 21 amperes and 1 745 rpm. A sketch of the set-up is shown in Figure 1.
The set-up was floated in the water canal and anchored, and water was pumped into a pond for known dimensions. At intervals of 10 minutes, canal and pond water elevations were taken, and calculations on head and discharge and water power made. Computations on brake power were made by measuring input voltages and current to the motor by a clamp-meter and using handbook values of power factor and efficiency.
The three propeller blades tested were commercially available small boat propeller of 216 mm φ. Type 21 is a stainless steel two-bladed propeller where the blades are aligned together forming the letter “I”. The Type 2S also has two blades, made of brass, but the blades form the letter “S”. Type 3 propeller has three blades made of brass. Figure 2 shows the three propeller types tested.
3. RESULTS AND DISCUSSIONS
3.1 Head capacity relationship
The head-capacity curves of the pumps using the three types of propellers are shown in Figure 3. Linear regression reveals that maximum discharges of the pump corresponding to the type 21, 2S- and 3 propellers are 10.0, 6.7, 7.7 m3/min, respectively. At heads lower than 0.75 m the Type 21 propeller gives a greater discharge than Type 3, while for heads higher than 0.75 m the reverse is true. The Type 2S had low discharge in comparison to both Type 21 and Type 3. Considering that heads encountered in coastal fishpond aquaculture are generally below 1.00 m, it appears that the Type 21 propeller is the most appropriate for maximum discharge.
3.2 Brakepower and efficiency
Voltage fluctuations made calculations difficult for instantaneous electrical power inputs to the motor. However, since they did not vary appreciably during each run, electrical power inputs were averaged over the run. Then using handbook values of power factor efficiencies, the following were estimated for brake-power:
| Propeller type | Brakepower, KW |
|---|---|
| 21 | 2.26 |
| 2S | 2.35 |
| 3 | 1.92 |
Water power was calculated on the bases of discharge and head. Efficiency curves can therefore be estimated and are shown in Figure 4. Maximum efficiencies for Type 2I, 3 and 2S are estimated to be 28.8%, 26.9% and 19.9%, respectively. These efficiency values are believed acceptable considering that the propellers were not designed for pumps. Well-designed propeller pumps reached efficiencies of 70%.
3.3 Comparative performance with other pumps
The head-capacity curve of the Type 2I propeller was superimposed with the performance of a centrifugal pump and the IR RI Axial Flow Pump (Figure 5). It is evident that at low heads, i.e., less than one meter, the performance of the push pumps is very favorable, giving almost three times and ten times the discharges of the IR RI pump and a centrifugal pump, respectively.
3.4 Construction cost
The estimated construction cost based on current prices are as follows:
| Electric motor, 7.5 hp | 6 000.00 |
| Electrical | 2 354.00 |
| Carriage assembly | 2 357.00 |
| Nylon tube and GI hoods | 580.00 |
| Floatation, marine plywood styrofoam filled | 2 540.00 |
| Labor | 1 330.00 |
Say | 15 200.00 |
4. CONCLUSIONS AND RECOMMENDATIONS
The push pump as described is an effective pumping system alternative in aquaculture. Type 21 propeller gave the best performance.
Further work is needed on the design of; propeller most suited for the push pump system
Improvements of the push pump performance can be attained with the installation of guide vanes and the redesigning of the intake geometry.
5. REFERENCES
O'brien, M.P. and R.G. Folsom. Date n.a. pumps. Propelle Transaction of the American Society of Mechanical Engineers, Berkeley, Calif. p. 6.
Salazar, Godofredo and Edwin Calilung. Undated Axial-Flow Pumps. IRR Handout of the Agricultural engineering Training Program. The International Rice Research Institute p. 12.
Figure 1. Schematic diagram of propeller pump set-up
Figure 2. Types of propeller blades
Figure 3. Comparison of discharge capacities for three types of propeller blades
Figure 4. Efficiency curves for three pumps using different blades
Figure 5. Comparison of discharge of 21 propeller push pump with typical centrifugal pump and IRRI axial flow pump
by
P.M. Gavieta1
ABSTRACT
Roots blowers are used to meet aeration requirements at the Tigbauan Research Station (TRS) of the SEAFDEC Aquaculture Department in Iloilo. Air is delivered through a system of PVC pipes and plastic tubing attached to air cocks. Water depth aerated ranges from 0.15 m to 2.1 m. Diffuser aerators and air lift circulators are commonly used. Improvements made since the system was set up in 1974 include burying of PVC lines to prevent rapid deterioration from direct exposure to sunlight and adoption of a closed loop pipe system to achieve even pressure distribution. The aeration system is working well at present, but some improvements and modifications are being worked out. Studies and revisions proposed to further improve the aeration system are: determining rates of oxygen transfer occurring in culture tanks, segregating small tanks from big ones, installation of suitable air filters to eliminate contaminants, and exercise of vigilance in spotting leaks and defective outlets.
1. BACKGROUND
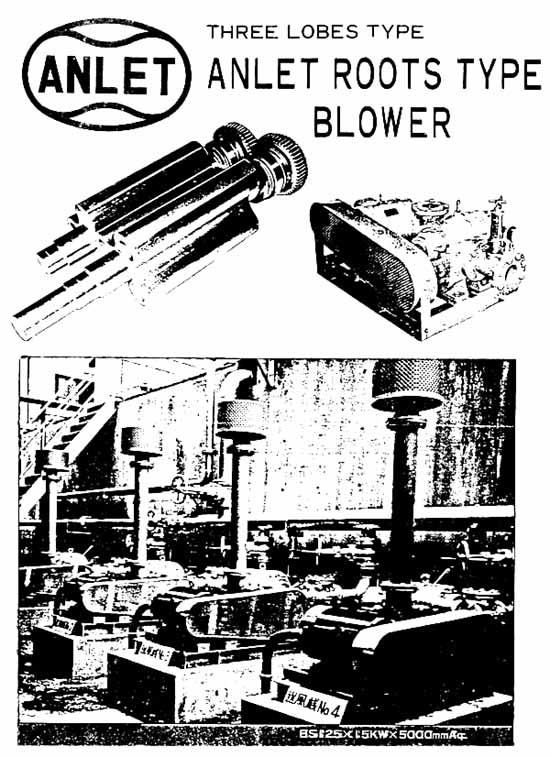
When the Tigbauan Research Station (TRS) of SEAFDEC/AQD started operation in late 1974, the aeration requirement was being supplied by two units BS 25 Anlet Roots Blower (Table 1 and Figure 3) installed at the pump house. Only one pump was operated at any time and the two pumps were operated alternately. This set-up was conceived with the idea of minimizing outages that would result to disruption of steady supply of air to various facilities. Interruption at that time was due mainly to power failure of the local electric cooperative.
Later, in view of expanded facilities and increasing research activities, another unit of BS 125 Anlet Roots Blower was installed at the side of roofed hatchery (Table 1) to augment the existing aeration supply. Even with the installation of additional blower, there were still numerous complaints of low air pressure.
2. STUDIES AND MODIFICATIONS OF SYSTEM
A survey was conducted by the Aqua Engineering group of the Department in 1980 and the results are tabulated in Table 2. In this survey, it was found that the depth of water being aerated ranges from 0.15 m used in aquarium experiments to 2.1 m in the hatchery. Fifty percent of the projects surveyed complained of low pressure. There was also a report of contamination especially at the phycology and finfish hatchery project (Tech. Memo No. AE-004).
In 1979, preliminary studies were started on the aeration system and the data on existing conditions were summarized (Table 3). Included in the data are confirmatory readings on May 15, 1980 which were found to be within the values found in 1979. Based on the results of the study, different combinations of operation of existing blowers were recommended to increase the pressures of air supplied to various facilities.
In early part of 1982, a BS 150 Anlet Roots Blower (Table 1 and Figure 4) installed near the wet lab extension was put in operation. There are three (3) unit models installed and originally it was recommended that two units will be operated in parallel but it was found out that operation of only one unit was enough to supply the aeration needs of the station.
1 Safety Officer, Aquaculture Engineering Unit, SEAFDEC/AQD, Tigbauan, Iloilo, Philippines
The station is now in a flexible position to meet its aeration requirements. Should there be a need for increased pressure, one BS 125 blower or two units of BS 150 blowers near the wet lab extension can be run in parallel for higher pressure.
Air is delivered to various laboratory outlets (Figure 1) through an air distribution system made up of PVC pipes. Air is introduced to the tanks through a plastic tubing attached to a plastic air cock which is opened when air is needed. In the middle of 1980, revision of the distribution line were undertaken. PVC distribution lines were buried to protect them from direct rays of the sun to prevent rapid deterioration. A closed loop system of pipe connection was employed in order that there will be an even distribution of pressure. Brass air cock outlets which were reported to get easily stuck up due to accumulation of salt were replaced with plastic air cocks. There were plenty of instances of unattended or abandoned air outlets which represented energy loss in the system.
There are two types of aerators most commonly used in the station. These are the diffuser aerator and the air lift circulator (Figure 2). The most common type of aerator used is the diffuser aerator (Figure 2a). This type injects air, either by air stones or perforated pipe into a body of water in the form of bubbles, and oxygen is transferred from the bubbles to the water by diffusion across the liquid film. In 1980, Ms. Candelaria Casalmir, a researcher of the Station, in investigating the aeration efficiency of perforated pipe found that it gave higher oxygen transfer rates compared with air stones in 1 000 liter and 400 liter capacity fiberglass tanks. She also found that a decrease in oxygen transfer rates occurred as the dissolved oxygen saturation levels were reached. The oxygen transfer rates in 400 liter capacity tanks were higher as compared with its values in 1 000 liter capacity tanks. She suspected that there is a reduction in liquid velocities and turbulence as the tank becomes bigger for a given aeration device.
The air lift circulator (Figure 2b) is a device developed at Galveston Laboratory in Texas and is now widely used in the station. It has a vertical chamber with an inlet slot at the bottom and a directional discharge slot at the water surface. When an air stone is placed inside the chamber near the inlet slot, the air forces through it. The resulting action is a laminar flow of water causing a continual turnover of water in the tank. An airflow of 8 liters per minute at a pressure of 0.98 kg/cm2 is sufficient for optimum circulation. The result is a water flow of 510 liters/min through the circulator at the maximum culture volume of 300 liters (Salser, B.R. and C.R. Mock, 1973).
3. FUTURE PLANS AND RECOMMENDATIONS
Since the operation of the BS 150 Anlet Roots Blower, no pressure readings at different locations similar to that made in 1979 was done. This effort should be undertaken and results shall become a basis for future decision making. The results can be used as a guide in determining whether there are increasing research activities or there are leaks along the line.
A study should be made to segregate small tanks from the big tanks. The present set-up of tank facilities shows that small tanks are placed alongside the big tanks and this set-up is disadvantageous to the big tanks. This often resulted in decreased pressure on the big tanks. For a start, until proper delineation has been determined, tanks with water depth less than one meter shall be considered low loads and tanks with water depth one meter or higher shall be considered as high loads. A more efficient distribution of air is expected with this concept.
Aerator selection for a particular system will depend on system characteristics, economics, aerator availability and other factors. Supersaturation should be avoided in culture systems because of the risk of gas bubble disease. As such, there is a need to determine the aeration requirement of the culture species. A study should also be done on oxygen transfer rate on different culture tanks most commonly used. Determination of these parameters will be of great assistance on future studies to be undertaken.
A study should also be done on appropriate air filters to be installed in order that dust and other harmful contaminants will be eliminated. Individual small capacity air filters may be installed on a case-to-case basis, at specific research outlets where better air quality is needed.
Lastly, the cooperation of all air supply consumers should be enjoined for them to fix defective air outlets or report the same to appropriate offices. Outlets should always be closed when not in use.
4. REFERENCES
Casalmir, C.M. 1980 Studies on aeration efficiencies in differently shaped tanks.
Salser, B.R. and C.R. Mock. 1973 Air lift circulator for algal culture tanks. Proc. World Aquacult. Soc. 4: 295–298.
SEAFDEC, 1980 Aquaculture engineering. Tech. Memo No. AE-004.
Wheaton, Frederick W. 1977 Aquaculture Engineering, John Wiley & Sons, New York. pp. 643–679.
Anonymous. Undated Anlet Roots Blower Manufacturer's Manual.
Table 1. Rating of installed Root Blowers
| Blower size | RPM | Pressure kg/cm2 | Volume m3/min | KW | Location |
|---|---|---|---|---|---|
| BS 125 (Anlet) | 1 230 | 0.235 | 13.75 | 11.84 | Pump house |
| BS 125 (Anlet) | 950 | 0.40 | 9.50 | 10.67 | Side of hatchery |
| BS 150 (Anlet) | 1 400 | 0.60 | 24.0 | 45 | Near wet lab |
Table 2. Survey data on condition of aeration of facilities
| Project | Location | Depth of water to be aerated (meters) | No. of aeration outlets (pcs) | ||
|---|---|---|---|---|---|
| Maximum | Usual | Maximum | Usual | ||
| Small hatchery (barangay) | Wet lab ext. | 2.00 | 0.60 | 200 | 100 |
| Seafarming | Wet lab ext. | 1.00 | 0.50 | 20 | 10 |
| Broodstock dev. project | Wet lab ext. | 1.30 | 0.80 | 93 | 49 |
| Nutrition and feed dev. | Wet lab ext. | 0.61 | 0.15 | 96 | 75 |
| Big hatchery | Open and close hatchery, Algal and nursery | 2.10 | 1.00 | 260 | 130 |
| Phycology | Wet lab | 0.76 | 0.178 | 224 | 130 |
| Ecology | Wet lab | 1.80 | 0.70 | 35 | 20 |
| Artemia | Wet lab | 1.00 | 0.80 | 40 | 25 |
| Fish hatchery | Canvas tanks | 2.00 | 1.00 | 90 | 50 |
| Milkfish broodstock | Canvas tanks | 1.20 | 0.70 | 70 | 46 |
| Nutrition and feed dev. | Feed lab | 0.61 | 0.15 | 113 | 80 |
| Pathology | Wet lab | 0.60 | 0.30 | 34 | 29 |
| Aqua eng'g. | Wet lab | 0.30 | 0.15 | 12 | 6 |
Table 3. Pressure readings at diffirent locations
| Point | Location | Pressure (kg/cm2) | ||||||||
|---|---|---|---|---|---|---|---|---|---|---|
| 8/2/79 | 8/3/79 | 8/6/79 | 8/7/79 | 8/8/79 | 8/9/79 | 8/10/79 | Ave. | 5/15/80 | ||
| 1 | Hatchery I | 0.275 | 0.275 | 0.275 | 0.275 | 0.275 | 0.275 | 0.275 | 0.275 | 0.275 |
| 2 | Hatchery II | 0.153 | 0.168 | 0.176 | 0.190 | 0.182 | 0.207 | 0.193 | 0.181 | 0.156 |
| 3 | Wet lab extension | 0.117 | 0.142 | 0.147 | 0.166 | 0.150 | 0.177 | 0.158 | 0.151 | 0.100 |
| 4 | Algal tanks | 0.100 | 0.119 | 0.100 | 0.101 | 0.090 | 0.116 | 0.104 | 0.104 | 0.100 |
| 5 | Nursery ponds | 0.117 | 0.122 | 0.132 | 0.145 | 0.139 | 0.147 | 0.137 | 0.134 | 0.100 |
| 6 | Field laboratory | 0.139 | 0.155 | 0.175 | 0.183 | 0.169 | 0.199 | 0.183 | 0.171 | 0.175 |
| 7 | Wet laboratory | 0.097 | 0.101 | 0.115 | 0.118 | 0.112 | 0.130 | 0.119 | 0.113 | 0.101 |
| 8 | Phycology | 0.047 | 0.082 | 0.088 | 0.087 | 0.082 | 0.092 | 0.085 | 0.080 | 0.076 |
| 9 | Canvas tanks | 0.058 | 0.077 | 0.085 | 0.084 | 0.084 | 0.096 | 0.089 | 0.082 | 0.050 |
Table 4. Performance data
| MODEL | DIA OF DISCH | BLOWER SPEED | Pressure kg/cm2, Capacity m3/min, Power KW | ||||||||||||
|---|---|---|---|---|---|---|---|---|---|---|---|---|---|---|---|
| 0.1kg/cm2 | 0.2kg/cm2 | 0.3kg/cm2 | 0.4kg/cm2 | 0.5kg/cm2 | 0.6kg/cm2 | ||||||||||
| No | r.p.m | m3/min | KW | m3/min | KW | m3/min | KW | m3/min | KW | m3/min | KW | m3/min | KW | ||
| BS 32 | 1¼B | 1 | 1700 | 0.57 | 0.2 | 0.42 | 0.3 | 0.25 | 0.5 | 0.14 | 0.7 | ||||
| 2 | 1850 | 0.64 | 0.3 | 0.48 | 0.4 | 0.37 | 0.6 | 0.24 | 0.8 | 0.12 | 1.0 | ||||
| 3 | 1950 | 0.70 | 0.3 | 0.52 | 0.5 | 0.42 | 0.7 | 0.32 | 0.9 | 0.21 | 1.1 | ||||
| BS 50 | 2 B | 1 | 1000 | 1.18 | 1.3 | 0.95 | 1.5 | 0.72 | 1.6 | 0.55 | 2.0 | 0.40 | 2.3 | 0.26 | 2.6 |
| 2 | 1150 | 1.42 | 1.4 | 1.24 | 1.6 | 1.02 | 2.2 | 0.85 | 2.3 | 0.62 | 2.7 | 0.55 | 3.1 | ||
| 3 | 1300 | 1.62 | 1.5 | 1.48 | 1.7 | 1.25 | 2.3 | 1.07 | 2.6 | 0.91 | 3.1 | 0.77 | 3.6 | ||
| 4 | 1450 | 1.87 | 1.6 | 1.71 | 2.1 | 1.52 | 2.5 | 1.36 | 2.9 | 1.23 | 3.5 | 1.05 | 4.1 | ||
| 5 | 1600 | 2.10 | 1.7 | 1.90 | 2.2 | 1.70 | 2.6 | 1.65 | 3.2 | 1.52 | 3.9 | 1.40 | 4.5 | ||
| BS 80 | 3 B | 1 | 850 | 2.72 | 2.3 | 2.33 | 2.6 | 2.03 | 2.9 | 1.81 | 3.3 | 1.62 | 3.9 | 1.49 | 4.5 |
| 2 | 1000 | 3.24 | 2.4 | 2.90 | 2.9 | 2.60 | 3.1 | 2.35 | 3.4 | 2.13 | 4.1 | 1.85 | 4.7 | ||
| 3 | 1250 | 4.05 | 2.6 | 3.71 | 3.0 | 3.50 | 3.7 | 3.30 | 4.2 | 3.10 | 5.0 | 2.90 | 5.8 | ||
| 4 | 1360 | 4.70 | 2.8 | 4.35 | 3.2 | 4.10 | 3.8 | 3.85 | 4.7 | 3.65 | 5.4 | 3.40 | 6.3 | ||
| 5 | 1500 | 5.00 | 2.9 | 4.71 | 3.4 | 4.40 | 4.2 | 4.15 | 4.9 | 3.92 | 5.8 | 3.70 | 7.9 | ||
| BS 100 | 4 B | 1 | 850 | 4.12 | 3.7 | 3.6 | 4.1 | 3.30 | 4.7 | 3.02 | 5.9 | 2.71 | 6.7 | 2.60 | 7.5 |
| 2 | 1000 | 4.91 | 3.7 | 4.2 | 4.3 | 3.90 | 5.2 | 3.55 | 6.4 | 3.32 | 7.7 | 3.00 | 9.0 | ||
| 3 | 1150 | 5.60 | 3.9 | 5.7 | 4.5 | 5.00 | 5.8 | 4.62 | 6.8 | 4.40 | 7.9 | 4.20 | 9.5 | ||
| 4 | 1250 | 6.03 | 5.0 | 6.1 | 5.8 | 5.33 | 7.4 | 5.00 | 8.5 | 4.82 | 9.6 | 4.65 | 11.1 | ||
| 5 | 1450 | 7.04 | 5.0 | 7.1 | 6.0 | 6.25 | 7.6 | 6.05 | 8.7 | 5.80 | 10.6 | 5.60 | 12.7 | ||
| BS 125 | 5 B | 1 | 750 | 8.6 | 5.3 | 8.0 | 6.3 | 7.3 | 7.5 | 6.5 | 10.6 | 6.3 | 12.4 | 6.0 | 14.3 |
| 2 | 950 | 11.1 | 5.8 | 10.5 | 7.2 | 9.9 | 8.9 | 9.5 | 12.1 | 9.1 | 14.3 | 8.8 | 16.1 | ||
| 3 | 1030 | 12.3 | 6.0 | 11.7 | 7.7 | 11.2 | 9.6 | 10.8 | 13.0 | 10.3 | 14.8 | 9.9 | 17.5 | ||
| 4 | 1230 | 14.5 | 6.8 | 14.0 | 8.9 | 13.4 | 12.8 | 12.9 | 16.6 | 12.4 | 18.5 | 12.0 | 21.2 | ||
| 5 | 1400 | 17.7 | 11.2 | 17.0 | 13.3 | 16.5 | 16.0 | 16.0 | 19.7 | 15.5 | 22.5 | 15.1 | 27.6 | ||
| BS 150 | 6 B | 1 | 850 | 15.8 | 9.6 | 14.5 | 12.0 | 13.5 | 16.6 | 12.7 | 19.2 | 12.0 | 22.6 | 11.5 | 26.9 |
| 2 | 950 | 18.3 | 10.1 | 17.0 | 13.0 | 16.0 | 17.5 | 15.0 | 20.3 | 14.2 | 25.5 | 13.6 | 30.0 | ||
| 3 | 1030 | 20.3 | 11.2 | 19.2 | 14.4 | 18.2 | 19.2 | 17.5 | 22.3 | 16.5 | 28.2 | 16.0 | 32.0 | ||
| 4 | 1200 | 23.7 | 12.9 | 22.8 | 17.0 | 21.8 | 22.6 | 21.2 | 27.7 | 20.2 | 32.5 | 20.0 | 36.8 | ||
| 5 | 1300 | 27.3 | 13.6 | 26.0 | 18.0 | 24.8 | 24.6 | 24.0 | 31.1 | 23.0 | 35.8 | 22.2 | 42.1 | ||
| 6 | 1400 | 28.5 | 14.9 | 27.5 | 22.0 | 26.5 | 27.7 | 25.5 | 32.9 | 24.6 | 39.7 | 24.0 | 45.0 | ||
| Capacity | There is the difference of ± 0.5%. |
| Pressure | This is the guage pressure. |
| Selection of motor power | They generally shown the input of the blower, so there is 10–20% difference in the input of the motor. Anlet shows the input of the motor, so you should select motors in this table. |
| KW=V×A ×Eff (%) × P.F.(%)× 3 | |
| V.......Volts A.......Amperes Eff.......Motor efficiency | |
| P.F.......Power factor 3.......Coefficient of A.C | |
| The relation of capacity at inlet and outlet condition. | (Charles's law) |
 | |
| v0=The coefficient at 1 kg/cm2 and 0°C. | |
| v1=Inlet volume to the blower at P1 and T1 conditions(m3/min) | |
| v2=Discharge volume from the blower at P2 and T2 conditions(m3/min) | |
| T1=Inlet temperature to the blower. (°C) | |
| T2=Discharge temperature from the blower. (°C) |
Figure 1. Existing layout of aeration pipes
Not To Scale
Figure 2. Most commonly used aerators
Figure 3. Performance characteristics of a BS 125 5 B Anlet Roots Type Blower
Figure 4. Performance characteristics of a BS 150 6 B Anlet Roots Type Blower
![]()
![]()
![]()