| Briefing in Rome with the Project Manager | |
| 5.11.84 | Arrival in Nairobi |
| 9.11.84 | Arrival in Malindi, discussions with FAO and Resident Representative's in visit to the project |
| 12.11.84 | Meeting with project staff |
| 16.11.84 | Departure on leave of the Project Manager |
| 19.11.84 | Nairobi: visit to the FAO Representative's office |
| - to the Fisheries Department headquarters - to the Soil Survey of Kenya Department - to investors | |
| 21.11.84 | Return to the project |
| 22.–24.11.84 | Visit of the Tourism and Wildlife Accountancy Mission |
| 2.–5.12.84 | Visit of the Site Survey Mission |
| 10.12.84 | Nairobi: report - to the FAO Representative's office |
| - to the UNDP headquarters - to the Fisheries Department headquarters | |
| meeting with investors | |
| 13.12.84 | Return to Rome |
| 14.12.84 | Report to FAO Headquarters, Rome |
Government of Kenya
United Nations
Private Industry
FAO STAFF
Note: previously there were 2 biologist/associate experts until early 1984 and one fishfarm manager throughout 1983
KENYA STAFF
total in Malindi 13
total in Ngomeni 20
one on fellowship
| 1 | 2 | 3 | 4 | 5 | 6 | 7 | |
| 1 | YEAR/No/Pd | Date St./Hv | GROW. | DENS/m2 | Prod(kg) | kg/ha | Mk W. g |
| 2 | 81/1/3 | 15/6_14/10 | 113 | >7 | 95.5 | 91.83 | 1.4 |
| 3 | 81/2/3 | 14/12_17/3 | 93 | >3,5 | 167 | 160.6 | 5.5 |
| 4 | 82/1/2 | 11/1_15/4 | 94 | 1.9 | 37 | 30.83 | 6.1 |
| 5 | 82/2/1 | 12/1_28/4 | 106 | 2.1 | 5 | 4.545 | 11.8 |
| 6 | 82/3/3 | 13/4_14/7 | 92 | 3.5 | 199 | 191.3 | 7.3 |
| 7 | 82/4/2 | Exp. | |||||
| 8 | 82/5/1 | Exp. | |||||
| 9 | 82/6/3 | 19/8_19/11 | 91 | 4 | 278 | 267.3 | 5.7 |
| 10 | 82/7/5 | 3/9_6/12 | 93 | 3.8 | 277 | 174.2. | 5.3 |
| 11 | 82/8/2 | 17/9_17/12 | 90 | 3 | 182 | 151.7 | 5.3 |
| 12 | 82/9/4 | 20/9_4/1 | 105 | 4 | 163 | 105.8 | 4 |
| 13 | 82/10/1 | 5/10_10/1 | 96 | 4 | 182 | 165.5 | 5.9 |
| 14 | 82/11/3 | Exp. | |||||
| 15 | 82/12/6 | 30/12_30/3 | 89 | 1 | 116 | 82.86 | 9.2 |
| 16 | 83/1/5 | 14/1_18/4 | 92 | 2 | 264 | 166 | 10.8 |
| 17 | 83/2/4 | 28/1_29/4 | 90 | 1.5 | 181 | 117.5 | 6.9 |
| 18 | 83/3/3 | 14/2_18/5 | 89 | 2.2 | 129 | 124 | 7 |
| 19 | 83/4/2 | 28/2_2/6 | 92 | 1.7 | 208 | 173.3 | 10.8 |
| 20 | 83/5/1 | 14/3_15/6 | 93 | 1.3 | 27 | 24.55 | 2.2 |
| 21 | 83/6/6 | 27/4_28/7 | 100 | 1.5 | 61 | 43.57 | 3.5 |
| 22 | 83/7/5 | 12/5_11/8 | 90 | 1.3 | 198 | 124.5 | 7.6 |
| 23 | 83/8/4 | 25/5_24/8 | 90 | 1.8 | 180 | 116.9 | 10.3 |
| 24 | 83/9/3 | 9/6_23/9 | 116 | 6 | 98 | 94.23 | 5 |
| 25 | 83/10/2 | 25/8_29/11 | 96 | 1.7 | 236 | 196.7 | 10 |
| 26 | 83/11/1 | 6/9_3/1 | 118 | 1.8 | 102 | 92.73 | 4.7 |
| 27 | 83/12/6 | 22/9_29/12 | 98 | 2 | 54 | 38.57 | 7.5 |
| 28 | 83/13/5 | 5/10_13/1 | 101 | 7.2 | 533 | 335.2 | 7.2 |
| 29 | 83/14/4 | 10/10_24/1 | 94 | 3 | 386 | 250.6 | 10.8 |
| 30 | 83/15/3 | 24/10_8/2 | 108 | 1.4 | 141 | 135.6 | 8.9 |
| 31 | 83/16/2 | _22/3 | 93 | 2 | 162 | 135 | 7.3 |
| 32 | 84/1/1 | _17/4 | 104 | 1.8 | 54 | 49.09 | 5.1 |
| 33 | 84/2/6 | _26_4 | 91 | 2.5 | 275 | 196.4 | 7.7 |
| 34 | 84/3/? | Exp. | |||||
| 35 | 84/4/5 | -13/6 | 98 | 4 | 245 | 154.1 | 11.3 |
| 36 | 84/5/4 | _19/7 | 119 | 3.2 | 312 | 202.6 | 7.6 |
| 37 | 84/6/3 | 19/3_19/7 | 100 | 3 | 174 | 167.3 | 6.8 |
| 38 | 84/7/2 | 4/4_13/7 | 78 | 2 | 199 | 165.8 | 9.3 |
| 39 | 84/8/NP | Exp. | |||||
| 40 | 84/9/1 | 30/4_17/7 | 77 | 1.2 | 61 | 55.45 | 5.1 |
| 41 | 84/10/6 | Exp. | |||||
| 42 | 84/11/4 | 20/7_6/11 | 109 | 7 | 356 | 231.2 | 9 |
| 43 | 84/12/2 | 1/8_31/10 | 92 | 2.2 | 209 | 174.2 | 9 |
Column
1 Year/culture serial number/pond code number
2 Date of stocking/date of harvest
3 Duration of grow-out (days)
4 Density of shrimp fry stocked (number/m2)
5 Final production (weight in kg)
6 Production rate: weight/hectare
7 Mean weight of individual shrimp (gr)
Exp. experimental cycle - no production data
| 1 | 2 | 3 | |
| kg | kg/ha | ||
| Av. Pd No 1 | 72 | 65.5 | |
| Av. Pd No 2 | 176 | 147 | |
| Av. Pd No 3 | 160 | 154 | |
| Av. Pd No 4 | 263 | 171 | |
| Av. Pd No 5 | 303 | 191 | |
| Av. Pd No 6 | 84 | 60 | |
| Av. / ha | 142 | ||
| Av. W. | 7.2g |
kg = average weight of shrimp production per harvest period approx. 90 d
Trial No Pond No Area
Date of Stocking
Date of harvesting No of days
| ESTIMATED NO | Total | 95% | per ha | |
| 1. | Stocked | |||
| (a) all species | ||||
| (b) P. indicus | ||||
| 2. | Harvested | |||
| (marketable) | ||||
| HARVEST | Kg | % | Kg per ha | |
| Prawns | Large | |||
| Medium | ||||
| Sub Total | ||||
| Small | ||||
| Grand Total | ||||
| Crabs (kg) | ||||
| Fish (kg) | ||||
| AVERAGE SIZES | Ave (g) | Range (g) |
| Large | ||
| Medium | ||
| Overall (marketable) | ||
| Small |
| INFORMATION TAKEN IN EACH WATER CHANGES IN ALL PONDS | 198 |
| Precipitation | DATE BEFORE DRAINING | DATE AFTER DRAINING | ||||||||
| - - - - - - mm | ||||||||||
| TIDE - - - - - | P1 | P2 | P3 | P4 | NP | P1 | P2 | P3 | P4 | NP |
| Time | ||||||||||
| Water level (cm) | ||||||||||
| Temperature °C | ||||||||||
| pH | ||||||||||
| Salinity: Station and bottle no: | ||||||||||
| D.O. (Dissolved Oxygen) | ||||||||||
| Transparence (cm) | ||||||||||
| Closing Time | ||||||||||
| New Level | ||||||||||
| REMARKS | ||||||||||
BIOLOGICAL DATA (SAMPLING/STOCKING)
DATE POND STATION
GEAR SAMPLE NO
REMARKS
| Species | Length (cm) | Number | Total weight (g) | Average weight (g) | % |
| P. indicus | |||||
" | |||||
" | |||||
" | |||||
" | |||||
" | |||||
" | |||||
| P. monodon | |||||
" | |||||
" | |||||
| M. monoceros | |||||
" | |||||
" | |||||
| Caridaeids | |||||
| Acetes sp | |||||
| TOTAL |
1 SAMPLE OF PRAWNS FROM POND
HARVEST/GROWTH SPECIES
DATE COLLECTED
INDIVIDUAL WEIGHT IN GRAMS
| NO | WEIGHT | NO | WEIGHT | NO | WEIGHT | NO | WEIGHT |
| - | - | - | - | - | - | - | - |
| - | - | - | - | - | - | - | - |
| - | - | - | - | - | - | - | - |
| - | - | - | - | - | - | - | - |
| - | - | - | - | - | - | - | - |
| - | - | - | - | - | - | - | - |
| - | - | - | - | - | - | - | - |
| - | - | - | - | - | - | - | - |
| - | - | - | - | - | - | - | - |
| - | - | - | - | - | - | - | - |
| - | - | - | - | - | - | - | - |
| - | - | - | - | - | - | - | - |
| - | - | - | - | - | - | - | - |
| - | - | - | - | - | - | - | - |
| - | - | - | - | - | - | - | - |
| - | - | - | - | - | - | - | - |
| - | - | - | - | - | - | - | - |
| - | - | - | - | - | - | - | - |
| - | - | - | - | - | - | - | - |
| - | - | - | - | - | - | - | - |
| - | - | - | - | - | - | - | - |
| - | - | - | - | - | - | - | - |
| - | - | - | - | - | - | - | - |
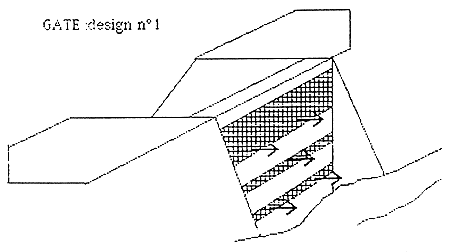
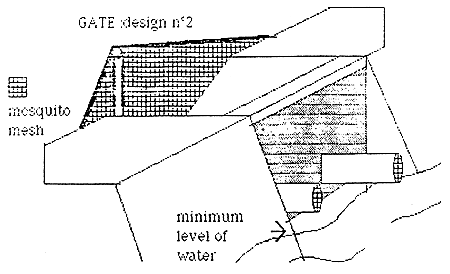
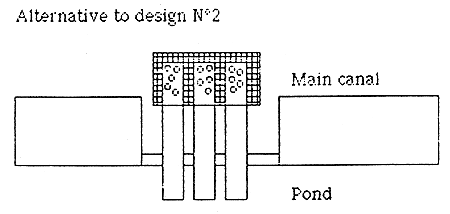
RECOMMENDATIONS FOR HASTENING DEVELOPMENT OF GELATINOUS MUD AT NGOMENI PILOT FISH FARM
A. Slightly acid to slightly alkaline pond soils (pH 6.5–7.5)
B. Acidic soils (pH 5.0 to 6.0)
C. Acidic soils (pH 4 to 4.5)
2 Consultants' additional recommendations to Mr. Padlan's procedures.
CULTURE OF LABLAB AFTER FORMATION OF 5–10 CM LAYER OF HYDROPHILIC MUD
A. January to March (before long rains)
B. August to September
Note: In all operations A and B, pond may be stocked as soon as water has reached a depth of 25 to 30 cm. Ensure proper acclimatization measures, however, before releasing fish into the pond. Shrimps may be stocked if salinity is within growing range.
To do a correct sampling a castnet is used in many countries, but it cannot be used in Ngomeni due to the presence of branches in the pond to discourage poachers. A square trap net (60 × 60 cm) mounted on a frame can be used. It is left lying on the bottom of the pond with some bait for one hour; it is then suddenly pulled out of the water with all the shrimps that have been attracted. Such trap catch will give a more accurate evolution of the growth. The results of the sample as well as of the other parameters must be typed immediately and distributed to the staff. They can then be discussed and the programme adjusted during the following staff meeting.
The form is to be filled everyday; it must give a detailed report of what is happening in each pond.
Environmental data
Weather: it can be reported as sunny, cloudy or rainy.
Water exchange
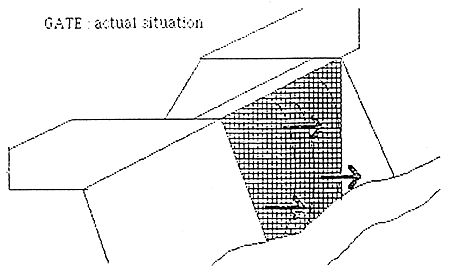
The water exchange will be done automatically as soon as an improved gate design will be put in service. The water exchange will be noted as + on the day of exchange and O when there will be no exchange. The level must be recorded just after closing the gate and just before opening it. The salinity must be read with the refractometer every other day and just before opening the gate.
Lablab
The pond manager will appreciate the growth of lablab as none, little, normal or excess.
Comments
In this column will be specified the activity developed every day in each pond such as drying, elimination of crabs, fertilization with the type of fertilizer and the amount used in kg, preparation of lablab, stocking with the exact number, sampling, harvesting, etc.
Any additional intervention or unusual observations must be specified such as an anormal colour of the soil or the water, problems at the gate or maintenance of the pond (tilling, reinforcement of the dike, etc.).
DAILY OPERATION DATA
| DATE | ||
| ENVIRONMENT | ||
| Tide: | Precipitation: | |
| Weather: | Salinity: | |
| Gate Water Temp.: |
POND MANAGEMENT DATA
| Waters | Temps. | Sal. | D.O. | Disk | Lab lab | Comments | |||
| Exch. | Level | Min. | Max. | ||||||
| 1 | |||||||||
| 2 | |||||||||
| 3 | |||||||||
| 4 | |||||||||
| 5 | |||||||||
| 6 | |||||||||
| 7 | |||||||||
| 8 | |||||||||
| 9 | |||||||||
| NP | |||||||||
| OPERATIONAL EXPENSES | OPERATION NO: | ||||
| Date | Total | ||||
| Pond and Lablab preparation. | |||||
| No. of workers | time (hour) | activity | |||
| Fertilizers type | cost/kg | Quantity | Transport | ||
| Stocking | |||||
| No. of juveniles | No. of workers | Time | Extra costs | ||
| Grow out phase | |||||
| No. of workers | time (hours) | activity | |||
| Harvest | |||||
| No. of workers | time | activity | extra | ||
For administration use only
Staff and administration pro rata expenses.
OPERATION NO
POPULATION RECORD DATA
| Pond | Area | |
| STOCKING DATE | ||
Total | ||
Indicus | Per ha |
| GROW OUT Sampling date | ||||
| Weight (g) | ||||
| HARVEST DATE | ||||||||
| J | 3 | 2 | 1 | 0 | Small | Crab | Fish | |
| kg | ||||||||
| % | ||||||||
| Total marketable | Per ha |
| Total produced | Per ha |
| Average weight | |
| Nof of days | |
| Growth per week |
OBSERVATIONS:
OPERATION NO
POND RECORD DATA
| Proceeding Harvest Date | Pond No | Area | ||
| POND PREPARATION | ||||
| From | To | Comments | ||
| LABLAB PREPARATION | ||||
| From | To | Comments | ||
| PONDS PARAMETERS | ||||||||||
| Date From | To | Water Exch. | Final Level | Ave Min | Temp Max | Salinity | Secchi | D.O. | Lab Lab | Comments |
OBSERVATIONS: