![]()
![]()
![]()
This chapter will describe the system by identifying its parts and their relationships. It will also indicate how the system is to be used. The system has two types of components, data formats and algorithms. By applying the algorithms the computer converts the data fed to it into outputs. Decision points are introduced between data formats and algorithms. The outputs wanted from the system have determined the inputs and how the inputs are to be handled by the system (in data formats and algorithms). The first item to be described, therefore, are the outputs.
The economic criteria to be used by the system was discussed with relevant Hungarian authorities. The system is now such that the analyst is able to calculate, for any culture activity, the numerical values of the following criteria:
net income;
net income per unit of capital;
net income per unit of culture (pond area, cage, etc.);
net income per unit of labour; and
period required to recover investment in culture unit through accumulation of net income.
The system is so designed that these values can be calculated for any culture activity irrespective of its duration (from a few days to several years) or scope (from one pond, or cage to a whole farm).
The system can provide summary balance sheets and profit and loss statement for any culture activity and period.
Thus as designed the system answers the general question: “What are the economic results (as measured by the criteria identified above) for a particular type of culture activity (as described in physical terms) in a particular type of economic situation (as described by unit prices)?
The system is not designed to be able to answer the general question, “Which is the optimum culture system for farm X?” or “Which is the optimum size of a particular culture activity?”. In order to prepare a computer programme which would give realistic answers to these types of questions, the present know-how on facture substitution and on relationships (in terms of outputs) between facture use and environment, is insufficient.
The system can answer the question, “Which of the following culture alternatives (or similar ways of attempting to reach the same culture objective) is best from the economic point of view?” The answer would then be obtained by comparing the results (as measured by the criteria) produced by the system for each of the culture alternatives specified. Thus the system in its present form will only identify as optimum a factor combination which has been specified to it.
This last approach is sufficient to solve the optimization problem if the aquaculturist and economist together can specify a culture alternative which is so close to the theoretical optimum that little money is lost by implementing it. If they can, there would be no need for the system to be optimiz. If they can not, there is no reason to believe that they know enough about the culture alternative to be able to construct a model of it. Thus the proposed approach should be sufficient.
The system is designed to be able to appraise the economies of both the smallest possible component of any culture activity, and of as large and complex economic unit as a farm. Which is the smallest component? What does it look like? Let's call it a culture bit.
The culture bit has to exist in time and space. We identify it in space by culture unit and in time by culture period. It has a specific culture bit objective and is comprised of several culture activities.
The culture bit objective defines in detail the (cultured) produce to be obtained at a given date (e.g. 2 500 kg. of mirror carp consisting of 2 500 individuals with an average weight of 1 kg. on the 21st of July 1982).
A culture unit is defined by the facilities and equipment needed for achieving a particular culture bit objective.
A culture period is the period of time between the preparation of the culture unit and the moment the cultured produce is harvested from the same culture unit.
The culture activities normally carried out during the culture period are classified into six groups of activities as follows:
preparation of culture unit;
determination and aquisition of young specimens of stocking material (through production, collection or purchase);
introduction of the stocking material into the culture unit;
introduction of inputs for growth and/or maintenance of the stocked fish (or other culture material), into the culture media;
harvesting of the cultured fish (or other culture material); and
storage/disposal of harvested fish.
The culture bit is the smallest part of the system which is designed to work with the ‘farm’ as the largest and most complex item of input. The farm is made up of one or more ‘enterprises’. An enterprise is made up of one of more culture bits.
For clarity and consistency, the programmer/analyst does not work with the terms ‘farm’ and ‘enterprise’ but with the terms ‘farm bit’ and ‘enterprise bit’. They are defined in a manner analogous to that just described for the ‘culture bit’. Thus, a farm bit is defined by its objective, farm unit, farm period and farm activities. The enterprise bit likewise is defined by the enterprise objective, enterprise unit, enterprise period and enterprise activities. The aggregation of the word ‘bit’ to farm and enterprise respectively, will make it possible for the analyst to distinguish and discuss various farm management strategies for any one fish farm or enterprise.
The culture of carp in a 3-year cycle is an enterprise; so it is the polyculture of cyprinids in an enclosure. Cage culture of catfish is a third example of an enterprise. The analyst will treat these as ‘enterprise bits’. Each of them could, by themselves, constitute a farm bit. A farm bit may also be made up by any combination of them.
The relationship between the farm bit, the enterprise bit and the culture bit is illustrated in Figure 1, where they are identified by the two dimensions of ‘unit’ and ‘period’. Although this identification is not a complete definition, it is sufficient to demonstrate how culture bits are combined to form an enterprise bit, and how enterprise bits are combined to form a farm bit.
Figure 1 Relationship between culture bit, enterprise bit and farm bit
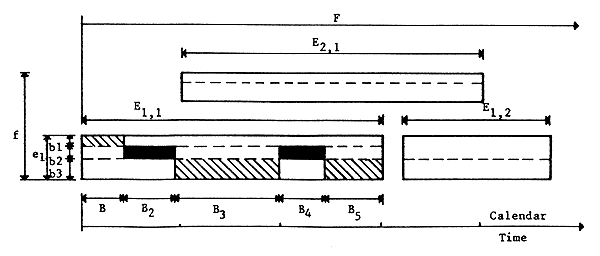
| f. farm unit | F. farm period |
| e. enterprise unit | E. enterprise period |
| b. culture unit | B. culture period |
Two groups of data are needed for the operation of the system: the data on the actual culture operations and the data which specifies the type of economic analysis that the computer should carry out on the culture data.
The culture bit is the smallest activity on which the system will carry out an economic analysis. Therefore, data needed for the economic analysis of a culture bit (calculation of profit; balance sheet; profit and loss statement) must be accepted by the system. The more information that is fed to the system in a detailed manner, the larger are the possibilities for detailed analysis of the culture activity.
Naturally, it might be that detailed information is not always available, and global estimates take their place. The system should be such that the computer accepts also summary data for culture bit, enterprise bit and farm bit.
The system is explicitly designed so that it will not be necessary to provide simultaneously physical data and cost/price data. However, to preserve as much freedom of analysis as possible some standards should be respected.
It is essential that:
The ‘unit of measurement’ used for describing physical aspects of inputs and outputs should preferably be the same as unit of measurement used for identifying the cost/prices of the same inputs and outputs. If this is not possible, then at least it should be possible to convert the one into the other through some standard conversion algorithm (part of algorithms type ‘A’, described in Section 4.4.2).
If data is collected only as ‘values’ (e.g. total income, without indicating the price per kg. or quantity of fish sold, or total number of ponds, without indicating at least their surface area), they will prove inadequate for much further analysis.
Second, a certain minimum quantity of data is needed to perform any economic analysis. Thus, information must be provided on:
There would seem to be a number of advantages of using the ‘culture bit’ as the framework for feeding information into the computer.
Firstly, the ‘culture bit’ concept can be used to describe any type of culture. The six sequences of activities occur in pond culture, in cage culture, in raceway culture. There does not seem to be any form of aquaculture which cannot be described by these six groups of activities. The concept, as a matter of fact, can be applied also to agriculture and forestry.
Second, complex culture systems (like the three year carp cycle practiced in Hungary) can be broken up analytically into sequences of culture bits, and thus the analyst can evaluate the culture technology phase by phase.
Third, the aquaculturist will not be confronted with the task of providing the economist with costs and earnings data, for the latter to use in economic analysis. Rather, the aquaculturist will be asked to provide the data relating to the physical operations of the system, and to provide them in a manner which, by closely following what actually takes place, will not require that he make judgements about what to report and what not to report. This will make for ease of application.
This section will describe the freedom which the analyst has to use the inputs (described in 4.2) to achieve the outputs (identified in 4.1).
This freedom can be measured by the choices the analyst has; that is, the decisions he has to make in using the system. The analyst has to decide:
The system is so designed that the analyst can decide both the scope and period of analysis. He does this by specifying the accounting bit. The accounting bit is identified by the content of the ‘accounting unit’ and the duration of the ‘accounting period’.
The accounting unit may coincide in scope with either the culture unit, the enterprise unit or the farm unit. The accounting unit cannot incorporate a fraction of a culture unit.
The accounting period may be of any duration. However, with few exceptions it will coincide with either of the three natural periods - farm period, enterprise period or culture period; or with any combination of these. The most common exceptions will be those when annual profit and loss statements are produced.
Thus, while data is fed into the computer in terms of culture units (which later may be defined as enterprise units and farm units), the analysis is carried out in terms of ‘accounting bits’.
The analyst, when carrying out an economic analysis, is essentially combining the data available to generate information which will help in taking decisions. In order that the information provided (basically through the numeric values of the criteria) be useful, it must reflect the situation of the person making the decision.
The essential categories, when describing this ‘decision situation’, in the view of the consultant, are three:
The combination of these three categories of choice concerning any economic analysis gives six basic ‘analytical contexts’. They are graphically described in Figure 2.
When conducting an economic evaluation the analyst should specify to the computer for which of these six analytical contexts the analysis is being carried out.
Figure 2
Display of categories of ‘analytical context’
| PAST | FUTURE | ||
| Short-term | Long-term | ||
| Farm-manager | I | III | V |
| National policymaker | II | IV | VI |
Before initiating the analysis the analyst also should determine the criteria (listed in 4.1) for which he wants numerical information. He can select any combination of the five listed.
He should also identify which of the routines for standard economic sensitivity analysis that he wants to use. For each of the criteria specified he will then, for each of the accounting units, obtain a range of values.
The previous sections of this chapter have described the types of information that will come out of the computer, the data that needs to be feed into it and what the analyst has to do to obtain that output. The remainder of the chapter will discuss in some more detail the parts which make up the system.
There are three components of the system as operated within the computer:
The interrelationships between these components are displayed in a graphic form in Figure 3. Each of them will now be described in turn.
The computer formats are matrixes, or tables, meant for holding data, about a culture bit in the computer's memory. The computer will be provided with five sets of formats. The first three hold data related to the culture bits. The fourth holds information (that is, rearranged, combined data) on the culture bits and the last set holds information for the accounting bit.
Figure 3
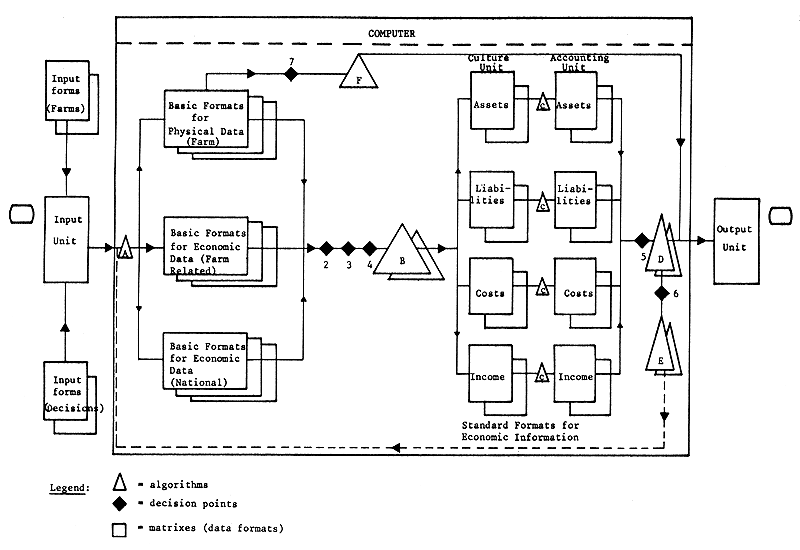
The three sets of formats for holding data on the culture bits (or groups of culture bits) are the Basic Formats for Physical Data (BFPD) and the Basic Formats for Economic Data (BFEDF), farm related, and Basic Formats for Economic Data, National (BFEDN). This last set is used for data that is valid for the nation (or region) as a whole.
The 14 BFPD are listed and exemplified in Annex I. Fifteen formats of the BFEDF and BFEDN are similarily described also in Annex I.
There are two sets of Standard Formats for Economic Information (SFEI). The first set, SFEI-I, provides the information for the smallest unit of analysis, that is, the culture bit. The other set, SFEC-II, provides the same framework for holding information but at the level of the accounting bit. As stated above, at times the accounting bit may be identical to the culture bit, at other times it will be an amalgamation of several culture bits.
Each set of SFEI includes four basic types of formats designed to hold information as follows:
There is a list of SFEI in Annex I and an example of each major type. The first two types of SFEI formats together specify a balance sheet for the beginning or end of any period. The last two, that is, the cost and income formats, specify the profit and loss statement for the corresponding period.
The computer formats have been designed so that the computer can store data on complex fish culture activities. The more detailed the data the greater the possibilities of precise economic analysis. However, all the data indicated on the formats are not required for simple types of economic analyses. Some analysis can be carried out with much less.
The nature of the decisions to be taken by the analyst using the system have been discussed under Section 4.3, System use. Graph 3 indicates, in a logical sequence, where these decisions occur in the handling of the data.
Graph 3 identifies 6 groups of algorithms. They are all placed after decision points in the system. The preceding decisions have selected a sequence of arithmetical operations to be carried out and/or a transfer of data amongst formats (matrixes) or within formats (matrixes). The algorithms will be discussed below.
Algorithm ‘A’. This group of algorithms is triggered into operation through the data provided on ‘decision input form’, as are all the other algorithms. The algorithm specifying the transfer of data from the data input forms to the three sets of Basic Formats, is a sequence of simple arithimetic and data storage operations.
Algorithm ‘B’. This group of algorithms will be the most complex and intricate of the lot. It assures that the physical and economic data for each culture bit is combined to provide the economic information specified in SFEC-I for each culture bit.
Algorithm ‘C’. This group of algorithms will assure that the economic information contained in SFEI-I is agglomerated and transferred to SFEI-II, that is, provides the information per accounting bit. It will provide the economic information for any accounting period specified by the analyst.
Algorithm ‘D’. This group of algorithms calculates the values of criteria for the accounting unit/period and prepares this information to be provided to the analyst through the print-out unit.
Algorithm ‘E’. This group of algorithms will assure re-calculation of the criteria (specified for Algorithm D, or some other modified set of criteria) according to a preset schedule of variations in unit prices for factor input or for outputs.
Algorithm ‘F’. This group of algorithms will assure the calculation of standard physical relationships (e.g. quantity of feed used per unit of fish produced) considered useful as a check on the reliability on the input data. This check can also be made by comparing the culture bit data with that stored by the computer about other culture bits.
The system is a tool. A tool must be applied in practice to be of any use. However, it is a new tool for solving old problems: the FCRI is, and has been, dealing frequently with the decision problems which the system, as presently designed, is intended to help analyze. Initially this new tool should be used together with the ‘old tools’. At a later stage, when developed and accepted by FCRI management, the computer-based economic analysis is likely to replace some of the present procedures for analysing the economic aspects of fish culture research and extension activities. A conscious effort should be made to modify the present pattern of decision taking at FRCI, if the system, as proposed in this report, is to be tested, (modified) and implemented.
The consultant is of the view that a systems group should be formed at FCRI. This group should have as its priority task to write the basic computer programmes and to use the system to help appraise economic aspects of proposed research and extension activities. Preferably the group should be headed by an economist (with knowledge of farm management, and macro-economics). A programmer/mathematician should also be part of it and most importantly it should work hand in hand with FCRI aquaculturists and accountants to establish a data collection system (around the ‘culture bit’ concept) from the FCRI pilot farm.
For the system to be accepted it is essential that it be demonstrated to senior staff at the institute. If it is to be used, the system must come to be viewed by those who formulate and decide on research and extension programmes as one tool, amongst others, available to them for evaluating their proposed activities.
The system as designed will, when in use, contain a bank of detailed historical data on aquaculture operations. Following the present design, the analyst will use this data in a rather modest manner; to calculate numerical values for economic criteria and to provide summary economic statements. Much more information can be obtained from this data with little additional effort. Some examples:
Economic criteria. Other economic criteria (internal rate of return, net present value, etc.), can be calculated if suitable programmes (available with most software producers) are added.
Sensitivity programme. In addition to the standard sensitivity analysis sub-routines which the system is designed to have, a set of analyst directed sub-routines for sensitivity analysis can be added. MANIP developed by the FAO Investment Centre is an example of such a set of programmes.
Pond modelling programmes. It would be comparatively easy to integrate with the system a set of algorithms and data formats which would allow the prediction of aquaculture production in ponds, given the fish species and the physical and chemical expected for the pond water.
Management information system. A large portion of the basic data needed for management information system of fish farm is included in the data bank. Some additional formats and subroutines would have to be developed.
Industry wide analysis. If and when the data bank gets an industry wide coverage, programmes can be written which would provide industry wide statistics (output per man-year; output per ha; distribution of fish feed conversion ratios by type and size of farms, etc.). Likewise, the data bank will be useful in testing any farm optimization models that might be constructed. The data bank will permit government planners to obtain answers to questions like:
![]()
![]()
![]()