


Poh, L.Y.#, Woon, W.C.*, Maizura Ishak*
and Shahira Ishak*
The Sawmill Information System (SIS) has been developed
using the Microsoft Access Database software. It runs on the Microsoft Windows
95/98 operating system. The SIS is used to capture data gathered through the
Sawmill Shuttle Returns (No. 4) maintained by the Forestry Department Peninsular
Malaysia. It consists of four modules:
1. Report module,
2. Input and output module,
3. Information update module and
4. Data validation module
The report module is the most important feature and
the largest module, while the input and output module is for data entry. The
information update module allows the user to update all information pertaining
to the state and district code, species code, sawmill code, buyer code and
country code. The data validation module ensures that the data are clean and
free from error.
When the SIS is implemented, data validation and accuracy
improve tremendously. This is because data captured can be validated immediately, by running the data validation menu and errors can then be corrected. The SIS not only ensures
timely reports but also requires less human resources to maintain. Another strength of the
system is the flexibility and ease of accessing the SIS for information in
the prescribed format. Users can go straight to the report
module to access the various reports. Alternatively, users
can create new reports in whatever format they require from the SIS. These
reports can be generated within a very short period. The reports generated
can also span a number of years when the data for the earlier years are added
to the SIS.
The Forest Economics Unit of the Forestry
Department of Peninsular Malaysia (FDPM) collects many
data pertaining to the various wood-based industries in Peninsular Malaysia.
These data are collected through the various shuttle returns. The Shuttle
Return No. 4 deals specifically with the sawmilling sector. This Shuttle
Return consists of five main forms (Table 1).
Table 1. Sawmill Shuttle Return forms
|
Form |
Particulars |
Frequency of reporting |
|
4 (a) |
Background |
Once a year (as at 31 Dec) |
|
4 (b) |
Human resources |
Quarterly (Jan/Apr/July/Oct) |
|
4 (c) |
Input and output |
Monthly |
|
4 (d) |
Import |
Monthly |
|
4 (e) |
Domestic sales and export |
Monthly |
Individual sawmills are required to submit the relevant forms monthly, quarterly and annually
to the respective District Forest Office in which the mill is located. These
forms are then forwarded to the Forest Economics Unit, FDPM in Kuala Lumpur for processing (Appendix
A).
Prior to the implementation of the Sawmill
Information System (SIS) there is a number of work flow procedures,
which are shown in Figure 1. In the first stage, the forms are sorted
manually in batches by:
The individual forms are then coded. Each
state, forest district and sawmill is assigned a specific number (sawmill code) and this is recorded manually. The data are captured and
stored on a spreadsheet (Lotus 123 format) and the files are organized
by month and state. This means effectively that a total of 288 files are
created (12 files for each state multiplied by 12
months (each) for Form 4(c), Form 4(d) and Form 4(e) in any one year. For
Form 4(b) covering human resource deployment another 48 files are used (12 files for each state multiplied by
4 [quarterly]). The size of the files varies
from a few kilobytes to a megabyte each depending on the number of sawmills
in each state. Pahang (121 mills) and Perak (97 mills) have the most sawmills. The data files are validated manually for typing errors.
The large number of files makes it difficult to validate the data and generates errors.
In the second stage, the data files are
merged manually into one file before being converted into an SPSS-formatted data file. The data are
then processed using the SPSS software and the outputs are presented in predefined
report formats. The data are analysed at half yearly intervals because it is a very time-consuming routine. The services
of a statistician are required in this process. As a result, there is generally a time
lag of between six to eight months before the reports can be generated.
There are a number of problems associated with the
inefficient and laborious old work flow procedures.
Inability to monitor the many files
Because of the many files,
errors often occur when the data input operator accidentally uses the wrong files for storing the raw data. This is not immediately apparent,
as all the variables are the same. The data files are distinguished by month
and state and the constant switching of files makes the system error prone. Furthermore, data validation is done manually. Inconsistency
in the treatment of coding especially for the species and district code also arises.
Duplication of data and incomplete records
Owing to the aforementioned reasons, data duplication
and incomplete records are common. These errors are not easy
to detect and result in inaccurate reports.
Time-consuming analysis of
data
The elaborate process of merging the data files and converting them to the
SPSS format makes it a very time-consuming
and laborious task. Processing the data has been known to take more than a week to complete
and requires the services of a statistician.
Inflexible reporting format
The reporting format is predetermined and has been developed
using the SPSS software. Any information required that is not included in the predetermined format will require
further programming and the services
of a programmer. This lack of flexibility leads to the under utilization of
the Shuttle Return. Often, the management team requires certain specific information pertaining
to the sawmilling sector at short notice, which the old system cannot provide. The half-yearly batch processing of the data is unsuitable and makes it inefficient.
The FDPM sought the assistance of the Forest Research Institute Malaysia
(FRIM) to address the aforesaid problems. This led to the development of the Sawmill Information System (SIS). Development
and implementation of the SIS took two years.
The SIS has been developed using
the Microsoft Access Database software. It runs on a personal computer (with
a 486 or higher processor) having at least 16 MB RAM and using the Microsoft Windows 95/98
system. Data gathered through the Sawmill Shuttle Returns (No. 4) maintained
by the FDPM are captured by the SIS. The SIS consists
of four modules:
Report module (Figure 3)
Input and output module (Figure 10)
Information update module (Figure 13)
Data validation
module (Figures 11 and 12).
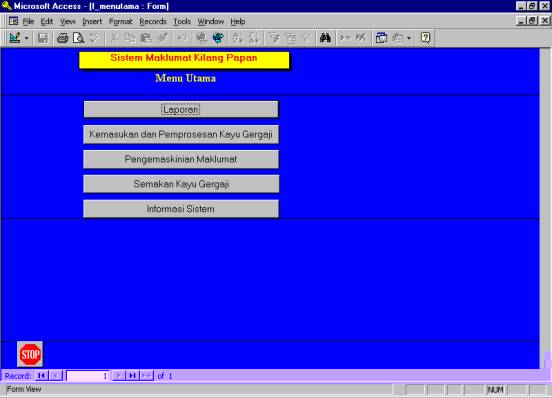
Figure 2. The main menu of the Sawmill Information System
Report module
The report module (Figure 3) is the most important feature and the largest module
of the SIS. This is the module that users interact with most of the time. The processed information is presented in various formats
designed to the users’ needs. There are at least 11 reports in this module and the number is increasing. The flexibility of the module allows
the users to harness fully the information in the SIS. New reports can be created easily. There is no limit as to the number of reports the SIS can accommodate. Some
of the reports are shown
in Figures 4 to 9.
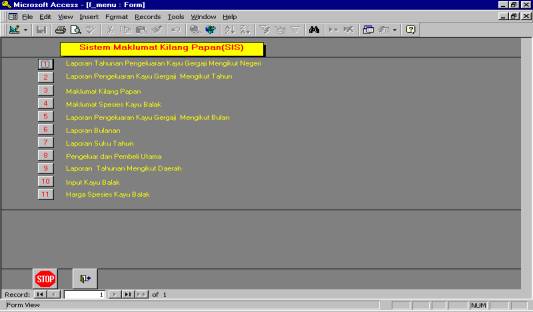
Figure 3. The report module
Through the report module, various reports are produced. Some of these reports include
inter alia: log
input, sawn timber output, domestic sales, exports,
employment, fixed assets and particulars of sawmills
that can be sorted by states, districts, months, years, species, ownership
and classes.
Over time additional reports are added to the SIS. These include
the average weighted domestic and imported prices of logs by species;
top 10 producers and domestic buyers of sawn timber,
as well as the top 10 species consumed and imported by the sawmills. The average weighted
domestic and imported prices of logs purchased by sawmills in Peninsular Malaysia
generated from the SIS represent a major improvement in the provision of information
on log prices. Currently, the Malaysia Timber Industry Board (MTIB) provides
only simple average domestic log prices and these are derived from a very
small sample of sawmills. Furthermore, the quantity of logs transacted is
not taken into account. The average weighted domestic and imported prices
of logs can be derived for all species recorded in the Shuttle Return and
also presented by state, districts and in months.
Reports on the top 10 producers of sawn timber, domestic buyers as well as species consumed
and imported by the sawmills can be listed at the press of a button
and at any time. Previously this
information could only be determined at half yearly intervals. Immediate
access to such information is very useful for
forest managers in decision-making processes.
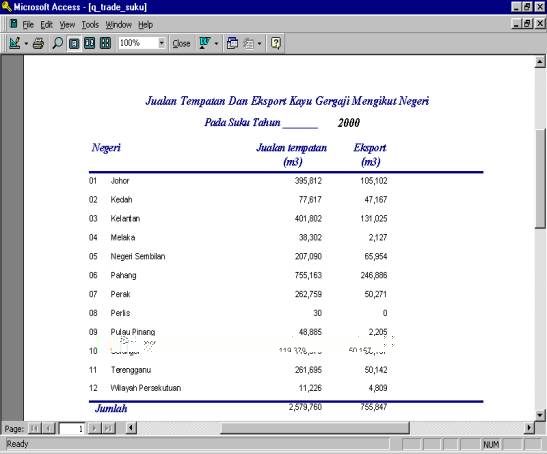
Figure 4. Domestic sales and export of sawn timber by state
Figure 5. Quarterly human resources deployment
by state
Figure 6. Monthly log input and sawn timber output by
state, month and species (submodule 6)
Figure 7. Average weighted import price of logs
Table 2. Average weighted domestic price of logs
Species code
Species S volume S value Weighted
avg. price
0001
Balau 12 172.19
8 982 55.87 737.92
0002 Balau Merah 2 695.75 15 282 93.3 566.93
0003 Cengal 4 243.09 3 832 01.74 903.12
0004 Giam 400.11 3 620 03.52 904.76
0005 Keranji 9 878.67 42 336 18.97 428.56
0006 Merbau 17 953.37
109 295 65.01 608.78
0007 Resak 2 741.96 13 489 16.82 491.95
0008 Kekatong 923.02
2 360 95.12
255.79
0011 Kapur/Keladan 12 154.44 71 808 27.67
590.80
0012 Kasai 3 411.12 11 952 33.14
350.39
0013 Kelat 59 292.71 216 862
06.11 365.75
0014 Keledang 4 434.84
19 326 85.26 435.80
Table 3. Top
10 producers of sawn
timber
|
No. |
Mill code
|
Name of mill
|
Sawn timber (m3) |
|
1 |
0354 |
Lionvest Corp. (Phg) Sdn. Bhd. |
86 074 |
|
2 |
0035 |
Kayu Asli Industries (M) Sdn. Bhd. |
44 599 |
|
3 |
0609 |
Pesama Timber Corp. Sdn. Bhd. |
40 840 |
|
4 |
0210 |
Syarikat Sembilan Electric Sawmill Sdn. Bhd. |
39 683 |
|
5 |
0729 |
Lim IP Wood Sdn. Bhd. |
38 495 |
|
6 |
0281 |
Mahawangsa Timber Industries Sdn. Bhd. |
37 551 |
|
7 |
0367 |
Syarikat Kemajuan Pembalak Temerloh Sdn. Bhd. |
34 795 |
|
8 |
0237 |
Yeong Yew Loong Sdn. Bhd. |
32 578 |
|
9 |
0146 |
Limah Awang Sawmill Sdn. Bhd. |
31 598 |
|
10 |
0151 |
K/P Galas Setia (Kelantan) Sdn. Bhd. |
31 214 |
A unique feature of the input and output module is that data
validation can be carried out simultaneously during data inputting.
The extensive use of the pop-up menu (Figure 8) helps to minimize data input error as the operator obtains immediate visual feedback and validation of data. Information pertaining to
sawmill name, state code, month and species code is automatically displayed
during the data inputting process.
Figure 8. Input and output module
The input and output module only requires the user to key in the sawmill code, month and
year once before proceeding to capture all the data recorded in Form 4(b)
(Human Resources), Form 4(c) (Input & Output), Form 4(d)
(Import) and Form 4(e) (Domestic Sales
& Export) in one run. The process saves much time as over 650 sawmills are processed monthly.
The data validation module ensures that the data are clean and free from error. Data duplication,
new sawmill codes and incomplete records
can be detected easily through this module. It also
checks for data input error such as sawn timber output being greater than
input and exceptionally high recovery rates.
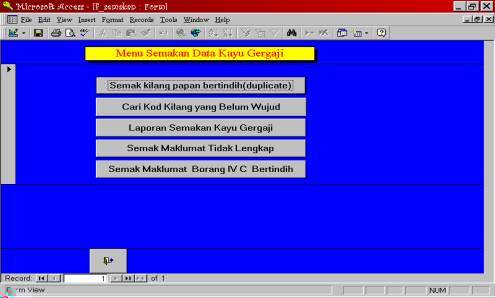
Figure 9. Data validation module
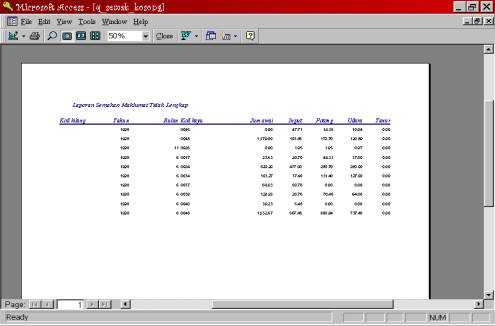
Figure 10. Records with incomplete sawmill codes
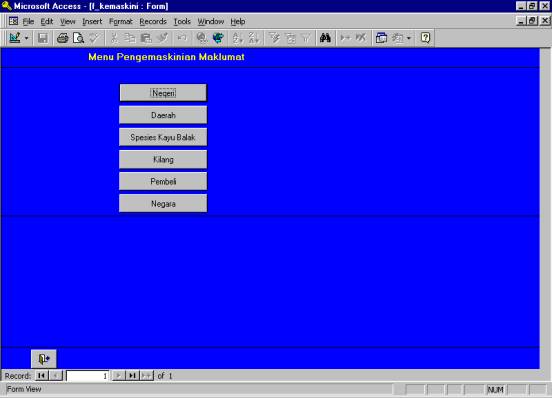
The information update module allows the user to update all information pertaining to the
state and district codes, species codes, sawmill status,
buyer codes and country codes (Figure 11). This is
an important module as new codes are assigned to new sawmills through
the log species submodule. New species can also be added to the SIS through
this module. A new code can be assigned without affecting the other modules.
In general, the state, district, buyer and country codes are seldom changed.
Figure 11. The information update module
A major advantage of the SIS is that data validation and accuracy improves tremendously.
This is because captured data can be validated immediately, by running the
data validation menu and errors can then be corrected. The SIS not only ensures
timely reports but also requires fewer human resources to maintain. As a result
of the better efficiency achieved in data processing, more time can be spent
on analysing the data set and more relevant reports and statistics can be
produced for management purposes.
The pop-up menu makes the SIS a very user-friendly system (Figure 12). Users can easily navigate through the SIS. The learning curve is also very short (a matter of minutes).
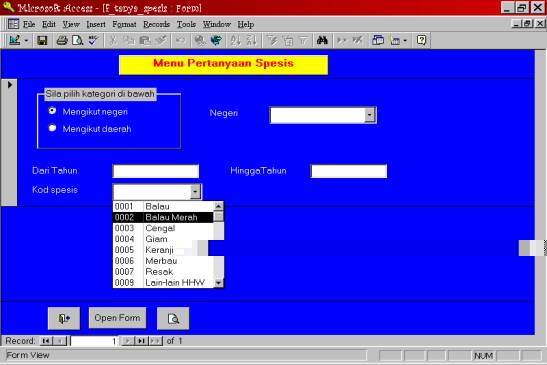
Figure 12. The pop-up menu
Another strength of the system is the flexibility and ease of accessing the SIS for information in the prescribed format. Users can go directly to the report module to access the various reports. Alternatively, users can create new reports in whatever format they require from the SIS. These reports can be generated within a very short period of time (in minutes for a simple report). The reports generated can also span a number of years when the data for the earlier years are added to the SIS.
During the early stages of implementation, the project team encountered teething problems such as the Microsoft Access database having a serious flaw that affects the way the software handles changes to the database records. The bug can corrupt database records without the user realizing that an error has occurred. The flaw occurs when the user deletes a record from the record set, using the Combo Box to edit another record, and then saves the changes. Access applies the changes to the record just before the intended target of the change. The project team detected this flaw as early as July 1998 but thought it was attributable to a bug in the input module. Furthermore, the flaw only occurs occasionally and the project team could not figure out why it occurred. It was only in late August 1998 that the project team learnt about the bug as reported by CNET News.com.
The SIS not only ensures timely reports but also requires fewer human resources
for maintenance. As a result of the better efficiency achieved in data processing,
more time can be spent on analysing the data set and more relevant reports
and statistics can be produced for management purposes. Two other systems
namely, the Plywood Information System (PLYSIS) and the Mouldings Information
System (MOSIS) covering the plywood mills (Shuttle No. 5) and the moulding
mills (Shuttle No. 8) have been developed by the team. PLYSIS became operational
in 2000, while MOSIS is scheduled for completion in 2001.
1. Name and address of sawmill
: ........................................................................
.........................................................................
.........................................................................
Correspondence address
: ........................................................................
(if different from above)
.........................................................................
2. Tel. no.
: ........................................................................
3. Fax no.
: ........................................................................
(if available)
4. E-mail
: ........................................................................
5. Licence no.
: ........................................................................
6. Date mill established
: ........................................................................
7. Date mill operating
: ........................................................................
8. Type of establishment
(tick 1 only)
(i) Proprietorship ……………
(ii) Partnership
(iii) Private Limited
(iv)Limited
Others
9. Ownership by country/race
|
Malaysian |
Bumiputera |
% |
|
Non-Bumiputera |
% |
|
|
Non-Malaysian |
(Name) |
% |
10. Fixed assets as at year end
(i.e. 31.12. ) or end of previous financial year
(i.e. )
11. No. of working days per year : ................................................
12. No. of working hours per day : ................................................
No. of shifts (average) per day
: ................................................
Number and types of machines used
(please record all used)
|
Types of Machine |
Power (kw) |
Number |
Name of mill:.......................................................
District: ...............................................................
Licence no.: …....................................................
FORM IV (b) TOTAL LABOUR FORCE AS AT END
JANUARY/APRIL/JULY/OCTOBER
|
Category |
Malaysian |
Non- Malaysian |
Total |
Salaries (per month) (RM) |
|||||||
|
Bumiputera |
Non- Bumiputera |
||||||||||
|
(01) |
(02) |
(03) |
(04) |
(05) |
(06) |
||||||
|
L |
P |
L |
P |
L |
P |
L |
P |
L |
P |
||
|
Owners & active partners |
1 |
||||||||||
|
Non-salaried family members |
2 |
||||||||||
|
Managerial & professionals Professionals Non-professionals |
3 |
||||||||||
|
4 |
|||||||||||
|
Technicians & supervisors |
5 |
||||||||||
|
Clerks & typists |
6 |
||||||||||
|
General workers |
7 |
||||||||||
|
Workers employed directly Skilled Unskilled |
8 |
||||||||||
|
9 |
|
||||||||||
|
Workers employed through contractors |
10 |
||||||||||
|
TOTAL |
11 |
||||||||||
L = male
P = female
Name of mill
: ................................................
District: ......................................................................
Licence no.: .........................................................
FORM IV (c): INPUT OF SAWLOGS & PROCESSED
AND
SAWN TIMBER
PRODUCTION BY SPECIES
MONTH: ……………………
|
Species |
Beginning stock (m3) |
Price of sawlogs (RM/m3) |
Sawlogs in log yard (m3) |
Sawlogs proc’d (m3) |
Sawn timber (m3) |
|||
|
Air dried |
Kiln dried |
Total |
||||||
|
(01) |
(02) |
(03) |
(04) |
(05) |
(06) |
(07) |
(08) |
|
|
Balau |
1 |
|||||||
|
Red Balau |
2 |
|||||||
|
Cengal |
3 |
|||||||
|
Giam |
4 |
|||||||
|
Keranji |
5 |
|||||||
|
Merbau |
6 |
|||||||
|
Resak |
7 |
|||||||
|
8 |
||||||||
|
Other HHW |
9 |
|||||||
|
TOTAL HHW |
||||||||
|
Kapur/Keladan |
11 |
|||||||
|
Kasai |
12 |
|||||||
|
Kelat |
13 |
|||||||
|
Keledang |
14 |
|||||||
|
Kempas |
15 |
|
||||||
|
Keruing |
16 |
|||||||
|
Kulim |
17 |
|||||||
|
Mata Ulat |
18 |
|||||||
|
Mengkulang |
19 |
|
||||||
|
Merpauh |
20 |
|||||||
|
Simpoh |
21 |
|||||||
|
Tualang |
22 |
|||||||
|
23 |
||||||||
|
Other MHW |
24 |
|
||||||
|
TOTAL MHW |
25 |
|||||||
|
Bintangor |
26 |
|||||||
|
Durian Hutan |
27 |
|||||||
|
Geronggang |
28 |
|||||||
|
Jelutong |
29 |
|||||||
|
Kedondong |
30 |
|||||||
|
Kembang Semangkok |
31 |
|||||||
|
Kungkur |
32 |
|||||||
|
Macang |
33 |
|||||||
|
Medang |
34 |
|||||||
|
Melunak |
35 |
|||||||
|
Red Meranti |
36 |
|||||||
|
White Meranti |
37 |
|
||||||
|
Yellow Meranti |
38 |
|||||||
|
Merawan |
39 |
|||||||
|
Mersawa |
40 |
|||||||
|
Nyatoh |
41 |
|
||||||
|
Ramin / Melawis |
42 |
|||||||
|
Sepetir |
43 |
|||||||
|
Sesendok |
44 |
|||||||
|
Terentang |
45 |
|||||||
|
Meranti Bakau |
46 |
|||||||
|
47 |
||||||||
|
Other LHW |
48 |
|||||||
|
TOTAL LHW |
49 |
|||||||
|
Damar Minyak |
50 |
|||||||
|
Hevea wood |
51 |
|||||||
|
GRAND TOTAL |
65 |
Name of mill: ...........................................................
District: .....................................................................
Licence no.:
: .........................................................
FORM IV (d): IMPORTED SAWLOGS BEING PROCESSED
MONTH: __________________
|
Species |
Price of sawlogs (RM/m3) |
Sawlogs imported (m3) |
Imported sawlogs being processed (m3) |
Country of import |
|
|
(01) |
(02) |
(03) |
(04) |
(05) |
|
|
Balau |
1 |
||||
|
Merbau |
6 |
||||
|
Jati |
8 |
||||
|
Kempas |
15 |
||||
|
Bintagor |
26 |
||||
|
Kembang Semangkok |
31 |
||||
|
Red Meranti |
36 |
||||
|
Nyatoh |
41 |
||||
|
Meranti Bakau |
46 |
||||
|
Dark Red Meranti |
60 |
||||
|
GRAND TOTAL |
|||||
Nama Kilang: ...........................................................
District: .....................................................................
Nombor Lesen: .........................................................
FORM IV (e): DOMESTIC SALES
& EXPORT OF SAWN TIMBER
MONTH: __________________
Total sawn timber exported*
________________________m3
Total sawn timber being sold locally
________________________m3
|
Domestic Sales Of Sawn Timber |
|||||
|
Types Of Domestic Consumers + |
Total Sales (m3) |
Types |
Measurement |
||
|
‘Treated’ |
‘Untreated’ |
||||
|
(01) |
(02) |
(03) |
(04) |
(05) |
|
|
Furniture & Joinery |
1 |
||||
|
Mouldings Manufacturers |
2 |
||||
|
Construction Industry (including contractors) |
3 |
||||
|
Boat Builders |
4 |
||||
|
Boxes & Pallets Manufacturers |
5 |
||||
|
Tin Mining Industry |
6 |
||||
|
Agents & Dealers |
7 |
||||
|
Timber Merchants (hardware stores) |
8 |
||||
|
Public Sector (railway sleepers supplied to
KTM, telephone poles to TELEKOM, lamp poles to LLN) |
9 |
||||
|
Others |
10 |
||||
|
GRAND TOTAL |
11 |
||||
* refers to total exported from Peninsular Malaysia
+ refers to total sold in the country
Tables 2 and 3 are not referred to in the text
