![]()
![]()
![]()
It is not possible to know everything, everywhere, all the time. It is therefore necessary to design an optimal sampling system which still retains adequate spatial and temporal resolution, but is affordable and practical. A hierarchical strategy in which at the one extreme a few variables are measured regularly in a large number of places, and at the other extreme a large number of variables are measured in a few locations for a limited period, meets these requirements. The hierarchy divides fairly naturally into five tiers, each with more-or-less unique characteristics and roles (Table 1), although existing facilities often straddle more than one tier. The concept is applicable to the three main areas which GHOST is concerned with the land surface, freshwater ecosystems and ice surfaces each of which would have their own hierarchy, but sharing tier 5. The observing system could be built largely out of existing national and international observation systems, research centres and stations, with modest additions of stations and sites where representation is inadequate. A major effort towards methodological consistency and data management is needed.
The proposed hierarchy is incompletely nested. In other words, research centres (tier 2) are not necessarily made up of research stations (tier 3), stations by sites, and so on; but in most cases there are strong linkages between the tiers. Within the hierarchies for the land, freshwater and cryosphere, there is a balance between different types of systems: for instance between natural, agricultural and urban ecosystems on the land; between rivers, lakes, estuaries and ground water in freshwater systems; and between ice sheets, ice caps, glaciers and permafrost in the cryosphere. There is also a geographical balance, which ranges from broad representation at tiers 1 and 2, detailed representation at tier 3, unbiased sampling at tier 4 and complete coverage at tier 5.
Table 1. Roles and Characteristics of the Tiers.
|
Tier |
Role |
Characteristics |
Indicative numbers |
|
1. Large area experiments e.g., IGBP transcets, large catchment studies |
Understanding of spatial structure and processes. |
Cover a linear dimension of >100 km, very intensive sampling, highly integrated data sets. |
10 |
|
2. Research centres e.g., Large LTERS, large agricultural research stations. |
Understanding processes, experimentation, method development, data synthesis. |
Fundamental research on a crop, ecosystem or cryosphere type, one per major type. Generally expensive complex instruments. |
100a |
|
3. Stations e.g., Biosphere reserves, smaller national agricultural and ecosystem research sites, research catchments, small polar stations. |
Long-term measurement of variables which vary over periods from weeks to years. Calibration and validation of remotely-sensed variables. Trends of variables. |
Secure existence, representative of the range within a type, but not statistically unbiased. Frequent measurement of variables. |
1000a |
|
4. Sample sites e.g., US EMAP programme, UK country survey. |
Direct measurement of variables not observable by remote sensing, calibration and validation of remotely-sensed variables, status and trends of biome health. |
Infrequently visited(once per year to once per decade), large sample, statistically unbiased. |
10000a |
|
5. Remote sensing e.g., AVHRR, SPOT, Landsat. |
Spatial and temporal interpolation at scales down to 1 day and 30 metres. Extent of biome, ice sheets, etc., status and trends of a biome health. |
Frequent, complete coverage, variables mostly indirectly observed. |
Not applicable |
Notes: a The numbers indicated are estimates only and may vary significantly especially at tier 3. Approximately in the ratios: 35 natural ecosystems; 35 agroecosystems; 10 rivers; 10 lakes; 10 cryosphere.
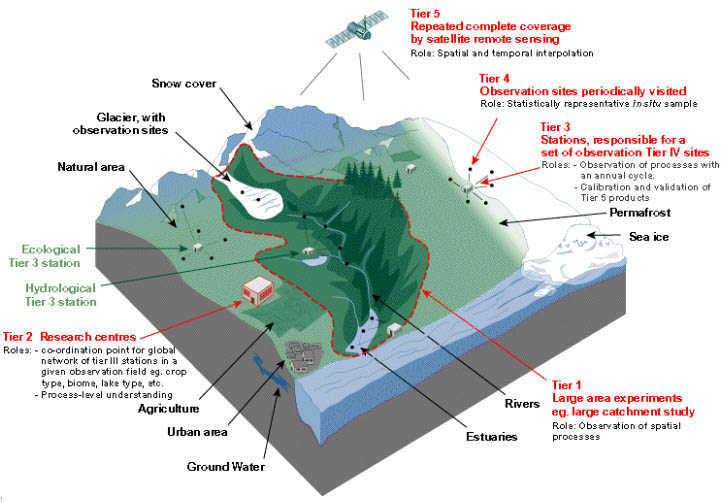
Figure 2. Diagrammatic Representation of GHOST.
![]()
![]()
![]()