by
Kjartan Hoydal
Secretary to the Advisory Committee on
Fishery Management (ACFM) of the International
Council of the Exploration of the sea (ICES)
Copenhagen, Denmark
INTRODUCTION
The area ICES is most concerned with is the North-east Atlantic (FAO fishing area 27, NEAFC regions 1–3, ICES sub-areas I-XIV) - see Figure 1. In 1982 advice was given on approximately 90 stocks, involving 21 working groups and 3 ACFM meetings. The following description will give a rough impression of the principal features of the area.
NEAFC region 1 is dominated by single-species fisheries, especially on gadoids in the demersal fisheries and at present on capelin in the pelagic fisheries, with the formerly very rich herring stocks in a heavily depleted state. In general the sampling of and research on these stocks and fisheries provide an adequate basis for reasonably accurate descriptions of the state of the stocks. The levels of fishing mortalities are also, generally speaking, not excessively high and the exploitation patterns are sensible (mesh sizes in demersal fisheries ranging from 120 mm to 155 mm).
In NEAFC region 2 the fisheries, with few exceptions, are of a more mixed nature, especially in the North Sea, with a competition between human consumption (larger mesh sizes) and small-meshed fisheries. A number of stocks have been reasonably well studied, although the mixed nature of the fisheries makes description quite difficult. For some stocks lack of data on the numbers taken in small-meshed fisheries and discards hampers the assessments seriously; further, with high fishing mortality levels and low age of entry to the fisheries, the lack of accurate estimates of the size of incoming year classes makes projections of catch and stock levels very difficult. The introduction of catch quotas without the necessary enforcement to control them has for some stocks meant a drastic deterioration of the basic catch statistics.
In NEAFC region 3 the demersal fisheries are very mixed and the effective mesh size very low, resulting in a very unfavourable exploitation pattern. It has not yet been possible with the present data base to make actual projections, but a marked improvement in sampling and research will probably change this. The situation is better in the pelagic fisheries.
It can be seen that the advisory system of ICES must cope with a variable information basis, with respect to both the actual situation in the fisheries and the data on which the advice has to be based.
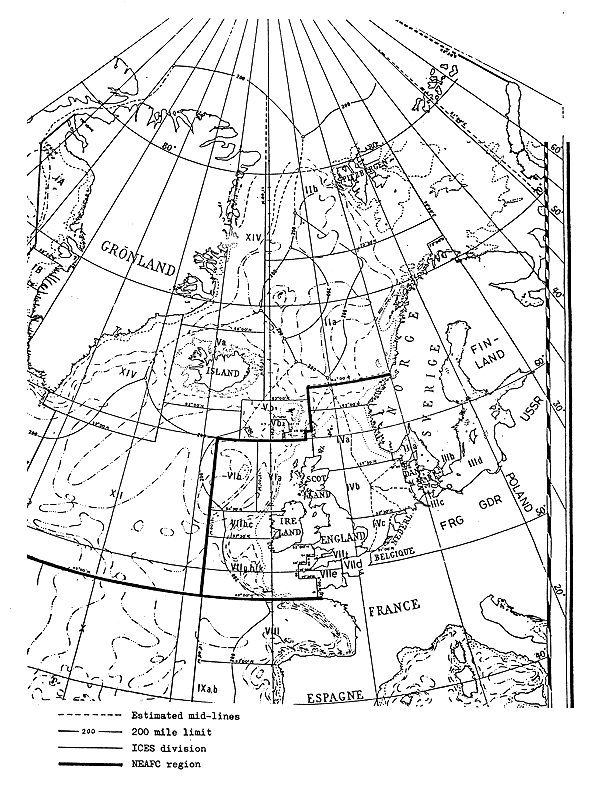
The designations employed do not imply the expression of an opinion whatsoever on the part of ICES concerning the legal status of any country or concerning the delimitation of its frontiers or boundaries.
Figure 1
The advice of ICES is submitted to the member States as well as to the North-East Atlantic Fisheries Commission (NEAFC) and the International Baltic Sea Fishery Commission (IBSFC), which have no scientific bodies of their own. The ICES area includes the EEZs of the following, starting from the north: Iceland, Faroe Islands, Norway, USSR, EEC (with 7 member States of ICES), Sweden, Finland, Poland, German Democratic Republic, Portugal and Spain.
THE PRODUCTION OF ADVICE BY WORKING GROUPS AND ACFM
Changes in international fisheries and the Law of the Sea have introduced changes in the formal advisory process within ICES over the years, but the basic philosophy has remained unchanged.
First, the basic description of the fisheries and the stocks exploited has been given by a working group which, ideally, has included scientists directly involved in the assessment work on a national level. Secondly, this description has been scrutinized by another group, up to 1978 the Liaison Committee and from 1978 onwards the ACFM, and converted to management advice.
The advantage of this system has been that the full utilization of specific local expertise has been guaranteed, while at the same time the later scrutiny of the Working Group Reports has secured a certain uniformity in quality and approach in all areas. The risk of contaminating the basic description with political considerations has also been reduced.
Up to 1974 the product from ICES was essentially a description of the state of the stock giving, if possible, an estimate of the fishing mortality level and, if any specific regulatory measures were discussed, these were mainly gear or area regulations.
From 1974 onwards catch regulations were to a higher and higher degree brought into focus, and at the time ACFM was set up the ICES product was, for almost every fish stock assessed, a recommended single figure TAC - every year. The basis of the recommendation was purely biological and is outlined in Cooperative Research Report No.62 (1977).
In 1980 ICES took steps to intensify the dialogue with managing bodies, and as a result, the product of the last two years has changed and is now an array of options “inside safe biological limits”, which gives the managers the possibility of taking into account other factors than those strictly dependent on the biology of the stocks, on condition that none of the options given would endanger recruitment.
THE WORKING GROUPS AND THEIR METHODS
It should be noted that the changes in fisheries in the 1970s following the introduction of the EEZs had a very marked effect on the assessments or on the possibilities for producing accurate assessments. This was realized by the Liaison Committee already in 1972 (Coop.Res.Rep., No.31): “With the rapid changes in the fisheries and with the introduction of catch regulation, the comparability of the present abundance indices will become less and less precise. They are based on long established national patterns of fishing. Closed seasons, closed areas or quotas will disrupt these patterns, making it essential to obtain estimates of stock size independent of catch and effort data …”
Where a working group in the early 1970s would have had a rather good measure of fishing intensity from long effort series or a measure of abundance from long catch per effort series, both describing fisheries which had been stable for many years, the working groups of the late 1970s found these important data series completely disrupted by the large-scale changes in fleet composition.
Further, the introduction of catch quota regulations demanded that ways be found to make very accurate predictions of catches in the years to which the catch quotas were to apply. This is a much more difficult task than indicating the general stock situation (e.g., the position of the present F on the yield per recruit curve).
The typical working group procedure to cope with this has been as follows:
The group establishes a data base with data for several years. At each meeting, this is updated with data for the last year in preliminary form, and the data for the year preceding it are brought into final form.
The data include yield by country, catch in numbers by age and country, and possibly catch per effort data and fishery-independent data (surveys, etc.). Table 1 shows the data available to the working groups meeting in 1981. It will be seen that the data base is rather variable.
The data on catch at age by country are aggregated to a combined estimate of total catch by age and year, and a VPA is run, which only differs from that of the previous year in that one year has been added.
Trial VPA runs are made. If data are at hand these are calibrated to effort data or survey data. Circumstantial evidence might also be used at this stage. At some point the group agrees on one of the trial runs as the final version.
Fishing mortality level for the last year and exploitation pattern are taken from the VPA, and from this and the catch, the stock as of 1 January in the year of the assessment is calculated.
To make a prediction for the following year, catches in the year of assessment have to be assumed and recruitment has to be estimated or assumed. Then projections of catch and stock biomass for the following years are calculated.
Schematically the procedures can be described as given below:
| Fishing mortality estimated, total level and exploitation pattern | Stock as of 1 January calculated, catches assumed | Stock and yield projected |
| Last year with data | Year of assessment | Year of advice |
PROBLEMS EXPERIENCED BY THE WORKING GROUPS
Table 1 shows which data are available for assessments of different stocks in the ICES area (Hoydal, 1981).
For the stocks where no analytical assessment has been possible, a precautionary TAC only can be indicated from catch figures over several years.
In a number of cases where an analytical assessment has been undertaken, the working group has only the catch at age data to go on, which means that the VPA cannot furnish a starting point for a projection. This makes the calculation of a TAC with any degree of certainty impossible. Experience has, however, shown that in some cases detailed knowledge of the fishery and anecdotal information of any kind can be very helpful, making it possible to pick one VPA to furnish the starting point for a projection. The best examples are the assessments done by the saithe working group (CM 1982/Assess:9).
Some groups will in addition to their catch at age data have detailed data on effort. The calibration of VPAs by effort data has been dealt with in recent ICES papers (e.g. CM 1981/G:5) and especially by the North Sea roundfish working group. There is no simple solution to this problem in a mixed fishery situation such as that in the North Sea, and experience has shown that the consistency of the effort series through the years used is especially critical.
Table 1 Data available to Fish Stock Assessment Working Groups' Meetings, March-May 1981
| Region | Yield Data | Catch at Age Data | Disoard Data | Fishery-independent Stock Estimate | Fishery independent Recruit Estimate | Effort Data | Comments | |||||||
| Unrep.catches | Available | Used | Available | Used | Available | Used | Available | Used | Available | Used | ||||
| Stock | ||||||||||||||
| NE Arctic | ||||||||||||||
| Saithe | x | x | x | Data on migration not used | ||||||||||
| Greenland Halibut | x | x | x | x | x | |||||||||
| Golden Redfish | x | x | x | x | Catches split by species on an area basis | |||||||||
| Beaked Redfish | x | x | x | x | x | x | ||||||||
| East Greenland | ||||||||||||||
| Prawn | x | x | Catch/effort data only covering part of the year | |||||||||||
| Cod | x | x | x | x | x | x | x | Migration data on age needed to improve assessment | ||||||
| East Greenland, Iceland, Farose | ||||||||||||||
| Greenland Halibut | x | x | x | Catch at age series short | ||||||||||
| Golden Redfish | x | x | x | x | Catch at age data based on age/length keys for only part of the fishery | |||||||||
| Beaked Redfish | x | x | x | x | ||||||||||
| Iceland | ||||||||||||||
| Saithe | x | x | x | |||||||||||
| Faroes | ||||||||||||||
| Cod, Plateau | x | x | x | x | x | x | Effort series short because of large-scalechanges in fisheries | |||||||
| Haddock | x | x | x | x | x | x | ||||||||
| Saithe | x | x | x | x | x | |||||||||
| Skagerrak Kattegat | ||||||||||||||
| Herring | x | x | x | x | x | x | x | x | x | x | Separation of autuan and spring spawning components and interchange with adjacent areas cause problems in this assessment. No TAC calculated due to discrepancies between data sets | |||
| Sprat | x | x | x | x | x | x | No TAC estimate for 1982 yet possible as the year class 1981, which is the main component of the fishery is not yet born | |||||||
| Cod | x | x | x | Precautionary TAC | ||||||||||
| Haddock | x | Precautionary TAC | ||||||||||||
| Whiting | x | x | Precautionary TAC | |||||||||||
| Plaice | x | x | Catch data not complete. TAC for Skagerrak on a precautionary basis | |||||||||||
| North Sea | ||||||||||||||
| Herring | x | x | x | x | x | x | Fishery-independent stock estimates from larval survey used. Acoustic survey not used. No TAC for 1982 | |||||||
| Sprat | x | x | x | x | x | x | Assessment for 1981 and 1982 only possible with shorter time lag between assessment and management. Acoustic surveys not used | |||||||
| Mackerel | x | x | x | x | x | x | x | Problems in stock delinestion between the two components. This applies also to Western stock | ||||||
| Cod | x | x | x | x | x | x | x | x | ||||||
| Haddock | x | x | x | x | x | x | x | x | x | |||||
| Whiting | x | x | x | x | x | x | x | x | x | |||||
| Saithe | x | x | x | x | Effort data for one country 1979–80, data on migration not used | |||||||||
| West of Scotland | ||||||||||||||
| Cod | x | x | x | x | x | x | x | x | ||||||
| Raddock | x | x | x | x | x | x | x | |||||||
| Whiting | x | x | x | |||||||||||
| Saithe | x | x | x | Precautionary TAC, due to problems with data base | ||||||||||
| Herring | x | x | x | x | x | x | x | x | ||||||
| Clyde Herring | x | x | x | Interchange with adjacent areas not quantifiable. No analytical assessment | ||||||||||
| Sub-area VII (excl.Div.VIIa) | ||||||||||||||
| Cod | x | No assessment | ||||||||||||
| Haddock | x | |||||||||||||
| Whiting | x | |||||||||||||
| Irish Sea | ||||||||||||||
| Herring | x | x | x | x | x | Composed by two different spawning units Manx and Mourne stocks | ||||||||
| Cod | x | x | x | x | x | |||||||||
| Whiting | x | x | x | x | x | x | ||||||||
| Plaice | x | x | x | x | x | x | x | |||||||
| Sole | x | x | x | x | x | |||||||||
| West of Ireland | ||||||||||||||
| Herring (Div.VIIb.c) | x | x | x | x | No analytical assessment due to problems with data base | |||||||||
| Herring (Div. VIIj) | x | x | x | No analytical assessment possible | ||||||||||
| Celtic Sea | ||||||||||||||
| Plaice | x | x | x | x | x | Low percentage of catches covered by age samples | ||||||||
| Sole | x | x | x | x | x | |||||||||
| Cod | x | x | x | x | x | Low percentage of catches covered by age samples | ||||||||
| Herring | x | x | x | x | x | |||||||||
| Northern Hake | x | x | x | x | x | x | x | Data bases have been very incomplete but are improving. Precautionary TACs | ||||||
| Southern Hake | x | x | x | x | x | |||||||||
| Northern Blue Whiting | x | x | x | x | x | x | x | None of the data sets can at present support an absolute stock estimate. Precautionary TAC | ||||||
| Southern Blue Whiting | x | x | ||||||||||||
| HERRING | By-catch and discard data very in-complete | |||||||||||||
| 22–24 | x | x | x | x | x | x | Migration data necessary | |||||||
| 25,26,27 | x | x | x | x | x | |||||||||
| 28, 298 | x | x | x | |||||||||||
| Gulf of Riga | x | x | x | |||||||||||
| 29M, 30, 31 | x | x | x | x | x | x | x | Only Eastern stock assessed. Data series too short on Western side | ||||||
| 32 | x | x | x | x | x | |||||||||
| SPRAT | ||||||||||||||
| 22,24,25 | x | x | x | x | x | |||||||||
| 26, 28 | x | x | x | |||||||||||
| 27,29–32 | x | x | x | |||||||||||
| COD | ||||||||||||||
| 22 | x | x | x | x | x | x | Discard data limited. Migration data necessary | |||||||
| 24 | x | x | x | x | x | x | x | Low percentage of catch covered by age samples. Migration data necessary | ||||||
| 25–32 | x | x | x | x | x | x | x | |||||||
| SALMON | x | x | x | x | ||||||||||
However, the major difficulties in making sufficiently accurate projections have occurred in two general situations, both hinging on the problem of predicting recruitment: when dealing with very short-lived species and with fisheries where the fishing intensity is very high. In both cases the fishery will be dependent on the strength of incoming year classes, and without methods to estimate this accurately it is impossible to predict yields corresponding to a given level of fishing mortality with any certainty. An improvement in the possibilities for making more detailed analyses of the abundant survey data from the North Sea is expected to reduce the scale of this problem.
For pelagic species, where catch per effort data are of no use, survey data are used extensively, and especially in the Barents Sea and the waters around Iceland the echo-integration surveys on herring and capelin have reached a high level of accuracy, which then allows quite accurate projections to be made.
There are in addition some major steps to be taken in the use of echo-integration for demersal species in the Barents Sea (CM 1983/Assess:2). These should give estimates of absolute stock size for calibration of the VPAs, in contrast to the indices which are output from most demersal surveys, and which demand a reasonable time series before the data can be of use.
Although in general requests addressed to ICES from managing bodies only ask for advice one year ahead, some working groups have tried to work out medium-term prospects. This would correspond to an attempt to define a medium or long-term level of fishery. The question of estimating recruitment in the years to come becomes then a major concern. It has not been possible to establish any clear stock-recruitment relationships which can be used, so either an average figure is calculated from the historic evidence of the VPA or the recruitment is treated as a stochastic variable, assuming that it can be described by a suitable distribution. This again allows calculation of the probabilities of reaching, e.g. a certain stock level or a certain yield (CM 1983/Assess:1).
THE ACFM FILTER
The working group reports are scrutinized by ACFM. This might result in major reassessments, if ACFM is not able to accept the findings of a working group or if it has reservations about methods or assumptions. In most cases ACFM will accept the assessments and translate them into actual advice. The form of the advice has changed. In the early days of ACFM, it would recommend a single figure. Now the presentation will be as seen in Figure 2. A summary of the history of the fishery and the stock, the yield curve with the present exploitation pattern, and a figure showing the consequences of different fishing intensities in the short term are given. In the body of the ACFM report options within safe biological limits are given and eventual additional conservation measures are indicated.
It should be noted that this two-tier system is quite time consuming. In 1983, for example, the first round of working group meetings starts in late February and ends in mid-April. With one to three group meetings at a time at ICES headquarters. The reports from these meetings have to be ready for the ACFM meeting in mid-May. A second round of meetings takes place in June, and the last group meets in September/October, reporting to a meeting in November. So altogether the advice for 1984 is an almost continuous process from February to November, and the managing bodies will not receive the final information from ACFM before late November. There can be a large gap between the actual time of the assessment made at a working group meeting and the time when the management advice is finally passed to the managers through ACFM.
| STOCK FAROE PLATEAU COD | SUB-DIVISION Vb1 | ||||||||||
| CATCH REC. TACs | |||||||||||
| 1977 | 1978 | 1979 | 1980 | 1981 | 1982 | ||||||
| C | TAC | C | TAC | C | TAC | C | TAC | C | TAC | TAC | TAC |
| 35 | 30 | 27 | 28 | 23 | 26 | 21 | 22 | 23 | 14 | 20* | |
| * Catch level preferred by ACFM | |||||||||||
| EFFECTIVE MANAGEMENT | |||||||||||
| 135 mm mesh in trawl gears is strictly enforced. Total allowable catches for Faroese boat-groups are not enforced. Foreign vessels are regulated by quotas. A system of “boxes”, and a trawl-ban inside 12 mile limit affects the exploitation. | |||||||||||
| QUALITY OF DATABASE | |||||||||||
| CATCH DATA | AGE/LENGTH DATA | EFFORT DATA | FISHERY INDEPENDENT | ||||||||
| Adequate | Adequate | Data on total effort adequate, but usefulness at present restricted by the short series. Also, effort directed towards cod may be difficult to estimate. | O-group surveys have been conducted since 1974. Still of restricted use in assessment | ||||||||
| DATA NECESSARY TO IMPROVE ASSESSMENTS | |||||||||||
| Fishery-independent survey data | |||||||||||
| THE 1982 ASSESSMENT | |||||||||||
| The spawning stock biomass has been declining from 120 000 tonnes in 1977 to 55 000 tonnes in 1981. However, in 1982–84 it is predicted to increase to the relatively high level of 80 000 tonnes. | |||||||||||
| Current fishing mortality is about 20% higher than Fmax. Predicted landings in 1982 are 25 500 tonnes. The catch for 1983 corresponding to Fmax is 23 200 tonnes. | |||||||||||
| MANAGEMENT | ADVICE | ||||||||||
| See para. 87 | |||||||||||
Faroe Plateau COD
Yield and spawning stock biomass per recruit
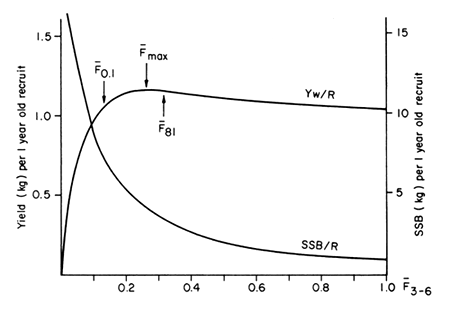
Faroe Plateau COD
Catch predictions for 1983 and spawning
stock biomass at 1 January 1984
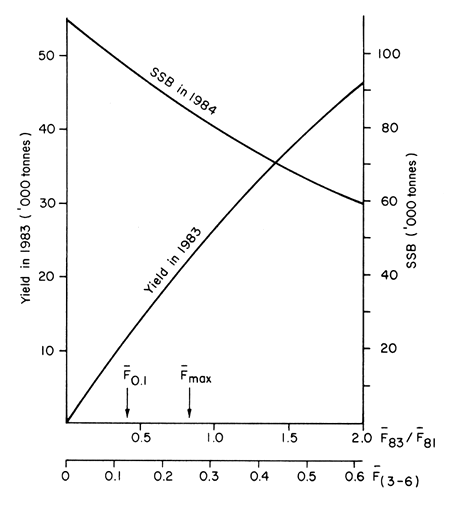
Faroe Plateau COD.
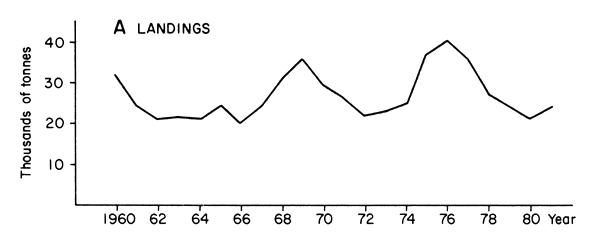
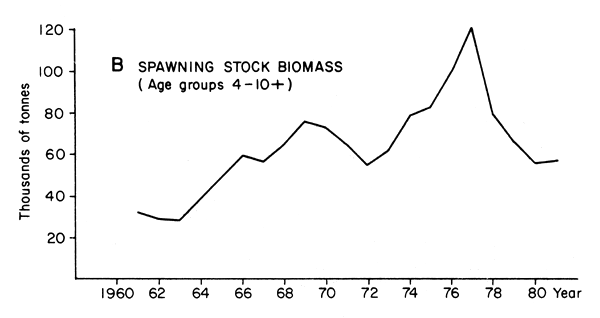
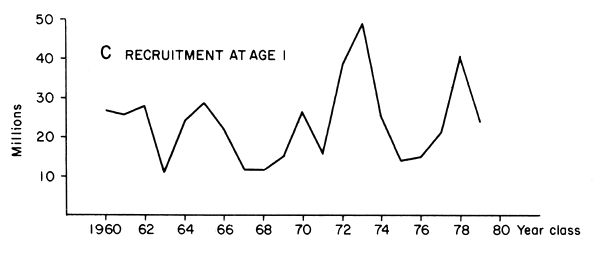
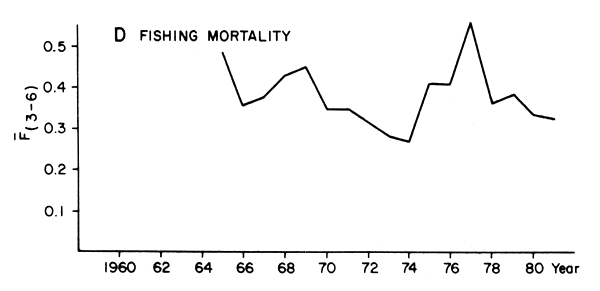
Figure 2 Example of Assessment/Summary, ACFM Report 1982
DISCUSSION OF THE PRESENT PROCEDURES INSIDE ICES
In the continuous discussion of the basis of the advice given by ICES, three major reservations in principle have emerged, leaving aside all the cases where disagreement over an assessment is due to shaky data allowing several interpretations.
Of these three reservations two basically challenge the science and the third deals with the role of advice given by ICES in what has been termed “the fisheries continuum” of biology, fishery and socio-economics.
BASIC SCIENTIFIC PROBLEMS IN THE PRESENT ASSESSMENTS
The advice given at present is based on the assumption that the scientists are able to predict or at least project the consequences of certain levels of fishery on the stocks. This is discussed above.
But a more general criticism has been that the assessments do not take into account biological interaction (multi-species assessments) or technical interaction (multi-species fisheries).
The obvious example of the former is that pursuing, say, fishing operations at a very low mortality level in all fisheries in a certain region would change the predation pattern, so the benefits projected would not show up. The results of a large-scale experiment on stomach analysis in the North Sea will, it is hoped, throw light on the subject for this area. In the Baltic multi-species, assessment has been attempted but the data do not yet allow any firm conclusions to be made (CM 1982/Assess:15). The implications for the projections are apparent.
The obvious examples of the latter are from NEAFC regions 2 and 3, where “clean” fisheries are very rare if they exist at all, and therefore the total mortality on any one stock is caused by the combined effect of directed catches and by-catches of a number of fleets. This has an especially strong impact on the interpretation of the projections. For some stocks, assessments are at present made by type of fishery, thus predicting, for example, for North Sea whiting the yield taken in human consumption fisheries, fish discarded, and fish taken in the industrial small-meshed fisheries (CM 1982/Assess:8). There is a growing interest in proceeding further in this direction and attempting to make assessments on a “fleet basis” (see e.g., Sparre, 1980), but so far the results in actual management advice remain to be seen.
THE PROCESS FROM THE BIOLOGICAL DESCRIPTION TO VIABLE MANAGEMENT ADVICE
From 1974 on, the TAC became the magic word in fish stock management in the North-east Atlantic. As the starting point for any negotiation in the commissions or between coastal States, it was a figure deciding the fate of fisheries. With hindsight it can be seen that the TAC concept did not bring home the primary message, stating clearly the real benefits of management in the long term. By focussing on the short tem only the hardships of management were highlighted, i.e., the inevitable cuts which had to be suffered before a more satisfactory situation could be reached.
In general, the problem of regulating fishing effort by TACs has been described on several occasions, such as in the 1981 ACFM report (Coop.Res.Rep., No.114).
One of the serious problems was that the TAC was not tied to any explicit reference point. Quoting from the 1978 Report of ACFM (Coop.Res.Rep., No.85). “ACFM has, throughout this report, attempted to base its advice on gradually reducing the exploitation rate and improving the exploitation pattern in a phased programme, so as not to cause too great disruptions in current fishing activities.”
So if, say, the assessment showed a fishing mortality level of 1.0, and the yield curve had an optimum at 0.2, ideally ACFM would for the first year calculate a TAC corresponding to a reduction in fishing mortality to 0.9, for the next year to 0.8, etc., until the appropriate level on the yield curve had been reached.
But it never turned out to be quite as simple as that. The following problems were encountered:
No management action to cut down the fishing activity is agreed to, so next year the starting baseline is unchanged or has even gone up.
A revision of an assessment gives a new estimate for the level of fishing mortality and a new exploitation pattern, so the baseline and the optimum aimed at change.
Although the ACFM report clearly states the assumptions underlying the advice, thsee tend to disappear in the later events and only the single figure, the TAC, remains. This figure, depending on the case, may mean anything from an exact optimum on the yield curve to a fishing mortality level several times that.
The single-figure advice does not give due consideration to other parts of the fisheries continuum, in effect giving the biologists the role of the managers and leaving to the managing bodies only the choice of accepting or rejecting.
As one of the results of the so-called Dialogue Meeting at ICES, this whole approach has been changed, so the ACFM has gone from “normative to exploratory advice” (Hoydal, 1982).
This has obviously solved one of the problems and, according to management bodies, has increased the usefulness of the advice given to a considerable degree (Report from the 4th Dialogue Meeting, 1982).
But there still remains the question of how to get the biological constraints into the right place in the management of fisheries.
As pointed out by several authors, including Gulland (1979), the scope of management is essentially economic and certainly not biological. It is, generally speaking, a planning problem, as are so many others in modern society, and the decisions to be made which can guide the system towards a desired stage demand knowledge of, among other things, the biology of fish stocks, the fisheries themselves, the economy of fishing operations and related industries, and the influence of the benefits from the fisheries on other parts of society.
These problems are discussed by the present Chairman of ACFM in a recent paper (Griffith, 1982): “Biological advice can really only establish one set of constraints within which management ought to be applied. Even with the increased flexibility now built into ACFM advice, in order to provide managers with a wider range of options, it would appear that a course of action recommended on biological grounds has little chance of being accepted (and probably no chance of being implemented or enforced) unless it lies within that part of the biological ‘field’ which overlaps with the economic ‘field’.”
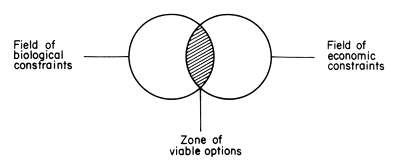
Based on the same kind of considerations ACFM, in its July 1982 report, has asked for a dialogue with economists on how to tailor the biological output to the needs of economic analysis.
Although this is a process which has just started on the ICES side, there has been a great deal of activity in this field on the national level, obviously an effect of the fact that, even though the fisheries may be international or multilateral, the socio-economic consequences must be evaluated on a national basis. Skimming through some of these attempts (e.g., Kristiansen, 1982) it is clear that one of the paramount demands is for better descriptions of “unit-fisheries” and “unit-fleets”, and a gross figure for what might be taken from a unit stock is not in all cases a useful basis for decisions by management trying to achieve some economic optimization. Thus the increasing interest from the assessment angle in investigating technical interaction fits in very nicely with what is probably needed to “tailor the biological output to the needs of economic analysis”.
THE TOTAL ALLOWABLE CATCH AND THE SURPLUS PROBLEM
From the above it is obvious that the concept of one figure for an allowable catch - as described in the International Convention adopted by the Third UNCLOS - which can be compared with actual catches in calculating a possible surplus, is not very meaningful.
When taking socio-economic factors into account, the concept seems to lose any sense. All kinds of allowable catches can be calculated, given economic and social constraints. Or, put differently, the TACs will depend on the management objectives.
This concept probably reflects the general lack of management objectives or targets for planning the fisheries.
DISCUSSION AND SUMMARY
Inasmuch as advice on management does not exist in a static world, ICES has also been undergoing changes, in response to changing demands.
Investigation into the period when ICES was providing a list of single-figure TACs shows that the following major problems were encountered:
Sufficient accuracy in the calculation of TACs corresponding to certain levels of fishing mortality is difficult to obtain for some stocks and areas for a number of various reasons.
The TAC is not based on any specific reference point, but can describe all levels of fishing mortality between the present level and a more optimal one.
The TAC concentrates on the yield in one particular year and does not stress the need for long-term planning. For the long-term regulation of fishing-effort levels the TACs are very blunt instruments.
The stock-by-stock figures are not very helpful in areas where fisheries are generally mixed.
The single-figure TAC does not easily allow constraints other than biological ones to be taken into account in the management process.
The problems listed under (1) and (4) cannot be solved by changing from normative to exploratory advice, as has already been done by ICES. The solution of problem (5) requires:
That the management objectives for the total fisheries continuum be stated.
That the basic descriptions of this expanded planning system - allowing useful projections to be made - be provided.
The interactive process to implement this has started in the North-east Atlantic, but up to now only on a national level.
REFERENCES
ICES Mimeographed Meeting Reports
ICES, 1981 Report of the ad hoc Working Group on the use of effort data in assessments. ICES CM. 1981/G:5 (mimeo)
ICES, 1982 Report of the North Sea Roundfish Working Group. Copenhagen, 23 March to 1 April. ICES CM. 1982/Assess:8 (mimeo)
ICES, 1982a Report of the Saithe (Coalfish) Working Group. Copenhagen, 20 to 27 April 1982. ICES CM. 1982/Assess:9 (mimeo)
ICES, 1982b Report of the Working Group on multispecies assessment in the Baltic, ICES Headquarters, 4 to 13 May 1982. ICES CM. 1982/Assess:15 (mimeo)
ICES, 1982c Report of the 4th Dialogue Meeting, Copenhagen, 8 October 1982 (draft) (mimeo)
ICES, 1983 Report of the North Sea Flatfish Working Group. Copenhagen, 20 to 25 September 1982. ICES CM. 1983/Assess:1 (mimeo)
ICES, 1983a Report of the Arctic Fisheries Working Group. Copenhagen, 21 to 28 September 1982. ICES CM. 1983/Assess:2 (mimeo)
ICES Cooperative Research Reports
ICES, 1972 Report of the Liaison Committee of ICES to NEAFC, 1972. Coop.Res.Rep.ICES, (31):27 p.
ICES, 1977 Report of the ad hoc meeting on the Provision of Advice on the biological basis for fisheries management. Charlottenlund, 5–9 January 1976. Coop.Res.Rep.ICES, (62):16 p.
ICES, 1979 Reports of the ICES Advisory Committee on fishery management, 1978. Coop.Res. Rep.ICES, (85):157 p.
ICES, 1982 Reports of the ICES Advisory Committee on fishery management, 1981. Coop.Res. Rep.ICES, (114):280 p.
Griffith, D. de G., 1982 Review of scientific advice on fisheries management, 1982. ICES CM. 1982/Assess:22 (mimeo)
Gulland, J.A., 1979 Long-term potential effects from management of the fish resources of the North Atlantic. ICES CM. 1979/G:58 (mimeo)
Hoydal, K., 1981 Review of the fish stock assessments made by ICES Working Groups in 1981. ICES CM. 1981/Gen:22 (mimeo)
Hoydal, K., 1982 From normative to exploratory advice on fishery management and the general framework of advice. ICES CM. 1982/Assess:21 (mimeo)
Kristiansen, A., 1982 En Bioøkonomisk simuleringsmodell av linefisket ved faerøyene (A bio-economical model of the long-line fishery in the waters around the Faroes). Tromsø, 1982 (in Norwegian)
Sparre, P., 1980 A goal function of fisheries (Legion analysis). ICES CM. 1980/G:40
Tambs-Lyche, H., 1980 The role of the International Council for the Exploration of the Sea (ICES) in providing scientific advice. Translated from Annu.Fr.Droit.Int., 26