by
Julio A. Baisre, Armando Pérez, Maria H. Obregon y Raul Cruz
Centro de Investigaciones Pequeras
La Habana
Cuba
1. INTRODUCTION
Progressive growth of fish landings in Cuban domestic fisheries during the last decade having approached and in some cases surpassed the potential yields for most demersal species, it has become necessary to develop several measures to control fishing effort. Regulation of fishing effort has been accomplished by using different methods according to the nature of the species being managed.
The case studies of three commercial species very important for the Cuban fisheries industry, with different life cycles and different habitats and fished with different gears, are presented in this paper.
Penaeid shrimps (Penaeus spp.) are currently exploited by industrial fisheries, without artisanal fisheries exploiting the juvenile stages living in estuarine areas. Shrimps also have a short life span and, as pointed out by Garcia and Le Reste (1981), the time unit which is used to describe the events must therefore be less than a year.
Lane snapper (Lutjanus synagris) is the most important individual fish species in Cuban shelf fisheries. Pre-spawning mass grouping of these fish takes place before the massive reproductive migration, which occurs from first quarter moon to full moon and from April to June with highest intensity in May. Fishermen already know the main migratory routes and set fixed nets which in a few weeks account for more than 50 percent of the annual catch.
Spiny lobster fisheries are carried out in the extensive shallow areas of the Cuban shelf where seagrass beds and coralline growth are abundant. Spiny lobster have a long life span and are caught with artisanal fishing gears.
Larval development takes place in oceanic waters far off shore and, because of a long larval life, possibilities that phyllosome produced in the south Caribbean sea could be recruited to the Cuban population can not be ruled out.
2. THE SHRIMP FISHERIES
Although this fishery has been carried on in Cuba for nearly fifty years, it was only in 1979 that concern arose that a state of over-exploitation had been reached, as shown by declining catches, and a research programme was launched to discover means to stop diminishing yields and restore the resource. What follows will mainly refer to the evolution of shrimp fisheries, management with respect to fishing effort regulation, as a general description of research carried out, assessments made and the management system has been recently presented by Baisre (1982). Special mention will be made of two cases, the Ensenada de la Broa fishery and the Manzanillo fishery.
2.1 Description
Since 1973, the fisheries have been conducted by trawlers, whose fishing power has been made increasingly uniform by the growing participation of standard Cuban ferro-cement vessels (17.9 m overall length), although there are steel trawlers (22.9 and 25.2 m overall length) fishing in deeper and less protected areas. Species caught are white shrimp (Penaeus schmitti) and pink shrimp (Penaeus notialis) with the last one forming the bulk of catches. The main recruitment period is from September to December when young sub-adult shrimps migrate in mass into the fishing grounds (Baisre and Paez, 1981).
Since 1976, each of the five enterprises exploiting the resource has a defined fishing area with a general statistical system based on 25 n.mi2 sub-areas for catch, effort and size composition reporting (Figure 1).
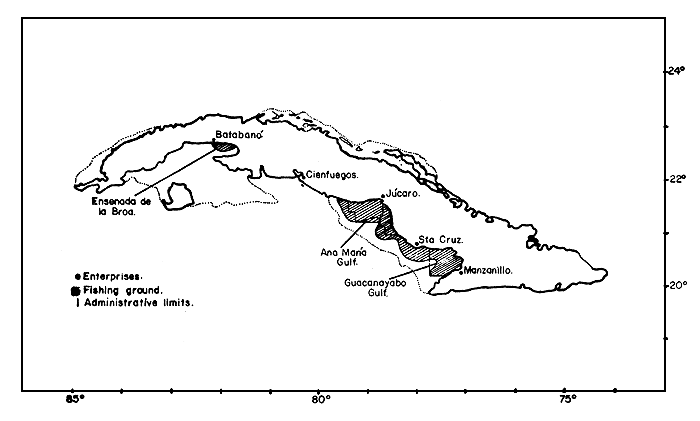
Figure 1 Distribution of commercial shrimp and fishing enterprises management areas
The fishing gear is the standard western jib trawl, used singly up to 1968–1971 when all vessels were changed to double rigged trawl. During 1972–1976, “twin” trawls were introduced, increasing again the fleet's fishing power. In 1979 it was felt the effort must be diminished (Pérez et al, 1980) and later assessments show (Pérez et al, 1981a) that it was about 1976 when the increase in efficiency of the gear and the number of vessels caused the exploitation level to exceed the one corresponding to MSY, so the need for effort regulatory-actions became evident.
In 1977 there was news from fishermen of the presence of fairly large quantities of shrimp in the Ensenada de la Broa area, 23 years after its spectacular discovery in 1953 and decline in 1954 (Pérez, 1954; Farfante, 1955). From the beginning it was defined as a unique experimental fishery area and monthly research cruises have been carried by the Centro de Investigaciones Pesqueras (CIP), statistics carefully recorded and monthly advise given on management by biologists in meetings with the fishermen and officers of the enterprise and the Ministry of Fisheries.
2.2 The Management System
Due to their short life cycle, high mortality and high economic value, shrimp population management needs to be flexible, operational and accurate (Pérez et al, 1981; Pérez, 1982), and for that reason a shrimp catch bureau was proposed by the CIP in 1980 (Pérez et al, 1980) to keep a continuous check on the fishery and population by a competent technical staff, in order to control fleet behaviour and obtain data to refine the assessments and fishery regulations. A concise statement of the general management system and management objectives for this fishery in Cuba is given in Pérez, et al. (MS). Since its inception the Catch Bureau has taken into account the “profit index” 1 (Pérez, in press) for areal/seasonal fleet effort allocation, as it gives a clear and synthetic measure of economic effort effectiveness. Though it is obvious that individual fishermen spontaneously look for areas of higher “profit index”, the limited area searched by each individually and the lack of cooperation among them make total fleet operation much less efficient.
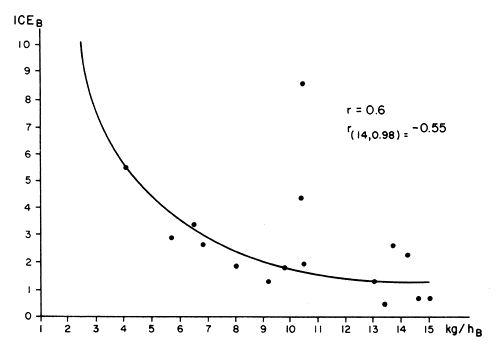
Figure 2 Relation between economic index of effort concentration (ICE) and c.p.u.e. for white shrimp (kg/h) in the Ensenada de la Broa fishery (from Pérez et al, 1981)
In Figure 2 is shown the relation between the monthly economic index of effort concentration, computed as the correlation between “profit index” and fleet effort by 9 n.mi2 for the Ensenada de la Broa white shrimp fishery and population abundance, expressed as the mean c.p.u.e. in research cruises; it clearly shows the steadily decreasing trend in efficiency towards a completely random effort distribution (concentration index value 1.0) as abundance rises and total daily gain per vessel approaches the mean satisfaction level. The evolution of the monthly c.p.u.e. index of effort concentration for the Manzanillo fleet before and after the Catch Bureau's operation is shown in Figure 3 where a clearly increasing trend in efficiency is noted.
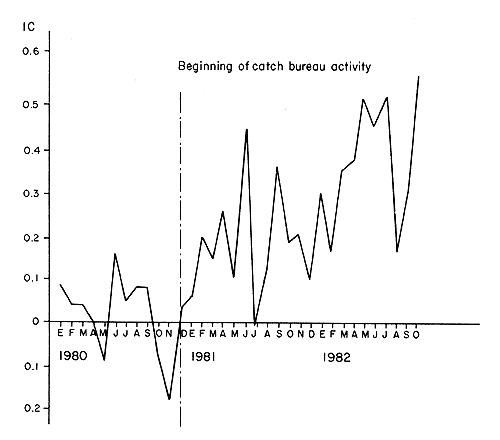
Figure 3 Monthly value for the “c.p.u.e. index of effort concentration” (IC) computed as the correlation between c.p.u.e. and effort per 25 n.m2 squares
2.3 Control of Fishing Effort
The Ensenada de la Broa Fishery:
This small area (1,450 km2), lying on the south-western part of Cuba, is isolated from the main south-eastern fishery by the deep waters of the Gulf of Cazones and supports an independent shrimp population distributed along its northern coast, comprising pink and white shrimp with the additional presence of the small rock shrimp (Sicyonia tipica) which is found only here in significant quantities. White shrimp is found no farther than six miles offshore, while pink and rock shrimp are distributed throughout the area, the younger pinks being nearer the shore (Figure 4).
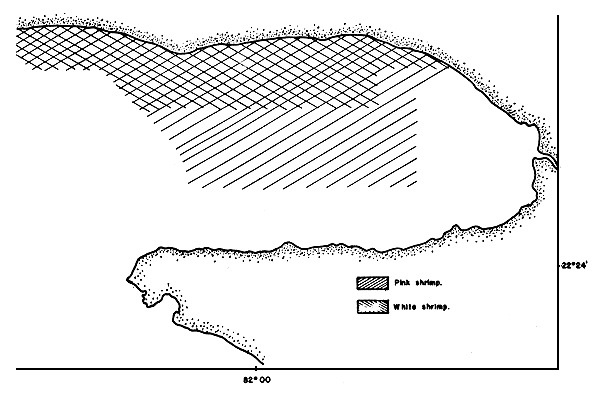
Figure 4 Distribution of white and pink shrimp in the Ensanada de la Broa
A detailed account of the fishery and a history of the management system will be given by Puga et al. (in preparation) from which most of the following has been taken.
The area has a maximum depth of 8.0 m and is situated far from the open sea surrounded by low and swampy land which provides a large freshwater input; all these features cause the basin to behave in a way resembling a very large coastal lagoon with its wide oceanographic variations and high productivity.
An outstanding feature is the complete absence of those estuaries and coastal lagoons considered typical for shrimp nurseries. Freshwater input is provided by some small channels and rivulets and the Hatiguanico River, with fast flows unsuitable for juvenile shrimp. The shrimp develop in two very narrow and small areas of shallow water near shore (Puga et al., MS) which are highly succeptible to human and environmental influence.
Since the onset of the fishery in November 1977, fishing vessels have used 25 mm mesh-size in trawls and the area has been under close surveillance so that rich data coverage for the shrimp population is available.
The faster growth rate of the shrimp and the shallow water up to one mile from the nursery grounds, which precludes trawling, assure a larger size of shrimp in catches as compared with other fisheries (Figure 5).
Exploitation began with two vessels and three vessels were fishing during 1978 when steps were taken to establish a statistical catch and effort reporting system based on 25 n. mi2. The system began in 1979 and, at the end of 1980, a 9 n.mi2 basis was adopted.
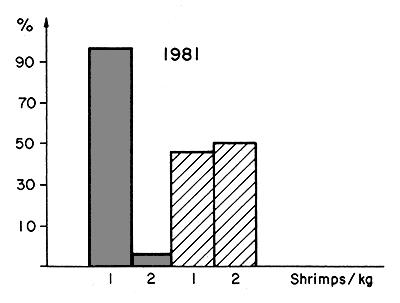
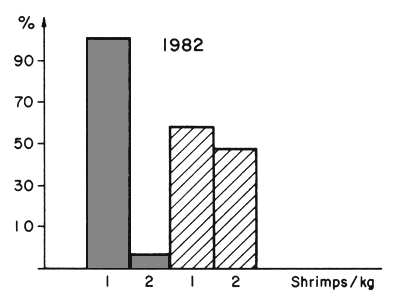
Figure 5 Percentage of large (1) and small (2) shrimp in Batabano (black) and the southeastern fishery (striped)
The spatial effort allocation analysis showed a heavy loading of effort on nearshore white shrimp, where high c.p.u.e. and size guaranteed good earnings. In 1979 five vessels worked in the area and two more began to fish in 1980, indicating that the difficulties there were to control the total effort increase, as the history of the fishery was so short and first assessments carried out by the swept-area method gave very high MSY figures (Puga and Formoso, 1978; Puga, MS). Besides the c.p.u.e. was much higher by then than in the rest of shrimp fisheries of the country.
In September 1979 occurred hurricane “Frederick”, a factor which triggered a chain of actions and reactions affecting fishery management and the shrimp populations and caused a sudden drop in salinity together with a mass mortality of pink shrimp, without damage to the more eurihaline white shrimp.
Soon after the hurricane, white shrimp began to attract almost all the fishing effort and the population was being rapidly decimated. By September 1980, with the establishment of the Catch Bureau, management became more active; a coastal belt three miles wide was established and fishing was banned inside it for three months to allow white shrimp recruitment to develop and restore the population. From then on, monthly meetings were held with the fishermen in order to explain the need for seasonal and spatial effort regulation. Concomitantly a shrimp price scale was established in which size composition and c.p.u.e. by species were taken into account, in an attempt to make both species equally desirable to fishermen and to provide a better effort allocation between species.
During the last four months of 1980, effort turned towards the pink shrimp and depleted its recruitment, though stock growth had been enhanced by the delayed effects of hurricane “Frederick”.
When the fishery for white shrimp started again on January 1981, c.p.u.e. was very high as a result of a very successful recruitment and there was a risk of effort over-concentration, so rigid controls and a system of vessel rotation were established allowing a specified number to fish the area during predetermined time periods.
Despite the opening of the coastal area, effort on pink shrimp seemed too high and it was decided, after much discussion, to keep it to a minimum from May 1981 onwards.
As was expected, the white shrimp c.p.u.e. decreased as the season progressed but, although the spawning stock was normal, 1981 recruitment surprisingly was a complete failure.
The crisis became evident when the depleted 1980 pink shrimp recruitment produced a lowered spawning stock and its recruitment also failed.
The fishery was stopped in November 1981 and a one-year closed season was decreed to allow both populations to recover. Monthly research cruises have shown a gradual recovery during 1982 which it seems will allow some fishing in 1983 when only four vessels will be appointed to the area.
The Ensenada de la Broa experience showed that, notwithstanding the benefits obtained by spatial and seasonal effort control and price manipulation, the two-key factors for the management of this fishery are strict control of total yearly effort and maintenance of a “buffer biomass” (Doubleday, 1976; Sissenwine, 1977) to assure a spawning potential large enough to overcome environmental fluctuations. In a very small fishing ground like the Ensenada de la Broa, such prevention becomes imperative.
The South-eastern Coast Fishery:
This area produces 96.2 percent of the total Cuban shrimp catch (Baisre, 1982). There is a number of recruitment groups from different estuarine systems along the coast (Pérez, MS) which, at least in the case of pink shrimp from the easternmost area (Manzanillo), were shown to be distinct enough in distribution, spawning areas, fecundity and growth rates to deserve to be treated as separate fishery units (Rodriguez and Pérez, 1981; Rodriguez et al., 1982) and very recent results on biochemical polimorphic proteins (Villaescusa, pers.comm.) have shown they also are genetically different groups.
Because these findings are taken into account in the general management strategy only to a limited extent, for most purposes the shrimp fishery is treated as two large populations, one in the Guacanayabo Gulf and the other in Ana Maria Gulf (Figure 1).
As is shown in Figure 6, the catch rose to a maximum in 1977 (the first maximum in 1974 was produced by the beginning of the exploitation of deeper areas) and fell continuously afterwards, while effort (in standarized fishery days) increased till 1978.
Annual catches of larger shrimp (13–58 shrimp per kg), expressed as percentage of total catch (Figure 7), show the generally increasing trend in mean size as a result of a sustained policy towards a quality increase. It exhibits a noticeable rise in 1980 as a result of the Catch Bureau's work and the added effect of a nation-wide mesh size change from 20 to 25 mm during 1981.
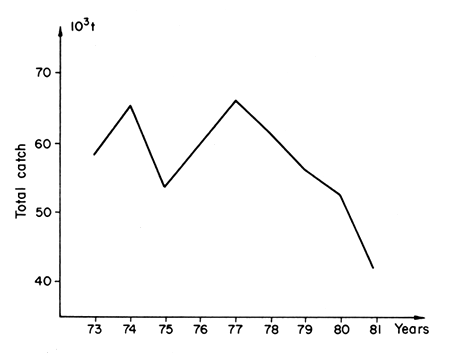
Figure 6 Annual catches from the south-eastern fishery
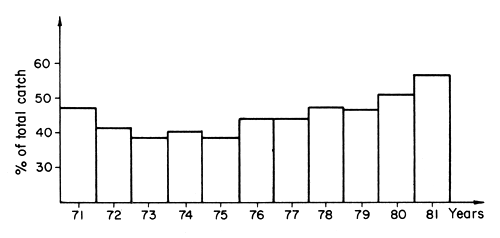
Figure 7 Annual catches of large shrimp (13–58 per kg) expressed as percentage of total catches in the southeastern shrimp fishery
The Manzanillo case:
While it is difficult to isolate the effect of individual regulations applied to the whole fishery, we expect explicitly to show its total effect in detail with the selected example of the Manzanillo fishery where most of the Ensenada de la Broa experience has been applied.
This is one of the oldest exploited shrimp areas in the country and underwent the general technological trend explained above from a coastal artisanal fishery to industrial trawling. As shown in Figure 8, total catch began to decline from 1977 onwards while effort rose.
Standarized fishing days (103)
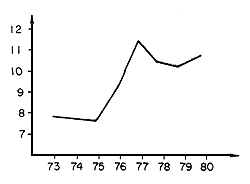
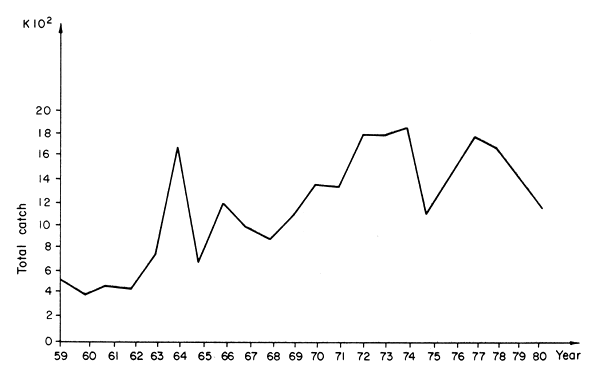
Figure 8 Catch and effort in the Manzanillo area
The Catch Bureau began to manage the fishery in December 1980 and by then an assessment of the area by structural and production models was available (Pérez et al., 1980) which showed the over-exploitated state of the fishery, the need for effort regulation and the likely results of the mesh size change implemented for this area in December 1980.
It was agreed that effort regulation must have three aspects: (1) diminishing total yearly effort level, (2) changing spatial and seasonal effort distribution, (3) showing advantages of the new mesh size and, as at least, the last two relied to a great extent on the willingness of fishermen to cooperate in enforcement, the main priority was to make them understand its need.
Regulation of total effort was approved by the Ministry of Fisheries on a step-by-step basis to allow relocation of displaced fishermen to other fisheries and, from 1980 to 1981, it was reduced by 9.6 percent.
Changing effort distribution proved to be a harder task; because most fishermen used to fish in nearshore areas where they were protected from bad weather conditions and could obtain rather large catches which, though composed mainly of small shrimp, bulk made profitable. Besides that, fishing in these deeper areas with abundant rocky patches and places of low accessibility required more skill.
To allow fishermen to operate in deeper areas, they were organized in small fleets (5 to 6 vessels) led by the most experienced skippers and the area was thoroughly marked with spar buoys and a booklet, with enlarged navigational charts of each fishing zone, was printed and distributed.
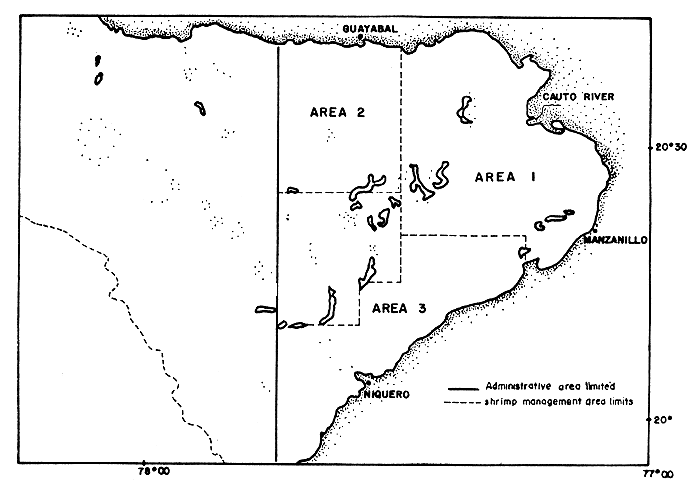
Figure 9 Manzanillo administrative area in the Guacanayabo Gulf and shrimp management areas within
Taking into account the distribution of the fishing units and their c.p.u.e., the area was split into three sub-zones (Figure 9) where small fleets rotated to minimize differences in fishermen's profits.
A further consideration was the protection of nursery areas and of sub-adults migrating into fishing grounds, making necessary the banning of night fishing in coastal areas near the mouth of Cauto River to assure proper exploitation of the white shrimp population by day fishing and lessening fishing pressure on small pinks which hide during daylight hours. Fishing effort was absolutely banned in a coastal belt 3.5 miles wide all along the management area from the middle of 1981.
As an important complement to redistribution of effort towards larger sizes, historical seasonal effort distribution patterns were assessed and found to be heavily loaded in the recruitment period (August to December) when a high c.p.u.e. in coastal areas is usually found. In 1980 the price scale by shrimp size was modified giving more weight to larger sizes; at the same time the Ministry of Fisheries has been steadily increasing the quality standards required in shrimp processing plants. All this, joined to a monthly planned effort and catch quota, favoured a progressive seasonal redistribution of fishing effort from the second to the first half of the year which was completely defined in 1981 (Figure 10).
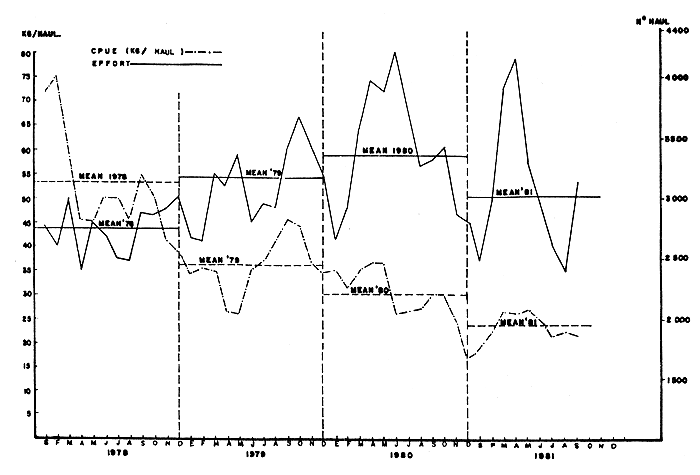
Figure 10 Seasonal effort and c.p.u.e. distribution on the Manzanillo shrimp fishery
In December 1980, the whole fleet changed simultaneously from 20 to 25 mm mesh size in trawls on account of a regulation adopted to improve size composition and to balance the high effort. The impact of this change can be detected from Figure 11 where monthly c.p.u.e. for large (13–58 shrimp per kg) and small (more than 58 shrimp per kg) is shown as percentages of corresponding months in 1980, i.e. the sharp rise in small shrimp in December 1981 due to fleet distribution. In (Figure 12) the total catch of large and small shrimp from January to September is shown for the years 1981 and 1982 as percentages of 1980 catches. It will be noticed that in 1981 the total catch diminished and that the decrease was mainly at the expense of small shrimp which could escape through the new mesh. In 1982 the population seems to have reached a new equilibrium as expected for this species (Garcia and Le Reste, 1981) with an increase in total catch mainly based on large shrimp.
It is clearly very difficult to ascertain how much of the catch increase has been due to each measure taken, but from the general picture presented it is clear that the whole system of regulations has had a strong and positive impact on this fishery.
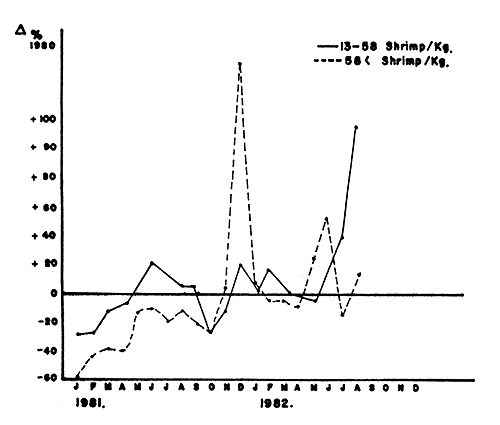
Figure 11 Observed differences in c.p.u.e. in weight of large (solid line) and small (broken line) shrimps after the increase of mesh size in Manzanillo area as percentages of the corresponding months in 1980
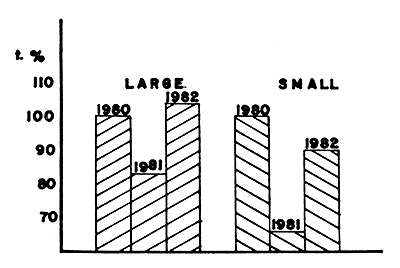
Figure 12 Catch of large and small shrimps from January to September in Manzanillo area from 1980 to 1982 expressed as percentages of the 1980's catch
3. THE LANE SNAPPER FISHERIES
3.1 Description
Like other artisanal or semi-artisanal fisheries in tropical and sub-tropical regions, lane snapper fisheries are conducted with a high diversity of fishing gears. Major fishing techniques currently used are trawling, trapping and set-netting (Baisre and Pérez, 1981). A more detailed description of fishing gears is given by Claro (1981).
Shallow waters around the Cuban south coast support more than 75 percent of the lane snapper catches, being those of the south-western region (Gulf of Batabano) the largest and most important fishing ground (Figure 13) accounting for more than 50 percent of the catches.
Catch trends are shown in Figure 14 where a positive growth may be observed until 1974 and from there on a sudden decrease because of the over-exploitation of the population on the major fishing ground in the Gulf of Batabano.
Lane snapper catches follow a marked seasonal pattern illustrated in Figure 15, with a main peak in May due to high fishing mortality during the mass spawning migration from April to June which is related to the moon's phases.
Buesa and Olaechea (1970) have determined the concentration areas where the lane snapper prespawning grouping takes place before the migratory movement to the spawning areas. According to Claro (1981) lane snapper migrants swim against the direction of the currents which, in the Gulf of Batabano, flow from east to west (Emilsson & Tapanes, 1971), spawning taking place on the edge of the shelf. About one month later fish larvae are carried back to the shelf aided by currents (R. Claro, pers.comm.) (Figure 16).
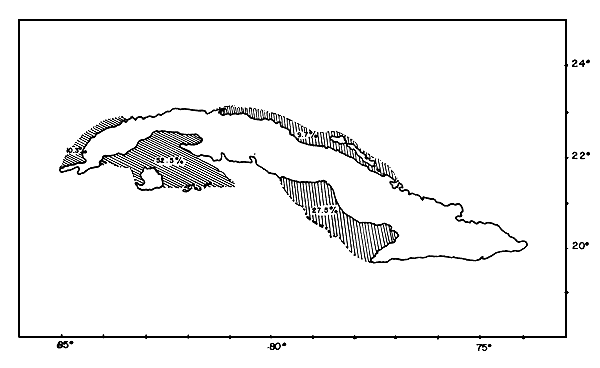
Figure 13 Distribution of lane snapper catches (in %) in the four shelf areas (Average from 1976–1980)
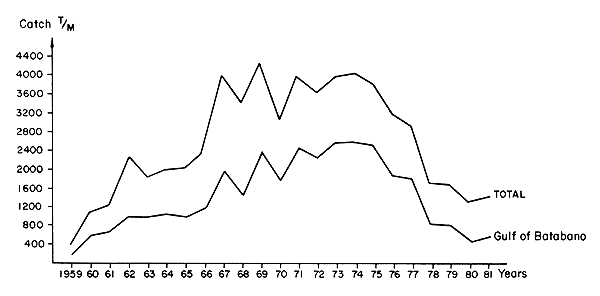
Figure 14 Yearly total and Gulf of Batabano catches of lane snapper from 1959 to 1981
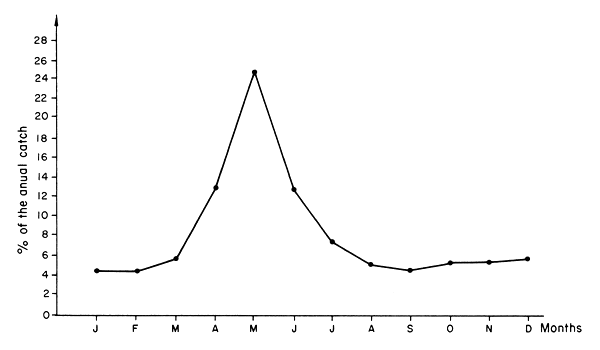
Figure 15 Monthly catches of lane snapper as a percentage of the annual catch (Average from 1962–1981)
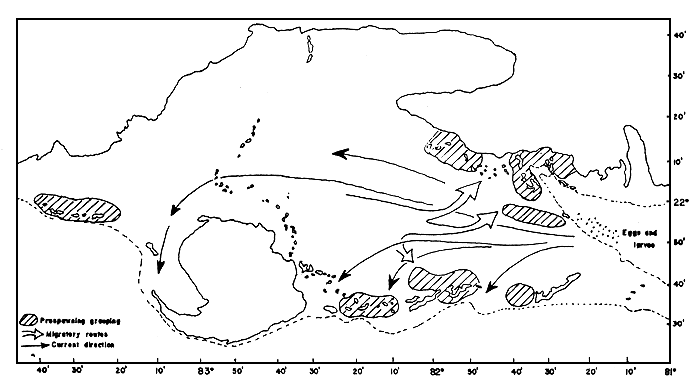
Figure 16 Spawning migration of lane snapper in the Gulf of Batabano (data from different sources)
3.2 Exploitation state
Until 1978 MSY estimates from stock assessments in the Gulf of Batabano were between 2,900 and 3,700 tons per year (Baisre and Paez, 1981) and a 3,090 t MSY was calculated in the latest assessment by Carillo (1979).
As shown in Figure 14, the catches from the Gulf of Batabano have never reached the lowest MSY estimate and despite this the species seems to be over-exploited, as indicated by the sudden decrease in the catches from 1975 onwards.
Unrealistic estimates of MSY, together with the lack of regulations, have been the main factors in this situation. Inaccuracy in measuring the effective effort, together with lack of information on stock-recruitment relations, were probably the reasons why stock assessments produced such results. Regulatory measures will be discussed below.
3.3 The management system
Basic assumptions are that there is only one self-sustained stock in the Gulf of Batabano and that effort regulation by seasonal closures during the mass spawning period is not feasible, because it would represent stopping the fishing activity when catches and c.p.u.e. are at their highest. Consequently, the regulation of fishing effort during the spawning season by quota allocation has recently become one of the most important goals in the management system for the lane-snapper fisheries.
3.4 Regulation of fishing effort
Seasonal closures were the most important fisheries regulation after 1959 but, unfortunately, they were interrupted after 1966 (Figure 17).
In recent years (1981–1982), as detailed below, regulations have been more elaborate, having included, besides quotas, some other measures like area closures on nursery grounds and a minimum legal size.
In 1981 the setting of a 135-t catch quota for the three vessels allowed to fish in the area is shown in Figure 18. The small “window” opened to the three vessels was agreed to in order to achieve a proper control of fishing effort and catch and to assess the state of the population by conducting an intensive sampling programme.
In 1982 the quota was raised to 250 t to be taken with three set nets inside the “window” together with any number of trawls outside it. A sampling and tagging programme was also carried out.
Another important fact to be taken into account is the number of under-sized fish caught during fishing operatioins with set nets, so a selective device which allows a 75-percent escapement of under-sized fish (Figure 19) (Obregon et al., 1981) will be introduced on every vessel from January 1983.
Figure 20 shows how the grey snapper (Lutjanus griseus) catch, a closely-related species, has increased during the period that lane snapper began to decline - the c.p.u.e. for the last three years also showing the same trend. As a 93.1 percent diet-overlap between them has been found (Voldés and Silva, 1977), research work for interactions between species must be undertaken.
Notwithstanding this situation and that a full impact assessment of the regulatory measures applied is not yet feasible, due to the species life span and the age at first capture (2–3 years old), it is thought that the set of regulations enforced together with the new selective device are sufficient to allow full recovery of the population from 1984 onwards.
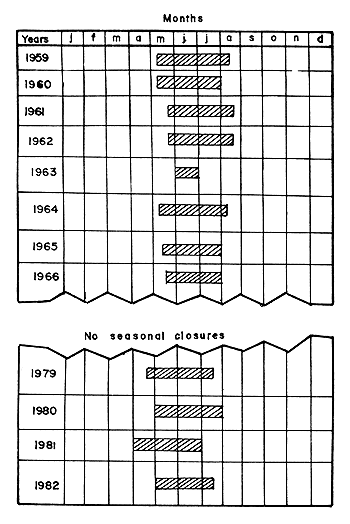
Figure 17 Seasonal closures for the lane snapper fisheries
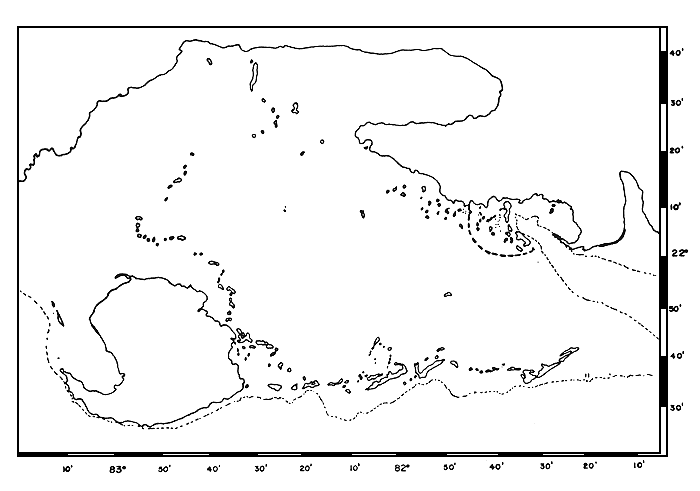
Figure 18 Map of the Gulf of Batabano showing the area where a “window” was open for quota fishing during 1981 and 1982
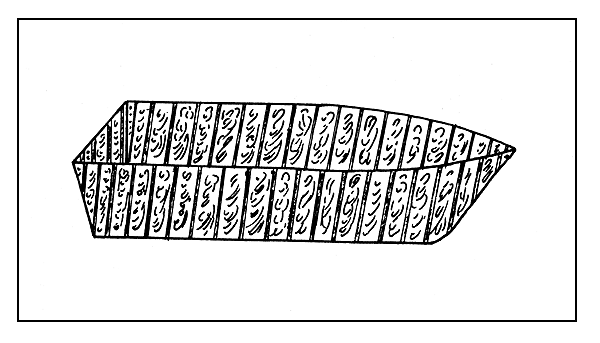
Figure 19 Boat shaped selective device to allow escapement of under-sized fishes
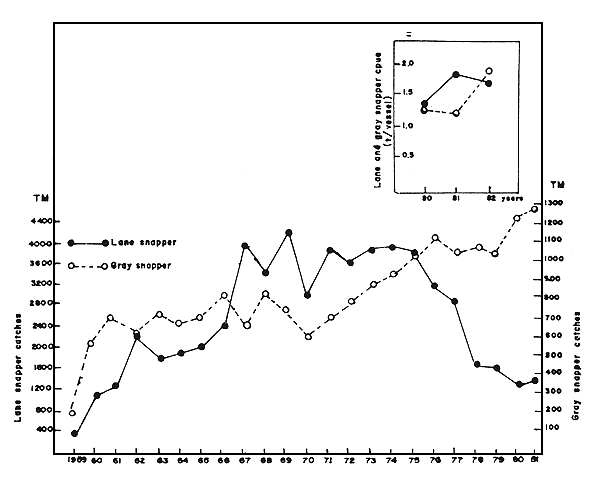
Figure 20 Catch trends of lane and grey snapper from 1951–1981. The small square shows the c.p.u.e. for both species.
4. THE SPINY LOBSTER FISHERIES
4.1 Description
Commercial fisheries for spiny lobsters began in the 1930s when the first processing plant was established at La Coloma, Pinar del Rio (Martinez, 1948).
Fishing gears have experienced several changes in the last two decades. Bully nets and Antillean S-traps were predominant until the end of the 1960s when they were replaced by different and more efficient fishing systems.
Spiny lobsters are currently fished using artificial shelters (pesqueros) together with trawl nets (chinchorros) handled by divers. A different fishing technique has also been used during the autumnal mass migration in October and November. Trap-like gears made with chicken wire and with large nets attached at the two front corners in a V pattern are placed singly or severally together in zig-zag pattern during the migratory season.
Spiny lobsters are widely distributed in all shallow-water areas with sea-grass beds and coralline growth on sandy or rocky bottom but the fisheries are more important on the south coast which accounts for 85 percent of the total catch (Figure 21).
Landings follow a seasonal pattern which is presented in Figure 22. A catch decline in February and March is followed by a closed season (usually between March and June) and then a sudden rise in June. Later on we have a small drop from July to September before reaching the main peak in October and November when migrating lobsters are mass trapped.
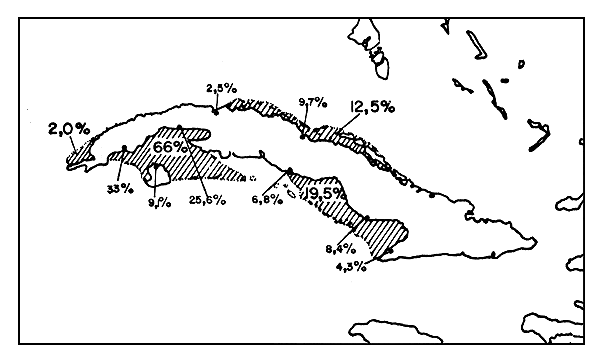
Figure 21 Major spiny lobsters fishing areas showing the average catch (as percent of the total catch). (Data from 1976–1980)
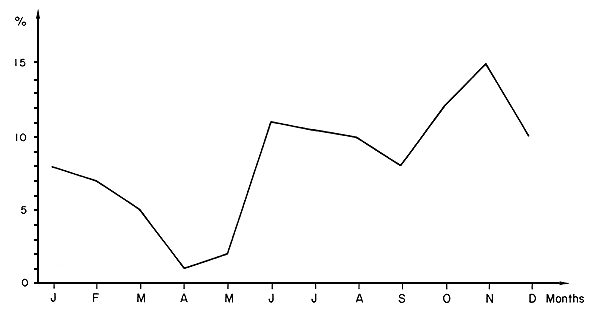
Figure 22 Seasonal trend of spiny lobster catches (average from 1962–1981)
4.2 Exploitation state
Spiny lobsters are intensively exploited not only because of their accessibility to the fisheries but also due to the high prices for lobsters in the world market.
Before 1978, the MSY for spiny lobster stocks was calculated at around 9,000 t per year (Bairse and Paez, 1981). At present stock assessments are difficult because the effective effort is unknown due to the fact that artificial shelters are under water during several months and fished irregularly. Accurate age determinations from VPA analysis is not available either.
Data on length composition for the lastest years (Figure 23) show, however, that a high percentage of the catch is derived from the newly-recruited lobsters (between 20 and 24 cm total length), which is indicative of the high fishing pressure that has been exerted upon the resource.
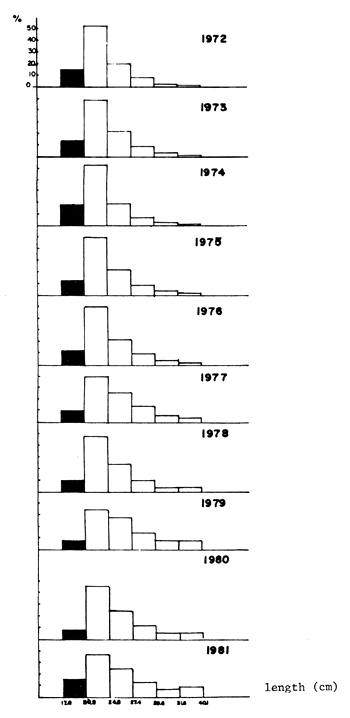
Figure 23 Size composition of spiny lobster landings (data from processing plants)
4.3 Management system
The management system for spiny lobster fisheries is primarily based on the assumption that stocks are essentially self-sustained and external recruitment is not of significant importance in the maintenance of the lobster population.
Arguments which support this view are that the over-exploitation of spiny lobsters in Brazil, the only important lobster ground in the south Caribbean, has not had a noticeably adverse impact on Cuban fisheries. Responses to regulation measures, which will be discussed below, are also an indicator that the self-sustenance hypothesis holds true.
4.4 Regulation of fishing effort
The most important regulations for spiny lobster fisheries are the minimum legal size and the closed season. Other restrictions are the prohibition on the catch of oviferous females and on spear-fishing.
Because spiny-lobster stocks are at the limit of their reproductive elasticity, minimum legal size measures have been designed primarily to enable the lobsters to reach sexual maturity in order to preserve the stock's reproductive capacity. The minimum legal size is 21 cm total length (about 6.6 cm length of cephalothorax), measured from the middle of the antennae to the tip of the telson.
Because recruitment to the fisheries occurs at lower sizes but close to the minimum legal size, juvenile lobsters are usually caught in artificial shelters and therefore these measures have also a positive secondary effect of protecting recruitment.
A closed season for lobster fisheries has been established since 1959, the duration and also enforcement being different from year to year. In Figure 24, three different periods might be observed: in the first one from 1959–1967 the closed season had a mean duration of three months (91 days), the second period from 1968–1977 had a mean of two months (58 days) and finally the last period had a duration of slightly more than three months (97 days).
The figure also shows the average c.p.u.e. for the first two months of the open season reaching its highest level (30 t/fishing day) when the closed season averaged more than three months. This rise in the c.p.u.e. is related not only to the lengthening of the closed season but also to a legal minimum size with strict enforcement on both. Closed-season duration is positively correlated (r = 0.639) (Figure 25) with the c.p.u.e. two months after the beginning of the open season.
The three periods mentioned above are also in agreement with the catch trend shown in Figure 26. From 1959 to 1967 there was a progressive increase in the catch until it reached about 9,000 t at the end of the period. From 1968 until 1977 the catch averaged 9,020 t and the trend was more regular. From 1978 onwards not only was the closed season extended but also enforcement was improved and control of the legal minimum size became more strict. As a positive consequence of such regulatory measures, catches from 1978–1981 have risen progressively, averaging 10,507 tons.
Although a concomitant effort increase might also be responsible for the higher yields of later years, there is no doubt that the higher c.p.u.e. after the closed season, the increase in the average size (Figure 27) and in the larger size groups (as shown in Figure 20) support the idea that regulatory measures were the main factors involved.
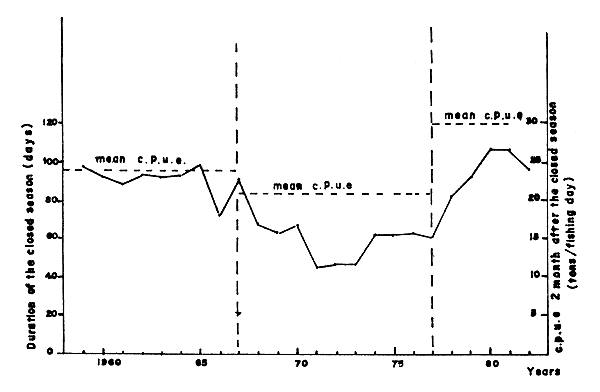
Figure 24 Closed season duration from 1959 to 1981 showing the average c.p.u.e. obtained during 3 different periods
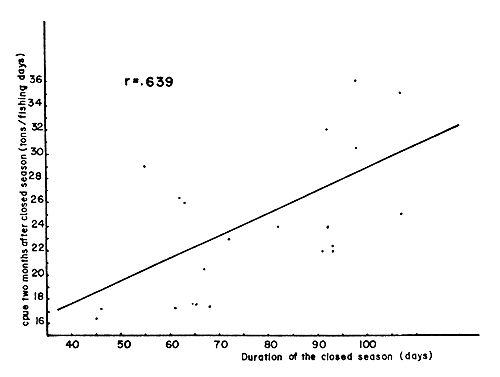
Figure 25 Correlation between the duration of the closed season and c.p.u.e. two months after the opening of the fishing season.
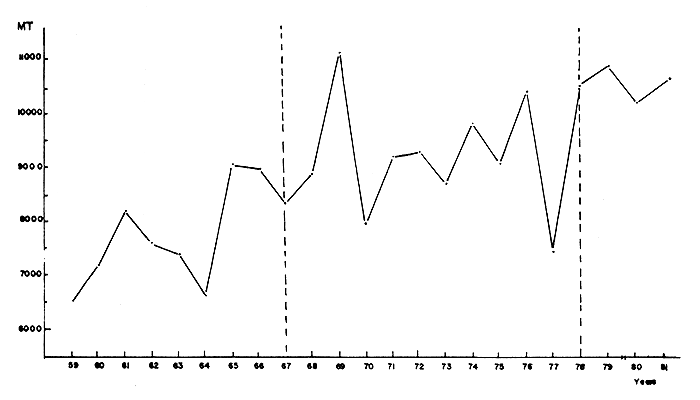
Figure 26 Catch trend of spiny lobster from 1959 to 1981. Three different periods are established according to the duration of the closed season.
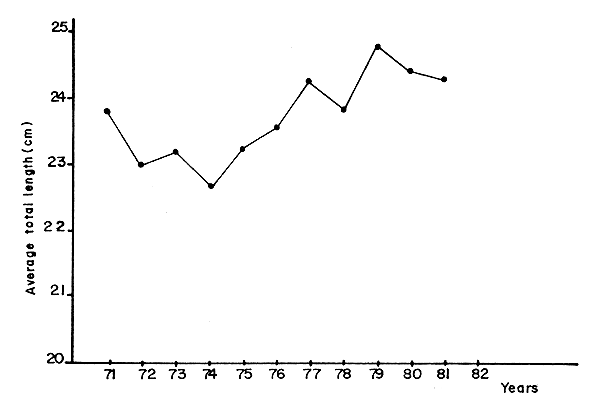
Figure 27 Mean size of spiny lobsters (data from processing plants)
REFERENCES
Baisre, J.A., 1982 Resultados de la administración científica de las pesquerías de camarones (Penaeus spp.) y langosta (Panulirus argus) en la plataforma Cubana. Documento presentado a la III Reunión del Grupo de Trabajo de la COPACO sobre evaluación de recursos pesqueros marinos. Kingston, Jamaica, 17–21 de marzo de 1982.
Baisre, J.A. and J. Páez, 1981 Los recursos pesqueros del archipiélago Cubano. WECAF Stud., (8):79 p.
Buesa, R.J. and A. Alaechea, 1970 Estudios sobre la biajaiba: zona B y áreas de Diego Pérez. La Habana, Cuba, INP/CIP, 25 p. (mimeo)
Carrillo, C., 1979 Estado de la pesquería de la biajaiba (Lutjanus synagris) en la plataforma suroccidental de Cuba. Rev.Cub.Invest.Pesq., 4(4):42 p.
Claro, R., 1981 Ecología y ciclo de vida de la biajaiba, Lutjanus synagris (Linnaeus), en la plataforma Cubana. II. Biología pesquera. Inf. Cient. Téc. Inst.Oceanol.Acad.Cienc.Cuba, (177): 53 p.
Doubleday, W.C., 1976 Environmental fluctuation and fisheries management. Sel.Pap.ICNAF, (1):141–50
Emilson, I. and J.J. Tápanes, 1971 Contribución a la hidrología de la plataforma sur de Cuba. Ser. Oceanol. Inst.Oceanol.Acad.Cienc.Cuba, (9):31 p.
García, S. and L. Le Reste, 1981 Life cycles, dynamics, exploitation and management of coastal penaeid shrimp stocks. FAO Fish.Tech.Pap., (203):19 p.
Martínez, J.L., 1948 Cuba's spiny lobster industry. Fish. Leafl.U.S.Fish Wildl.Serv., (294):19 p.
Obregón, M.H., I. Ramos and F. Pérez, 1981 Resultados de la experiencia de selectividad con viveros seleccionadores. Resúmenes III Foro Cient. del CIP, October 1981
Pérez, A., Zonas de cría y vías probables de reclutamiento del camarón en la costa suroccidental de Cuba. Archivo, Centro de Investigaciónes Pesqueras, Cuba, Diciembre 1980 (MS)
Pérez, A., 1982 Bioeconomía, administración pesquera. En Mesa redonda sobre camarón “características de las pesquerías y la dinámica poblacional del camarón en Cuba”. Publ. Centro de Inv.Pesq., Julio 1982
Pérez, A., R. Puga y G. Venta, 1981 Bioeconomía de la explotación de los recursos camaroneros. In Resúmenes, Primer Congreso Nacional de Ciencias Biológicas, 29–30 de Octubre de 1981, La Habana
Pérez, A., G. Venta y R. Puga, 1981 Dinámica de la pesquería mixta de camarón en el área de Manzanillo. Resúmenes. III Foro Científico del Centro de Investigaciónes Pesqueras, Octubre 1981
Pérez, A. et al., 1980 Resumen general de las pesquerías de camarón de la plataforma Cubana. Documentados presentados por el Centro de Investigaciónes Pesqueras a la I Reunión Nacional de Camarón. Cuba, Topes de Collantes, 5–6 Septiembre 1980
Pérez, A. et al., 1981 Documento de la Primera Reunión Anual del Consejo de los Buroes de Captura de Camarón para la II Reunión Nacional de Camarón, 16–17 Septiembre 1981
Pérez, A., et al., 1981a Tendencias administrativas actuales y posibles acciones sobre la pesquería de camarón en Cuba. Archivo, Centro de Investigaciónes Pesqueras, Enero 1981 (MS)
Pérez-Farfante, I., 1954 The discovery of new shrimp bank at Golfo de Batabanó, Cuba. Proc.Gulf Caribb.Fish.Inst., 6:97–8
Pérez-Farfante, I., 1955 El primer año de la pesca del camarón en aguas Cubanas. Proc.Gulf Caribb.Fish.Inst., 7:181–3
Puga, R., 1979 Resultados preliminares de las investigaciones pesqueras de camarón en la Ensenada de la Broa. Archivo, Centro de Investigaciónes Pesqueras (MS)
Puga, R. y M. Formoso, 1978 Situación actual de la pesquería exploratoria de camarón en la Ensenada de la Broa. Primero Foro Científico del Centro de Investigaciones Pesqueras, 3 p.(mimeo)
Puga, R., A. Pérez y G. Venta, Desarrollo del sistema administrativo en la pesquería de camarón de la Ensenada de la Broa (en preparación)
Puga, R., G. Venta, A. Pérez y S. Alfonso, 1982 Características de la etapa juvenil de Penaeus notialis y Penaeus schmitti en relación con su ciclo vital en la Ensenada de la Broa. Archivo, Centro de Investigaciónes Pesqueras, Cuba, Mayo 1982
Rodriguéz, J. y A. Pérez, 1981 patrones de migración y definición de unidades pesqueras de camarón en el área de Manzanillo. Resúmenes, Primero Congreso Nacional de Ciencias Biológicas, 29–30 de Octubre de 1981, la Habana, 7 p. (mimeo)
Rodríguez, J., M. Morenza y A. Pérez, 1982 Relaciones largo-edad en unidades pesqueras de camarón rosado y blanco en el área de Manzanillo. Resúmenes VI jornada científica del Instituto Oceanología, Academia Ciencia, Cuba, 32 p.
Sissenwine, M.P., 1977 The effect of random fluctuations on a hypotetical fishery. Sel.Pap.ICNAF, (2):137–44
Valdés, E. y A.F. Silva, 1977 Alimentación de los peces de arrecifes artificiales en la plataforma suroccidental de Cuba. Inf.Cient.Téc.Inst.Oceanol.Acad.Ciencias,Cuba, (24):21 p.