![]()
![]()
![]()
In their review of the Thai agricultural sector, Siamwalla, Setboonsarng and Patamasiriwat (nd) explain that starting around 1970 and coinciding with the introduction of second cropping in the Chao Phraya delta, ploughing of paddy lands began to be done by two-wheeled or four-wheeled power tillers. This led to a drawing down of the stock of buffaloes and cattle, resulting in only a very slow growth in value adding from beef cattle and buffaloes. They argue that only recently has the high income elasticity of demand for beef begun to have an impact on domestic beef production.[3]
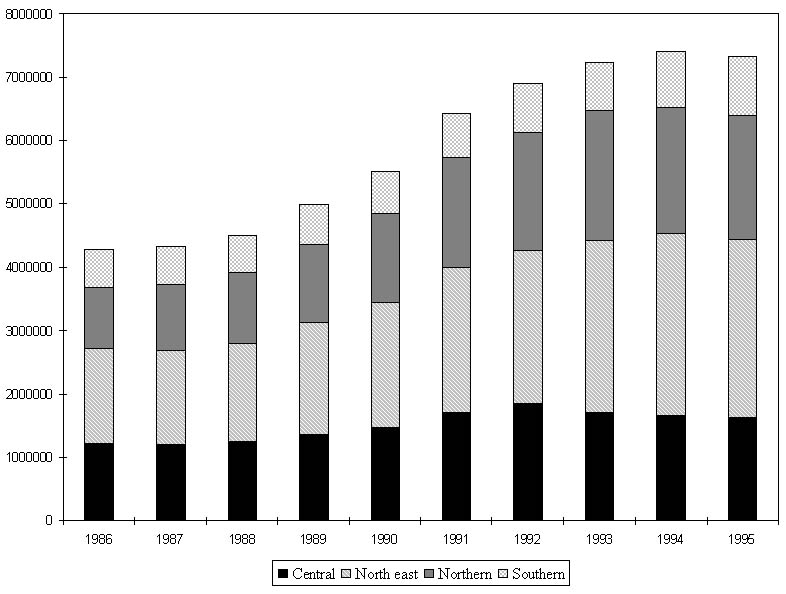
According to the official statistics, Thailand had an estimated 6 778 445 cattle in 1997, or over 2 300 000 more than in 1984. The greatest proportionate increase occurred in the Northern region, where cattle numbers almost doubled between 1984 and 1997 while the slowest growth occurred in the Southern region. About 40 percent of the cattle in 1997 were in the North-Eastern region of the country. The Thai government has been trying to increase the numbers of improved varieties of cattle such as Simbrah and Charbray since the authorities view these as being suitable for Thai conditions. According to the Department of Livestock Development (1996), these two breeds are not yet available to farmers but they are expected to be released to farmers for commercial use in 2008. Beef cattle make up most of the cattle herd. Beef cattle numbers in 1995 were 7 321 821 (Figure 2.1). The main beef region is the North-eastern region where 38 percent of Thailand’s beef cattle were to be found in 1997. The changes in beef cattle numbers across the region were almost the same as for cattle overall. There has been a change in the relative importance of the regions between 1986 ands 1995 with the Northern region becoming more important, while the Central region has declined in relative importance as a beef producing region.
Table 2.1 Numbers of cattle by region
|
Year |
Central |
North east |
North |
Southern |
Total |
|
1984 |
1 211 084 |
1 705 956 |
964 539 |
632 360 |
4 408 026 |
|
1985 |
1 128 222 |
1 621 356 |
950 074 |
614 835 |
4 314 487 |
|
1986 |
1 262 792 |
1 507 441 |
984 425 |
596 803 |
4 351 461 |
|
1987 |
1 248 734 |
1 495 130 |
1 057 398 |
597 837 |
4 399 099 |
|
1988 |
1 306 093 |
1 568 405 |
1 128 636 |
592 533 |
4 595 667 |
|
1989 |
1 466 655 |
1 778 850 |
1 249 874 |
624 338 |
5 119 717 |
|
1990 |
1 597 579 |
1 984 419 |
1 428 038 |
658 494 |
5 668 530 |
|
1991 |
1 855 842 |
2 312 023 |
1 741 763 |
717 343 |
6 626 971 |
|
1992 |
2 014 757 |
2 456 732 |
1 878 499 |
771 491 |
7 121 479 |
|
1993 |
1 878 611 |
2 759 514 |
2 067 026 |
767 422 |
7 472 573 |
|
1994 |
1 823 300 |
2 922 302 |
2 001 500 |
890 248 |
7 637 350 |
|
1995 |
1 812 960 |
2 890 894 |
1 972 643 |
932 571 |
7 609 068 |
|
1996 |
1 508 165 |
2 723 841 |
1 791 442 |
854 759 |
6 878 207 |
|
1997 |
1 478 934 |
2 688 419 |
1 770 144 |
840 948 |
6 778 445 |
|
1997/1984 |
1.22 |
1.58 |
1.84 |
1.32 |
1.53 |
Source: Department of Livestock Development (1995) for data from 1984 to 1993 and Department of Livestock Development (1996) for 1994 and 1995 data. Data for 1996 and 1997 came from www.dld.go.th
Figure 2.1 Beef cattle numbers by region
About 55 percent of the farms in the cattle industry (this includes dairy as well as beef cattle) had a land area of between 10 and 40 rai in 1993. There did not appear to be any difference in the land area of farms between the regions. Only 0.6 percent of the 1 263 431 farms with cattle in 1993 had farm areas of 140 rai or more. The farms with the greatest area of land were more likely to be in the Central region in 1993 (Table 2.2).
Table 2.2 Distribution of cattle farms by area of farm, 1993
|
Farm area |
North east |
Northern |
Central |
Southern |
All Kingdom |
|
(rai) |
(%) |
(%) |
(%) |
(%) |
(%) |
|
Less than 2 rai |
3.11 |
7.90 |
12.00 |
2.91 |
5.20 |
|
2 - 5 |
7.40 |
21.20 |
12.15 |
16.37 |
12.31 |
|
6 - 9 |
9.56 |
14.98 |
8.20 |
15.72 |
11.54 |
|
10 - 19 |
28.63 |
24.41 |
22.28 |
30.24 |
27.27 |
|
20 - 39 |
33.30 |
19.12 |
26.29 |
23.87 |
27.92 |
|
40 - 59 |
11.44 |
6.92 |
10.59 |
6.77 |
9.60 |
|
60 - 139 |
6.10 |
4.72 |
7.18 |
3.69 |
5.54 |
|
140 and over |
0.44 |
0.74 |
1.31 |
0.42 |
0.62 |
|
Total farms |
613 738 |
232 959 |
177 040 |
239 694 |
1 263 431 |
Source: National Statistics Office (1966a, 1966b, 1966c, 1966d)
Almost one third of farms carrying cattle in 1993 had either one or two animals, while a further 51 percent had between three and nine animals. About one percent of farms had more than 50 head, and less than a quarter of one percent of farms had 100 head of cattle or more. As was the case with farm area, the Central region had the highest concentration of farms with 100 or more head of cattle (Table 2.3). The data in Table 2.2 and 2.3 confirm the point made earlier about the cattle industry being largely a small farm industry.
Table 2.3 Distribution of cattle farms by numbers of cattle, 1993
|
Number of cattle |
North east |
Northern |
Central |
Southern |
All Kingdom |
|
(%) |
(%) |
(%) |
(%) |
(%) |
|
|
1 - 2 |
33.80 |
29.90 |
18.78 |
39.51 |
32.06 |
|
3 - 4 |
28.88 |
19.96 |
23.45 |
33.82 |
27.41 |
|
5 - 9 |
25.27 |
22.28 |
27.66 |
21.12 |
24.27 |
|
10 - 19 |
8.74 |
15.43 |
16.59 |
4.35 |
10.24 |
|
20 - 49 |
2.90 |
10.17 |
10.09 |
1.00 |
4.89 |
|
50 - 99 |
0.36 |
1.96 |
2.63 |
0.16 |
0.94 |
|
100 - 499 |
0.05 |
0.31 |
0.79 |
0.05 |
0.20 |
|
500 and over |
<0.01 |
<0.01 |
0.02 |
<0.01 |
<0.01 |
|
Total farms |
613 738 |
232 959 |
177 040 |
239 694 |
1 263 431 |
Source: National Statistics Office (1966a, 1966b, 1966c, 1966d)
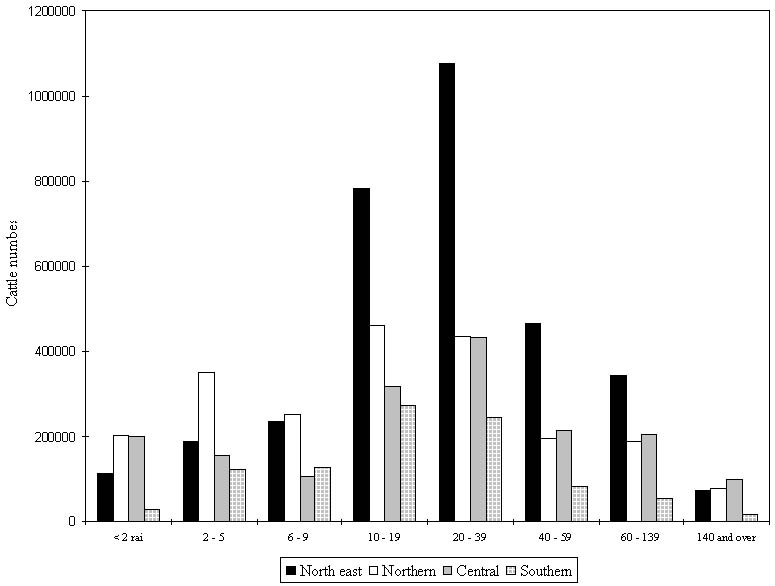
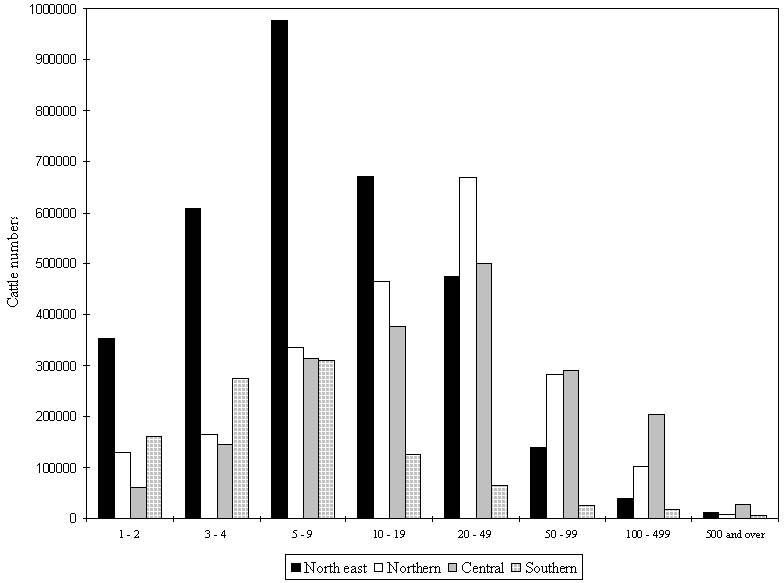
Figure 2.2 and Figure 2.3 show the distribution of the number of beef and work cattle by the area of the farm and the number of cattle on the farm, respectively, for each region. It may be seen from these two figures that most cattle are to be found on farms that are small in terms of farm area and also in terms of herd size. Indeed, for Thailand as a whole, there were 8 336 874 beef cattle in 1993 and 2 186 641 were on farms with between 20 and 49 rai of land. These farms made up about 28 percent of farms with cattle in 1993. The very smallest farms - those with an area of less than 2 rai - carried 541 008 cattle. The limited land area that the majority of farms have available to them means that obtaining feed is likely to be a problem for the operators of these farms, particularly during the dry season.
Figure 2.2 Distribution of beef and work cattle by area of holding and region, 1993
Figure 2.3 Distribution of beef and work cattle by size of herd and region, 1993
A major problem that the beef industry faces is smuggling from Myanmar[4], which Thailand borders on the west. According to the Department of Livestock Development (1996), the number of smuggled cattle is about 400 000 per year. Smuggled cattle are sold in Thailand at prices lower than Thai farmers are willing to accept for locally reared animals. The cattle from Myanmar are said to harbour diseases including foot and mouth disease. This makes it difficult for Thailand to successfully implement control programs for diseases such as foot and mouth disease in ruminants and in pigs. Thai export opportunities for both of these industries are therefore somewhat limited. A second problem that the industry faces is the government regulation of slaughtering facilities. These are under the control of the Ministry of the Interior and this creates difficulties for the Ministry of Agriculture in implementing programs for the cattle industry.
The Department of Livestock Development (1996) has identified a number of other problems that also confront the Thai beef industry. These are as follows:
Efficiency in beef production is low. This is related to a number of factors. First, most breeds used to produce beef in Thailand are low yielding. Second, the lack of attention paid to animals by farmers resulting in low birth weights and high mortality rates, particularly among young animals.
There is little incentive for the development of commercial farms because of scarcity of land and high levels of investment required. The Department of Livestock Development reports it can take up to three years for the investment to be recouped.
There is no “standard price” for beef cattle and markets are not well developed.
The beef produced in Thailand is not up to export standard because of poor beef processing procedures and facilities.
According to the Department of Livestock Development, there are a number of possibilities open to the industry that gives ground for some optimism.
It should be possible to reduce the mortality rate of calves from the level of the late 1990s - about 65 percent - to around 40 percent through the control of parasites in young animals.
The control of smuggling should allow prices to increase.
The investment needed to enter the industry could possibly be reduced through development of two types of farms - breeder farms and farms exclusively for fattening.
There is a potential demand in Malaysia of 30 000 to 40 000 head of cattle per year.
The southern part of Thailand has the right agronomic conditions for beef production. It is also close to potential markets and faces less of a disease problem than other parts of the country.
Introducing modern meat plants would be an incentive for farmers to improve the quality of their production.
Waste from beef farms could be used as an organic fertilizer resulting in less damage to the environment than chemical fertilizers.
2.1 Buffaloes
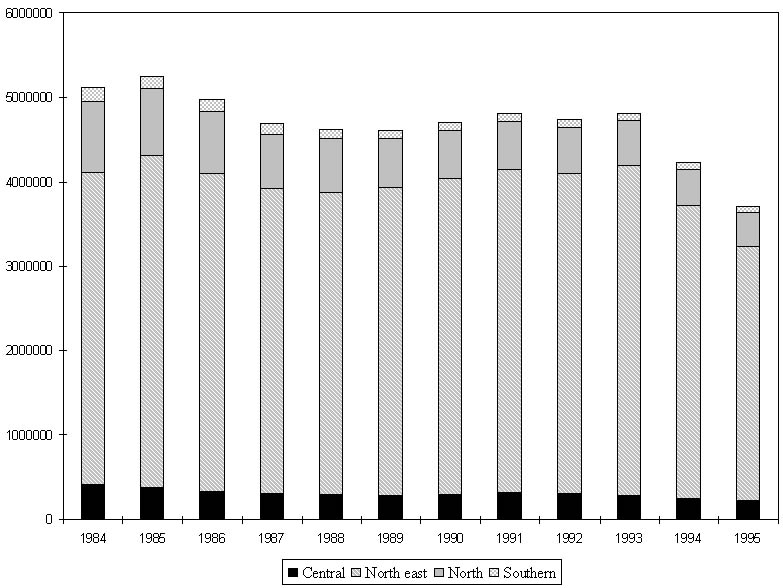
Buffalo numbers in 1995 were 3 710 061, or about 28 percent below their numbers in 1984 (Figure 2.4). Most of the buffalo are to be found in the North-eastern region which, as mentioned earlier, is the poorest region of Thailand. Although there were some farms in each of the regions that had 10 or more buffalo, these tended to be the exception rather than the norm. Most farms had one or two buffalo. This reflects the importance of buffalo as draft animals and their suitability for the Thai environment. The increased mechanisation that has occurred in Thai agriculture has resulted in the replacement of buffalo on many farms by tractors and other mechanical implements. This trend is likely to continue.
For buffalo and beef cattle raised on extensive farms, the following are points made by Noppakun (1998):
Buffalo fertility is poor and calving rates are around 55 percent;
Calving intervals are long, up to 18 to 22 months;
Rearing losses are high and are of the order of 30 percent;
Daily weight gain is low so that calves are not likely to calve until they are 44 to 50 months of age;
The draught performance of the animals is poor and there is no targeted utilization of meat.
A different view about the production performance of buffalo would be that they have developed the characteristics listed above as an adaptation to their environment, and as a way of ensuring their survival in conditions that are difficult with limited inputs.
Figure 2.4 Buffalo numbers by region
2.2 Live cattle and beef trade
Thailand has imported live cattle for use as breeding cattle and for fattening from a number of countries, including Australia, New Zealand, Myanmar and Costa Rica. Not all of the programs involving breeder cattle have been successful, with cattle sometimes failing to get into calf most usually because of poor nutrition. According to industry sources, this has made farmers reluctant to borrow money to purchase the imported cattle. The data in Table 2.4, for example, show that breeder cattle imports declined from over 15 000 in 1993 to under 1 000 in 1996. Most of these breeders have some Brahman blood and they usually come from northern Australia. The large number of imports in 1991 was the result of a Thai government program to increase the domestic cattle population through dispersing imported cattle to farmers. Kaus et al (1997) point out that this particular scheme suffered in its early stages as farmers did not have adequate cattle management skills. The Australian beef industry in conjunction with the Thai Department of Livestock Development set up model farms where Thai farmers obtain technical advice and observe improved management practices. Imports of cattle other than breeders have expanded in the last couple of years. These cattle are mainly cross breed dairy animals (similar to the Australian Fresian Sahiwal) and they have been dispersed to small holders. The future of imports of live cattle is sensitive to exchange rate movements and developments in other export markets for Australian cattle and beef such as Japan, Korea and the United States of America. The currency instability in the latter part of 1997 saw the live trade involving Australia all but disappear. Beef imports into Thailand have been relatively minor and are made mainly for the restaurant or hotel sector.
Table 2.4 Imports of live cattle and beef
|
Year |
Breeder imports |
Other live cattle imports |
Beef imports |
|||
|
No. |
Value (000 Bt) |
No. |
Value (000 Bt) |
Volume (t.) |
Value (000 Bt) |
|
|
1989 |
7 073 |
304 975 |
1 918 |
3 377 |
125.87 |
25 989 |
|
1990 |
11 090 |
367 810 |
1 282 |
3 564 |
110.8 |
25 140 |
|
1991 |
18 426 |
588 556 |
12 197 |
18 780 |
809.59 |
77 663 |
|
1992 |
7 978 |
270 601 |
2 301 |
4 279 |
1 217.99 |
100 443 |
|
1993 |
15 188 |
196 567 |
7 425 |
11 335 |
2 250.64 |
123 431 |
|
1994 |
4 339 |
167 674 |
4 875 |
9 673 |
1 070.01 |
81 148 |
|
1995 |
1 419 |
79 178 |
14 074 |
31 132 |
1 390.54 |
95 263 |
|
1996 |
235 |
20 180 |
20 163 |
38 589 |
1 164.62 |
na |
|
1997 |
2 221 |
na |
17 712 |
678 700 |
1655.33 |
na |
|
1998 |
207 |
na |
79 338 |
5 772 600 |
2021.26 |
na |
|
1999 |
24 935 |
na |
138 342 |
5 258 2400 |
1785.3 |
na |
|
2000 |
na |
na |
66 836 |
na |
na |
na |
Source: Office of Agricultural Economics (pers. comm. 7 May 1997) and www.oae.go.th
Thailand has exported cattle to Malaysia and to Laos over the last decade. Between 1991 and 1995, just over 43 000 cattle were exported, with 868 going to Laos and the others to Malaysia. These cattle have been primarily beef cattle. As noted earlier in this section of the report, the Thai government is making the trade with Malaysia a priority.
|
[3] The following are estimates
of the income elasticity of demand for various food items: cereals 0.06; beef
0.56; pork 0.47; poultry 0.50; cow milk 0.80; and eggs 0.50
(www.courses.psu.edu/intag100_uib/sections/sectionll.pdf) [4] Myanmar, known also as Burma, is larger than Thailand with an area of 676 000 km2, as compared to Thailand's 513 000 km2 . Its population is about 46 million. |
![]()
![]()
![]()