![]()
![]()
![]()
Alternatives and risks
As discussed in some detail in the report of the survey conducted in the North Western Province, the raising of fish in ponds for the subsistence farmer is one activity amongst many. Each of these entail risks and uncertainties.
Given the farmers' low resource levels, and for most crops, limited surpluses for marketing, decisions about resource use generally produce immediate consequences for the household's production as well as for its consumption.
Land
For most farmers the land dedicated to fish ponds is a small part of the overall area available; less than 1% in most cases. The exception is Chibote where it may for some reason reach 10%. However, land is seldom homogeneous; what is used for fish ponds is land most easy to work (free from boulders and rocks) and to irrigate through gravity, or seepage. Thus from an agricultural standpoint, it should have alternative uses. This is confirmed in the survey. The majority (in all categories of respondents) state that the land could very well be used to produce crops for sale or consumption (see Figure 6.1).
Table 6.1: Practising farmers: Expected sources of inputs at the start of fish culture (Percentages)
| Own | Government | Other Fish Farmers | Other Sources | |
|---|---|---|---|---|
| Organic Fertilizer (49%) | 91 | 3 | 0 | 23 |
| Feed (83%) | 95 | 0 | 0 | 24 |
| Fingerlings (86%) | 2 | 54 | 18 | 28 |
| Animals (13%) | 100 | 0 | 0 | 0 |
| Labour: construction (89%) | 94 | 2 | 35 | 41 |
| Labour: Operation (83%) | 97 | 3 | 31 | 2 |
| Labour: harvesting (83%) | 86 | 9 | 33 | 7 |
Source: The survey (P5-37)
Note: The percentage figures in parenthesis - for this table and other tables in this chapter - indicate the rate of response obtained.
Figure 6:1 Alternative use of inputs: agricultural production for sale
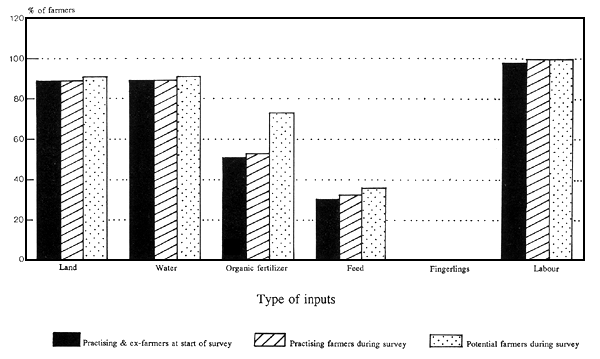
Source: The Survey
Water
Water, like land, is generally obtained through customary rights. Subsistence farmers do not buy land or water (see Figure 6.2). Likewise, respondents in all groups have alternate uses for water through production of crops (see Figure 6.1).
Table 6.2: Practising fish farmers: other possible uses (other than aquaculture) for their inputs
| Sale of inputs (%) | Prod. for consump (%) | Prod. for sale (%) | No other use (%) | |
|---|---|---|---|---|
| Land | 2 | 89 | 89 | 12 |
| Water | 0 | 89 | 89 | 10 |
| Organic fertilizer | 0 | 46 | 51 | 4 |
| Feed | 20 | 32 | 30 | 22 |
| Fingerlings | 28 | 0 | 0 | 47 |
| Labour | 2 | 96 | 98 | 2 |
Source: The survey (P5-38 to P5-41)
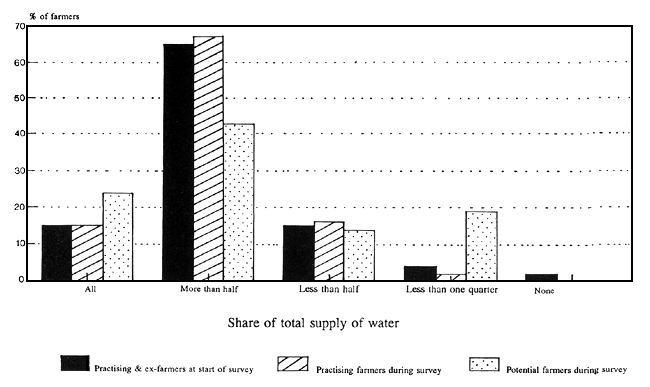
Most farmers expect that more than half of the water the household uses for non-domestic purposes will be destined for the fish pond (see Figure 6.3). Among potential farmers as many as one in five expect all the water to be used in the pond.
Table 6.3: Practising farmers: Expected share of own inputs for fish farming (%)
| All | More than half | Less than half | Less than quarter | None | |
|---|---|---|---|---|---|
| Inputs | |||||
| Land (79%) | 0 | 2 | 9 | 88 | 2 |
| Water (72%) | 15 | 65 | 15 | 4 | 2 |
| Organic fertilizer (51% | 19 | 39 | 17 | 8 | 17 |
| Feed (33%) | 33 | 44 | 13 | 4 | 6 |
| Labour (0%) | 0 | 8 | 23 | 67 | 2 |
Source: The survey (P5-47). Percentage figures in parenthesis indicate rate of response obtained.
Figure 6:2 Importance of purchased inputs
Source: The Survey
Note: Categories are not mutually exclusive
Figure 6:3 Share of farmer's own inputs for fish farm: water
Source: The Surveys
Figure 6:4 Share of farmer's own inputs for fish farm: feed
Source: The Survey
Note: Categories are mutually exclusive
Feed
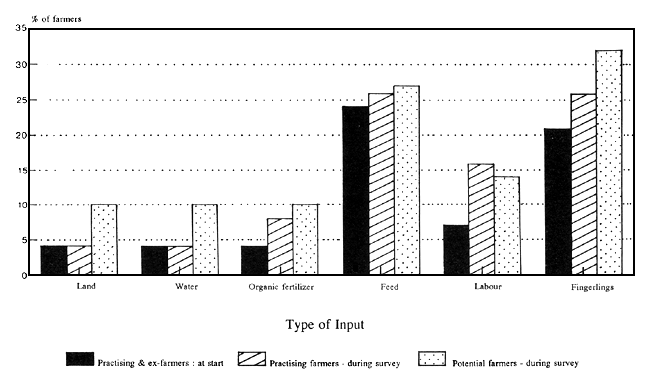
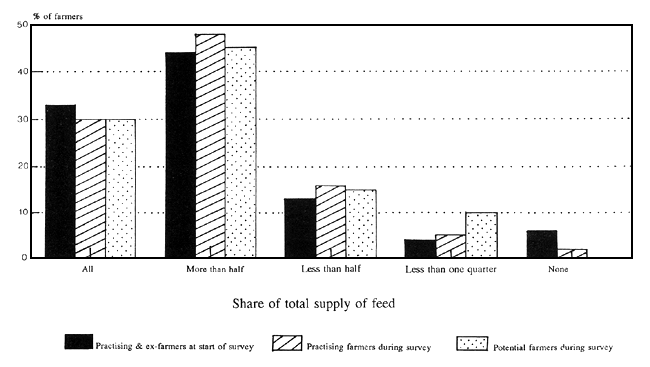
Feed is generally obtained on the farm (Tables 6.1, 6.5, and 6.9). Three of four farmers use more than half of what they have available of maize bran, household leftovers, non-composted vegetative materials (see Figure 6.4). About one in four also purchase feed, or expect to do so (see Figure 6.2). Of those, 75% use more than half of what they purchase for the fish ponds (Tables 6.4, 6.8 and 6.12).
Alternative uses for feed are few. Only about one third of the farmers report that they know of crops/livestock they would have produced on the farm and sold (see Figure 6.1) and for which feed would have been a useful input. About the same number see crops produced for consumption as an alternative. Less than one in five believe it would be possible to sell the feed outright (Tables 6.2, 6.6 and 6.10).
Table 6.4: Practising farmers: Expected share of purchased inputs for fish farming (%)
| All | More than half | Less than half | Less than quarter | None | |
|---|---|---|---|---|---|
| Inputs | |||||
| Land (4%) | 0 | 0 | 0 | 100 | 0 |
| Water (4%) | 0 | 100 | 0 | 0 | 0 |
| Organic fertilizer (4%) | 0 | 100 | 0 | 0 | 0 |
| Feed (24%) | 65 | 18 | 12 | 6 | 0 |
| Labour (7%) | 20 | 20 | 0 | 60 | 0 |
Source: The survey (P5-47). Percentage figures in parenthesis indicate rate of response obtained.
Organic Fertilizers
The use of fertilizers is less well spread than the use of feed. Those subsistence farmers who do, normally use part of what (manure, compost) is available on the farm (see Fig. 6.2). Alternative uses exist on the farm, but there does not seem to be any sale of organic fertilizers from farmer to farmer (Tables 6.2, 6.6 and 6.10).
More than half the farmers use more than half of the available quantities of organic fertilizers for their fish ponds (Tables 6.3, 6.7 and 6.11).
Fingerlings
Fingerlings are an “intermediate” input as they can be produced with the help of the other inputs. Most farmers obtain fingerlings from outside the farm (see Figure 6.5). It is different from the other inputs in the sense that fingerlings have no alternate use on the farm. About one in four of the respondents say that it can be sold, presumably for restocking, not to be eaten.
Table 6.5: Practising farmers: How they acquired their inputs
| Own | Government | Other Fish Farmers | Other Sources | |
|---|---|---|---|---|
| Organic fertilizer (58%) | 90 | 3 | 0 | 17 |
| Feed (88%) | 95 | 0 | 0 | 11 |
| Fingerlings (92%) | 15 | 46 | 20 | 30 |
| Animals (13%) | 100 | 0 | 0 | 0 |
| Labour (94%) | 100 | 0 | 15 | 4 |
Source: The survey (P4-15). Percentage figures in parenthesis indicate rate of response obtained.
Labour
The farmer's time and effort is the ultimate input. He and other household members seem able to spend time growing fish, growing crops, or raising livestock, for consumption or sale (see Figure 6.1). All of them will naturally involve themselves and other household members in the activity; other fish farmers also help, mainly during harvest but also at times during pond construction (see Figure 6.6).
Figure 6:5 Source of inputs: fingerlings

Source: The Survey
Note: Categories are not mutually exclusive
Figure 6:6 Source of inputs: labour
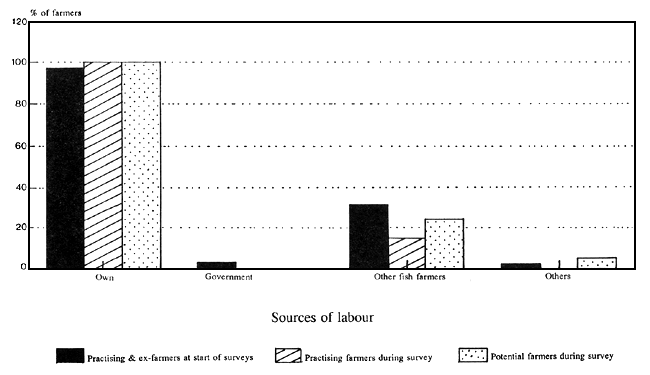
Source: The Survey
Note: categories are not mutually exclusive
labour = for operations
Table 6.6: Practising fish farmers: Other reporteu uses for their inputs (%)
| PERCENTAGE OF FARMERS | ||||
|---|---|---|---|---|
| Sale of inputs (96%) | Production for consumption (98%) | Production for sale (94%) | No other use (94%) | |
| Land | 2 | 90 | 89 | 11 |
| Water | 0 | 88 | 89 | 11 |
| Organic fertilizer | 0 | 51 | 53 | 4 |
| Feed | 15 | 33 | 32 | 30 |
| Fingerlings | 27 | 0 | 0 | 47 |
| Labour | 0 | 100 | 100 | 0 |
| None | 58 | 0 | 0 | 34 |
Source: The survey (P4-22 to P4-25). Percentage figures in parenthesis indicate rate of response obtained.
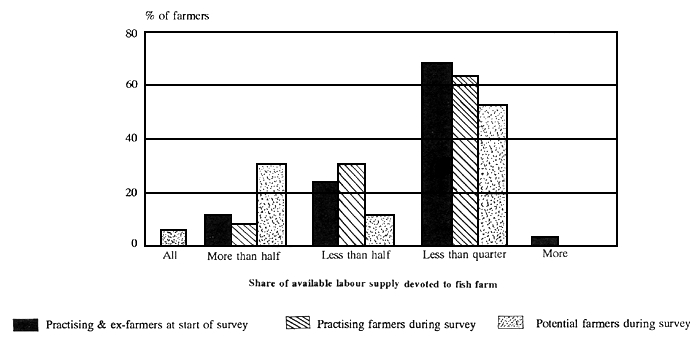
For most households, the effort devoted to fish ponds is less than a quarter of the total available (see Figure 6.7). It is noticeable that potential farmers, considered as a group, expect their effort to be proportionally greater than that of practising farmers. Those who hire labour generally employ them only for a small part of the time on fish ponds (once construction is completed).
Table 6.7: Practising fish farmers: Reported share of their inputs used up in fish farming
| All | More than half | Less than half | Less than quarter | None | |
|---|---|---|---|---|---|
| Inputs | |||||
| Land | 0 | 6 | 8 | 86 | 0 |
| Water | 15 | 67 | 16 | 2 | 0 |
| Organic fertilizer | 28 | 31 | 24 | 7 | 10 |
| Feed | 30 | 48 | 16 | 5 | 2 |
| Labour | 0 | 7 | 33 | 61 |
Source: The survey (P4-29)
Figure 6:7 Share of farmer's own inputs for fish farm: labour
Cash
In the survey there is only one question concerning cash. No statements can be made about the purchasing inputs for the fish culture activity. However, as fingerlings are purchased infrequently, as only a minority of farmers hire labour, and as relatively little hired time is spent on fish culture activities, cash expenditures on fish farming are minor. However, potential farmers apparently intend to spend more cash (Fig. 6.2) and more time (Fig. 6.7) than those who are actually raising fish in ponds. The potential farmers expect that they are about to engage in a commercial activity.
Conclusions
The technology and its place in subsistence fish farming are described above. The following aspects stand out: stability, self-sufficiency, and integration in the agricultural farming system.
The survey provides data for a comparison of changes over time of resource use and resource origin. Practising and past farmers have described it first as they expected it at the time they started and, second, as they now practise it. The figures are remarkably close to identical. Barring lapses of memory, any significant changes would have been reported.
The respondents rely fully on inputs available on the farm, with one exception -- that of fingerlings. Those who buy inputs generally use them also in other on-farm activities.
Potential farmers are also, as a group, remarkably similar to practising fish farmers. Despite the isolation of some of them, they are well acquainted with the common method of raising fish in ponds. This of course does not mean that it is an optimum method.
The resource use shows that inputs with rather scanty alternate uses are also those with the highest use in the fish pond. The share is low for inputs with good alternate uses (see Fig. 6.8). This is a sign of an activity well integrated with other productive activities, of the farmer.
Water seems to be an exception to the above rule. Despite its rather high average use (close to 75%), almost 90% of farmers report alternatives. The authors believe that this comes about because those who have access to river water (the majority) in fact have access to an almost unlimited quantity.
Figure 6:8 Inputs with alternative uses versus share of inputs used for fish culture
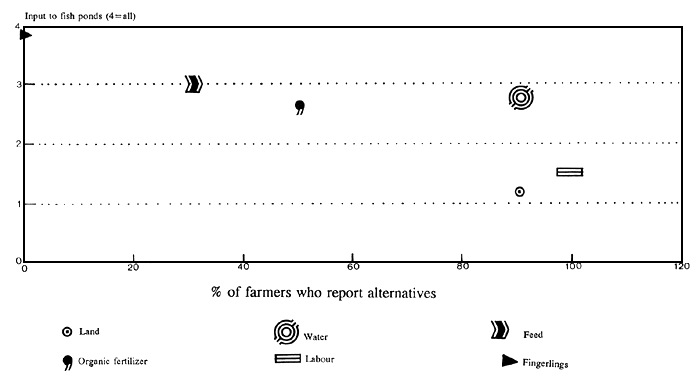
Source: The Survey
Table 6.8: Practising fish farmers: Reported share of various purchased inputs in fish farming (%)
| All | More than half | Less than half | Less than a quarter | None | |
|---|---|---|---|---|---|
| Inputs | |||||
| Land | 0 | 0 | 0 | 50 | 50 |
| Water | 0 | 100 | 0 | 0 | 0 |
| Organic fertilizer | 0 | 100 | 0 | 0 | 0 |
| Feed | 62 | 31 | 8 | 0 | 0 |
| Labour | 0 | 25 | 0 | 50 | 25 |
Source: The survey (P4-30)
Table 6.9: Potential fish farmers: expected sources of inputs (%)
| Own | Government | Other Fish Farmers | Other Sources | |
|---|---|---|---|---|
| Organic fertilizer (86%) | 94 | 0 | 0 | 18 |
| Feed (100%) | 95 | 0 | 0 | 19 |
| Fingerlings (100%) | 100 | 52 | 43 | 5 |
| Animals (27%) | 100 | 0 | 0 | 0 |
| Labour: construction (100%) | 100 | 0 | 32 | 23 |
| Labour: operations (100%) | 100 | 0 | 24 | 5 |
| Labour: harvest (100%) | 86 | 18 | 14 | 0 |
Source: The survey (P7-53)
Note: The percentage figures in parenthesis indicate the rate of response obtained.
Table 6.10: Potential fish farmers: Reported alternative uses of inputs (%)
| Sale of inputs (100%) | Production for consumption (100%) | Production for sale (100%) | No other use (100%) | |
|---|---|---|---|---|
| Land | 0 | 91 | 89 | 9 |
| Water | 0 | 91 | 91 | 5 |
| Organic fertilizer | 5 | 73 | 73 | 5 |
| Feed | 10 | 36 | 36 | 18 |
| Fingerlings | 10 | 0 | 0 | 0 |
| Labour | 0 | 100 | 100 | 0 |
| None | 77 | 0 | 0 |
Source: The survey (P5-54 to P7-57)
Note: The percentage figures in parenthesis indicate the rate of response obtained.
Table 6.11: Potential fish farmers: Reported share of various inputs in fish farming (%)
| All | More half | Less half | Less quart | None | |
|---|---|---|---|---|---|
| Inputs | |||||
| Land (95%) | 5 | 10 | 14 | 71 | 0 |
| Water (95%) | 24 | 43 | 14 | 19 | 0 |
| Organic fertilizer (67%) | 20 | 27 | 47 | 7 | 0 |
| Feed (90%) | 30 | 45 | 15 | 10 | 0 |
| Labour (95%) | 5 | 33 | 10 | 52 | 0 |
Source: The survey (P7-6)
Note: The percentage figures in parenthesis indicates the rate of response obtained.
Table 6.12: Potential fish farmers: expected share of various purchased inputs in fish farming (%)
| All | More half | Less half | Less quart | None | |
|---|---|---|---|---|---|
| Inputs | |||||
| Land (10%) | 0 | 0 | 0 | 100 | 0 |
| Water (10%) | 0 | 50 | 0 | 50 | 0 |
| Organic fertilizer (10%) | 50 | 0 | 50 | 0 | 0 |
| Feed (27%) | 67 | 17 | 17 | 0 | 0 |
| Labour (14%) | 0 | 0 | 0 | 67 | 33 |
Source: The survey (P7-64)
Note: The percentage figures in parenthesis indicates the rate of response obtained.
![]()
![]()
![]()