The multimesh gillnets caught a total 25 different species of 6 different families (Table 1). In the reservoirs in Botswana and in two reservoirs in Zambia the species of the Oreochromis genus could not be identified. This was due to hybridization of Oreochromis mossambicus and Oreochromis andersonii. These fish were grouped under Oreochromis spp. The most widespread species were Clarias gariepinus and Barbus paludinosus. C. gariepinus was caught in 22 of the 34 reservoirs sampled, and was found in all countries. B. paludinosus was caught in 23 reservoirs, and was not present in Lesotho. Most of the species caught are indigenous to the region, except for Lepomis macrochirus, Micropterus salmoides, and Cyprinus carpio. These exotic species were only found in Lesotho.
Gillnets are efficient fishing gear but they are selective. Since they are passive gear the fish have to encounter the net, enter the net, and get retained by it. More active fish species are more likely to encounter the net. The chance for a fish to enter the net depends also on the species. Certain species, like Tilapia rendalli and M. salmoides were not caught in large numbers by gillnets, most likely because they were aware of the nets and did not enter them. Once the fish enters the net it depends on its size, body shape and the mesh size of the net whether it will be retained or not.
Table 2: Percentage of nets not catching a species while present if the reservoir.
| Country: | Botswana | Lesotho | Zambia | Malawi | Zimbabwe | Total | |||||
| Species | Effort no. net nights | % no catch | Effort no. net nights | % no catch | Effort no. net nights | % no catch | Effort no. net nights | % no catch | Effort no. net nights | % no catch | % no catch |
| L. molibdinus | 104 | 88 | 88 | ||||||||
| C. gariepinus | 120 | 43 | 20 | 65 | 74 | 64 | 90 | 88 | 41 | 59 | 62 |
| T. rendalli | 67 | 61 | 98 | 59 | 28 | 54 | 59 | ||||
| L. macrochirus | 17 | 53 | 53 | ||||||||
| B. eutaenis | 62 | 45 | 45 | ||||||||
| B. unitaeniatus | 15 | 40 | 40 | ||||||||
| S. intermedius | 16 | 38 | 38 | ||||||||
| S. robustus | 8 | 0 | 7 | 71 | 33 | ||||||
| L. capensis | 12 | 33 | 33 | ||||||||
| O. macrochir | 39 | 23 | 7 | 86 | 33 | ||||||
| L. cylindricus | 97 | 26 | 37 | 32 | 28 | ||||||
| O. andersonni | 42 | 24 | 24 | ||||||||
| Oreochromis spp. | 128 | 14 | 42 | 51 | 4 | 0 | 23 | ||||
| C. carpio | 28 | 21 | 21 | ||||||||
| M. salmoides | 5 | 20 | 20 | ||||||||
| B. trimaculatus | 120 | 18 | 10 | 10 | 19 | 26 | 18 | ||||
| P. philander | 51 | 20 | 10 | 10 | 18 | ||||||
| B. marequensis | 50 | 12 | 21 | 24 | 16 | ||||||
| O. mossambicus | 10 | 0 | 41 | 17 | 14 | ||||||
| L. altivelis | 4 | 25 | 7 | 0 | 9 | ||||||
| M. macrolepidotus | 15 | 7 | 7 | ||||||||
| B. paludinosus | 104 | 23 | 98 | 4 | 320 | 2 | 33 | 0 | 6 | ||
| O. shiranus | 320 | 1 | 1 | ||||||||
| L. umbratus | 17 | 0 | 0 | ||||||||
The number of nets required to catch a certain fish species depends on the abundance of that species and the efficiency of the gear to catch it. Since the Drottningholm gillnets were the only gear used to sample the reservoirs it was not possible to determine whether these nets caught all species present. A maximum of 8 nets were used at any sampling occasion, and it was therefore possible that some uncommon species were not identified although they were catchable with the nets. Table 2 gives the effort in net nights per species used in dams where those species were caught in at least one net. It also gives the percentage of the nets used in those dams that did not catch that particular species. The species Labeo molybdinus was only caught in 12% of the nets used in reservoirs where this species was present. Since this species was not very common this was probably caused by a low abundance of this species. Low abundance also caused infrequent catches of Barbus eutaenia, L. macrochirus, and several other uncommon species. However, the infrequent catches of T. rendalli and C. gariepinus likely resulted from the low catchability of these species. The rare catches of B. paludinosus, a small cyprinid, in Botswana was caused by the fact that in this country only mesh sizes above 8 mm. were used.
As mentioned, Table 2 only shows the catchability of species that were actually caught. Species with very low catchability, like eels, or with low abundance, may have been present in reservoirs but remained undetected.
Fjalling and Furst (1991) recommended to pool the catches of all species to a lake average in order to compare different waters. Table 3 gives the pooled CPUE data per dam. The pooled CPUE gives one figure per lake or reservoir. This is useful when comparing different water bodies or when the whole fish population has been treated similarly, for instance during monitoring of the effect of water treatment on the fish population.
The CPUE ranged from 113 to 8125 g./net/night. No relation could be established between dam size and CPUE nor between number of fish species and CPUE. The CPUE in the reservoirs in Zambia was lower than in the other countries (p<0.05), the CPUE between the other countries did not differ significantly.
Management interventions often concentrate on one or a few species only, and this requires data on the status of these specific species.
The pooled CPUE is the sum of the catches of several species, and is most likely dominated by only a few. Table 4 gives the contribution to the pooled CPUE by the different species. The contribution was expressed in percentage of the pooled CPUE and was calculated as the average of those reservoirs where the species was actually caught.
Labeo umbratus and Labeo altivelis were dominating the catches when present. They were however not commonly found. L. umbratus was only found in two reservoirs in
Table 3: Reservoirs sampled with the Drottningholm method, size, number of species found and average pooled CPUE.
| Dam name | Size (ha) | Number of species. | Total CPUE (g) | |
| Botswana | Gakgatla | 3 | 4 | 3095 |
| Botswana | Gampudi | 14 | 2 | 5090 |
| Botswana | Lethakane | 9 | 3 | 1292 |
| Botswana | Mmakgodumo | 20 | 1 | 8125 |
| Botswana | Moshupa | 28 | 6 | 2790 |
| Botswana | Semarula | 37 | 4 | 3054 |
| Botswana | Thaone | 4 | 3 | 4474 |
| Lesotho | Koalabata | 0.5 | 1 | 5285 |
| Lesotho | Maqalika | 64 | 6 | 6365 |
| Lesotho | Sebaboleng | 18 | 3 | 5259 |
| Lesotho | Thaba Phatsoa | 25 | 2 | 9655 |
| Lesotho | Thamae | 0.2 | 2 | 2191 |
| Zambia | Chadewa | 13 | 1 | 474 |
| Zambia | Chamuchenga | 7 | 6 | 697 |
| Zambia | Chivungula | 2.3 | 5 | 1138 |
| Zambia | Kangombe | 6 | 3 | 1924 |
| Zambia | Lusowe | 22 | 5 | 606 |
| Zambia | Lutembwe | 100 | 7 | 3194 |
| Zambia | Lutembwe II | 32 | 7 | 301 |
| Zambia | Makungwa | 10 | 6 | 1911 |
| Zambia | Nsazu | 25 | 4 | 113 |
| Zambia | Rukuzye | 15 | 5 | 479 |
| Zambia | Senegalia | 10 | 5 | 4453 |
| Zimbabwe | Chimhandu | 90 | 3 | 5740 |
| Zimbabwe | Cindunduma | 50 | 6 | 579 |
| Zimbabwe | Mufurudzi | 200 | 6 | 3537 |
| Zimbabwe | Mwenje | 480 | 8 | 2338 |
| Zimbabwe | Sebakwe | 400 | 15 | 3583 |
| Zimbabwe | Taru | 6 | 4 | 9831 |
| Malawi | Chizombezi | 3 | 4 | 1171 |
| Malawi | Mbvoniha | 3 | 3 | 1723 |
| Malawi | Chipale | 3 | 8 | 7766 |
| Malawi | Bvumbwe | 3 | 3 | 7986 |
Lesotho and L. altivelis once in Zambia and once in Zimbabwe. C. carpio and Barbus aeneus were also important in the catches in Lesotho but were not found elsewhere. For the more common species it can be said that the Oreochromis species (Oreochromis shiranus, O. mossambicus, and O. andersonii) and B. paludinosus were common and had a great influence on the total catch. C. gariepinus, T, rendalli and L. cylindricus were commonly found in the reservoirs but only represented a small proportion of the total CPUE.
The CPUE for a reservoir was one single figure, but since it was the average of the catches of a number of nets it was possible to calculate the precision of this figure. The precision can be defined as the closeness of repeated measurements of the same quantity (Sokal and Rohlf, 1981). The confidence interval around an average indicates the precision of that average. The precision of the CPUE can also be indicated by the number of nets that would be needed to reach a certain precision. Table 5 gives the CPUE, the confidence intervals and the number of nets required to reach a certain precision for the pooled catches and for the catches per species.
Table 4: Contribution to the pooled CPUE in percentage of weight of individual species, when present.
| Number of dams with species present | Percentage of pooled CPUE | Average total number of species present | |||
| Species | |||||
| Mean | Minimum | Maximum | |||
| L. umbratus | 2 | 79 | 59 | 98 | 5 |
| L. altivelis | 2 | 67 | 57 | 77 | 9 |
| O. shiranus | 4 | 60 | 60 | 98 | 4 |
| Oreochromis spp. | 8 | 59 | 1 | 100 | 4 |
| C. carpio | 4 | 53 | 1 | 100 | 3 |
| B. aeneus | 2 | 50 | 1 | 100 | 4 |
| B. paludinosus | 23 | 45 | 0.3 | 100 | 5 |
| O. mossambicus | 6 | 41 | 2 | 99 | 7 |
| L. capensis | 1 | 27 | 27 | 27 | 6 |
| B. marequensis | 6 | 24 | 0.2 | 66 | 8 |
| O. andersonii | 8 | 24 | 0.4 | 65 | 6 |
| B. trimaculatus | 9 | 20 | 1 | 95 | 6 |
| H. philander | 4 | 14 | 0.0 | 30 | 7 |
| M. macrolepidotus | 2 | 10 | 2 | 17 | 11 |
| L. cylindricus | 16 | 7 | 0.2 | 48 | 6 |
| O. macrochir | 7 | 6 | 0.2 | 27 | 7 |
| B. eutaenia | 6 | 3 | 0.2 | 8 | 7 |
| B. unitaeniatus | 2 | 3 | 0.2 | 10 | 9 |
| L. molybdinus | 3 | 3 | 0.1 | 8 | 5 |
| C. gariepinus | 22 | 3 | 0.1 | 11 | 5 |
| S. mystus | 2 | 1 | 0.0 | 2 | 4 |
| S. robustus | 2 | 1 | 0.2 | 2 | 10 |
| T. rendalli | 13 | 1 | 0.2 | 7 | 7 |
| L. macrochirus | 2 | 0.4 | 0.2 | 0.7 | 5 |
| M. salmoides | 1 | 0.2 | 0.2 | 0.2 | 2 |
In order to reach a precision of the pooled CPUE with a C.V.M. of 0.05, i.e. a standard error of 5% of the mean, a reservoir had to be sampled with 9 nets on average. 2 nets were needed to estimate the pooled CPUE with a C.V.M. of 0.1.
The number of nets needed to sample the individual species with a certain precision was much higher than necessary for a precise sample of the pooled CPUE. The average figures indicate that only two species could be sampled with some precision with 10 nets or less. However, these figures are biased. For instance, the average number of nets required to sample B. paludinosus in Botswana was 3764, but this figure was the average of 2.6, 20.3, 18788, 1.4 and 5.2. One extremely imprecise sampling influenced the average to a large extent. Table 6 gives a better picture of the precision with which the individual species were sample, it gives the percentage of the cases where 10 nets or less would have been sufficient to sample the species precise enough to attain a C.V.M. of 0.05.
Table 5: Average CPUE, 95% confidence intervals, and number of nets required for CVM of 0.05 and 0.10 for the pooled catches and the catches per species.
| Species | Count | Mean CPUE | Confidence interval | # Nets CVM 0.05 | # Nets CVM 0.10 |
| POOLED | 31 | 3581 | 2324 – 6653 | 9 | 2 |
| L. umbratus | 2 | 3841 | 2222 – 6938 | 2 | 1 |
| O. shiranus | 2 | 500 | 315 – 891 | 10 | 2 |
| O. mossambicus | 6 | 1301 | 760 – 2542 | 75 | 19 |
| B. paludinosus | 20 | 615 | 375 – 1230 | 99 | 25 |
| L. altivelis | 2 | 633 | 462 – 3770 | 102 | 26 |
| B. trimaculatus | 9 | 206 | 106 – 711 | 131 | 33 |
| C. carpio | 4 | 1893 | 891 – 4479 | 148 | 37 |
| Oreochromis spp. | 10 | 3942 | 2666 – 7051 | 225 | 56 |
| B. marequensis | 5 | 693 | 386 – 1521 | 350 | 87 |
| O. andersonii | 5 | 137 | 46 – 1180 | 424 | 106 |
| L. cylindricus | 13 | 70 | 33 – 292 | 479 | 120 |
| C. gariepinus | 18 | 49 | 3 – 6079 | 1012 | 253 |
| O. macrochir | 6 | 86 | 48 – 163 | 1026 | 256 |
| T. rendalli | 11 | 18 | 2 – 225 | 1226 | 306 |
In more than half of the reservoirs it was possible to obtain a precise sample of the CPUE of Labeo umbratus, Oreochromis shiranus, C. carpio and B. paludinosus when using 10 nets or less. For all the other species more nets were needed and for many species more than 100 nets were required. Even the common species O. mossambicus, Labeo cylindricus, C. gariepinus and T. rendalli could not be sampled satisfactory with the Drottningholm method.
The reservoirs sampled varied in size from 0.2 to 400 hectares. No relation could be established between the size of the reservoirs and the number of nets required to reach a certain precision of CPUE.
The method did give a precise estimation of the pooled CPUE in most of the reservoirs sampled. However, a high level of precision does not guarantee accuracy. Accuracy can be defined as the closeness of a measured or computed value to its true value. The sampling method aimed to give an indication of abundance. Since the catchability was not known in absolute terms, the CPUE was a relative measure, and its accuracy could therefore not directly be measured. To be appropriate and useful as a measure of abundance it is necessary that the catchability is known, does not fluctuate much, or is at least during a certain period of the year fairly constant. If such a period can be identified, sampling should be carried out during that time of the year, and CPUE figures can be used to describe fluctuations in abundance between different years.
Table 6: Percentage of dams where 10 nets were sufficient to sample the various species with a certain precision.
| Species | Count | Percentage of samples where 10 nets were sufficient to attain CVM=0.05 |
| L. umbratus | 2 | 100 |
| O. shiranus | 2 | 80 |
| O. mossambicus | 6 | 43 |
| B. paludinosus | 20 | 58 |
| L. altivelis | 2 | 50 |
| B. trimaculatus | 9 | 50 |
| C. carpio | 4 | 60 |
| Oreochromis spp. | 10 | 50 |
| B. marequensis | 5 | 17 |
| O. andersonii | 5 | 25 |
| L. cylindricus | 13 | 6 |
| C. gariepinus | 18 | 0 |
| O. macrochir | 6 | 12 |
| T. rendalli | 11 | 0 |
Four reservoirs had been sampled several times over a period of at least one year. These reservoirs were Semarula in Botswana, Lutembwe in Zambia, and Mbvoniha and Chizombezi in Malawi. The average of the pooled CPUE including the 95% confidence intervals for these reservoirs are given in Figure 1.
In Zambia and Botswana the reservoirs were sampled at certain intervals. These reservoirs were only sampled once at every sampling date. This gave information about the seasonal fluctuations in the catches. The catches in Lutembwe dam gradually lowered towards the cold season, but due to the limited number of samples and the gap in sampling between July and November 1990, no clear pattern could be detected. The 95% confidence intervals of all the catches overlapped, which meant that no significant difference between the catches could be detected. In Botswana the catches of 1990 were significantly higher at the end of the dry season than after the start of the rains. The first four sampling occasions in 1991 showed fairly constant catches, and lower catches than during the rest of the year. However, due to the variation in catches per net these differences were not significant.
In Malawi the two reservoirs were not only sampled over an extended period of time, but these reservoirs were also sampled during two consecutive days. Sampling during consecutive days were treated as duplications of sampling. This did not only show the seasonal pattern, but also gave an indication on the accuracy of the data. At Chizombezi dam the catches reduced gradually between May 1993 and February 1994, whereas in Mbvoniha dam no change in catches could be detected. During the 8 duplicated sampling in Chizombezi dam, it occurred 5 times that the CPUE of a sample did not fall within the 95% confidence interval of its duplicate. On two occasions there was not even overlap of the two confidence intervals. At Mbvoniha dam 8 duplicated samples were taken and one in quadruple (four samples within 12 days). Six times the average of one sample did not fall within the confidence interval of the other sample and on 5 occasions there was no overlap of the intervals. There was no sign that the second sample was consistently lower than the first sample, which could indicate reduction in biomass as a result of the sampling itself or reduced catchability as a result of fishing activities on the dam.
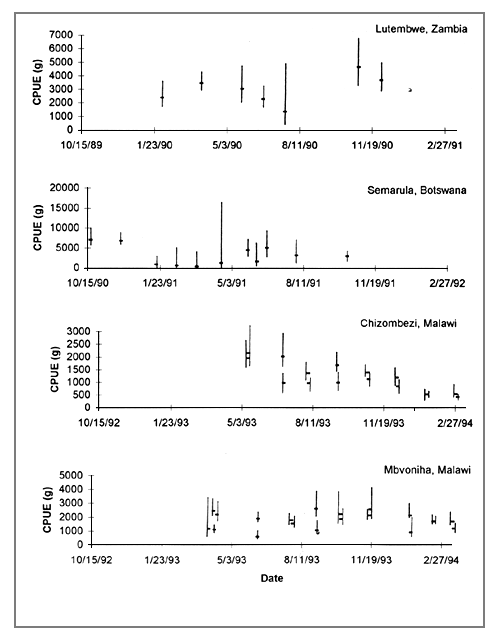
Figure 1: Average pooled CPUE and 95% confidence intervals for reservoirs sampled at several occasions.
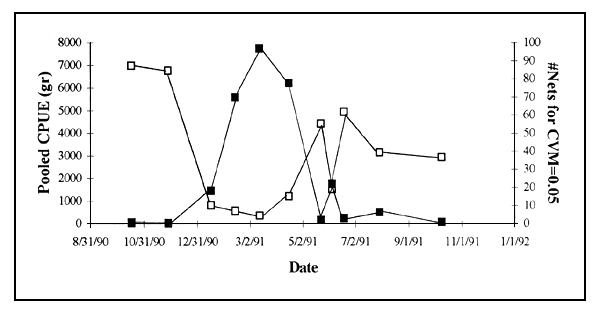
Figure 2: CPUE and number of nets needed for C.V.M. of 0.05 in Semarula dam
Figure 2 shows the pooled CPUE at Semarula dam over time and the number of nets required to attain a C.V.M. of 0.05. In September and November the catches were high and few nets were needed for the required precision. The catches decreased rapidly and the number of required nets increased. After May the catches increased again and the number of nets deceased. The explanation for this pattern is that at the end of the dry season, September and November, the fish were concentrated in a small area resulting in high catches. The high precision of the sampling was caused by the fact that the fish were uniformly distributed in the reservoir as a result of little habitat variation. The inflow of water after December increased the surface area and the variation in habitats, which made precise sampling more difficult. The decrease of the pH and transparency as reported by Nermark and Mmopelwa (1994) and indicating water inflow, followed the same pattern.
Barbus Paludinosus.
B. paludinosus is a widely spread species in the Southern African region. The species was sampled with high precision in almost all the reservoirs. In Semarula dam only nets with mesh sizes above 8 mm. were used B. paludinosus, being a small species, was therefore not effectively sampled in this dam. In Semarula dam the highest catches occurred at the beginning of the sampling between October and November 1991, the catches were very low between January and May 1991, increased slightly thereafter but remained low between June 1991 until the end of the sampling in October 1991. No clear pattern could be detected.
The repeated sampling at Lutembwe dam was discussed by Mattson and Mutale (1992). They concluded that B. paludinosus was adequately sampled in this reservoir, but that no period of the year could be identified where sampling gave consistent results.
In Chizombezi dam the species was always sampled with enough nets to attain high precision. The averages of five of the 8 duplicated samples in Chizombezi dam did not fall within the 95% confidence intervals of their duplicate. On two occasions there was hardly an overlap between the confidence intervals of the duplicates. No seasonal pattern could be detected in the catches. At Mbvoniha dam similar results were obtained. The species was sampled with high precision during every single sampling occasion. Two averages were outside the intervals of their duplicates. The catches showed an increase at the beginning of the rainy season, but this pattern was not significant.
Oreochromis
Different species of the oreochromis genus were found in the various countries. O. mossambicus, O. andersonii, and O. shiranus are from a fisheries point of view comparable species and were grouped in this discussion.
Sampling was carried out with 8 nets. In Semarula dam the catches were high in October an November, low between January and May, and increased after May. The confidence intervals of the CPUE's overlapped all except for the low catches in January and February. No clear seasonal pattern could be detected.
The Oreochromis sp. needed to be sampled with 250 nets to attain a good precision in Lutembwe dam, while they were sampled with only 8 nets. No period could be identified for accurate sampling of the species (Mattson and Mutale, 1991).
In Chizombezi dam O. shiranus was adequately sampled. The catches showed a gradually decrease between May 1993 and March 1994. 6 out of 8 times the average of one sample did not fall within the confidence interval of its duplicate, and on two occasions there was no overlap at all of the intervals of the duplicates.
Sampling of O. shiranus was done with high precision in Mbvoniha dam. The duplicates showed a higher accuracy than in Chizombezi dam, but still 3 averages were outside the intervals of their duplicates.
The CPUE depends on the size of the fish stock and on the catchability of the fish. This catchability varies between species, but sampling gear often also shows a selection for size within one species. In those cases where the gear is size selective the relation between stock and CPUE will become dependant on the size structure of the population.
The size selectivity of a gear may be defined by a curve giving for each size of fish the proportion of the total population of that size which is caught and retained by a unit operation of the gear (Lagler, 1968). The absolute selectivity gives the actual probability of capture per unit of effort.
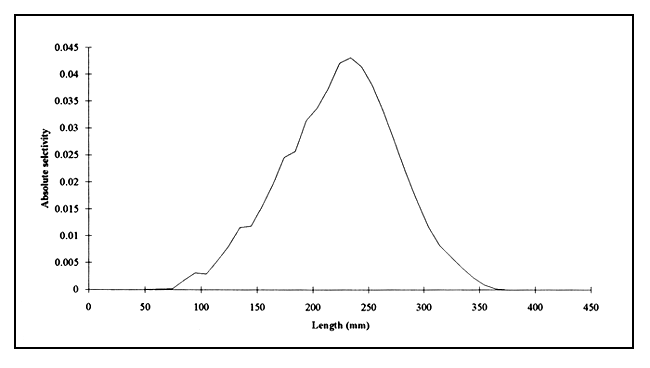
Figure 3: Selectivity curve of the combined mesh sizes 16.5–43 mm. for O. shiranus (after Mattson, 1994).
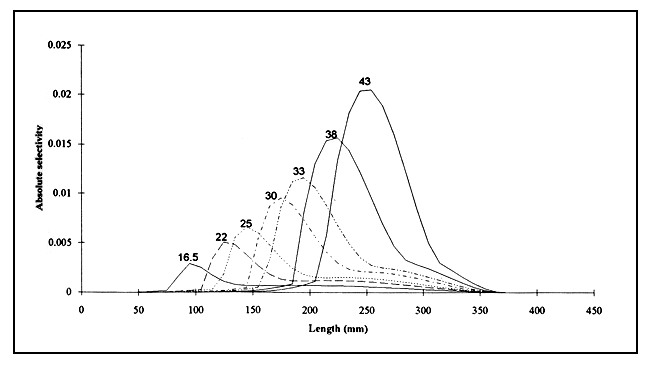
Figure 4: Estimated selectivity curves for mesh sizes 165 to 43 mm (bar height) for O. shiranus. (after Mattson, 1994)
The absolute selectivity of the gear for O. shiranus was determined in Mbvoniha dam, using tagged fish. Only the mesh sizes 16.5 to 43 mm caught enough fish for unbiased analysis. The combined selectivity curve for these mesh sizes is given in Figure 3.
The curve in Figure 3 is the result of a combination of the selectivity curves of the individual mesh sizes, as shown in Figure 4. The efficiency of the nets increased with its mesh size. When this trend continues for all the mesh sizes in the sampling nets (6.25 to 75 mm.), it has to be concluded that the sampling nets for O. shiranus were much more efficient for larger fish than for smaller fish.
In order to attain a normal distribution of the CPUE data and to make the variance independent of the mean, a logarithmic transformation was carried out. Most of the reservoirs were only fished with 8 nets which did not allow proper testing of the distribution of the CPUE within each reservoir. Mbvoniha dam was fished with 159 nets over a period of one year, and within that period with 32 nets in a timespan of 12 days.
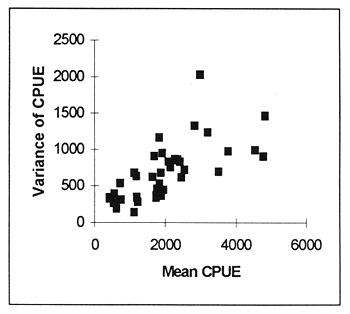 | 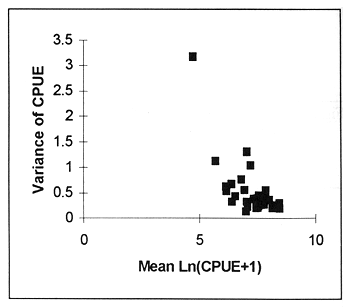 |
Figure 5: Pooled CPUE and variance of CPUE before and after transformation.
The Chi-square goodness-of-fit test showed that after transformation the pooled CPUE distribution did not come closer to a normal distribution. The CPUE of the 32 samples collected during 12 days slightly differed from a normal distribution (X2=3.29, df=1, p=0.070), but did not achieve a much closer fit after transformation (X2=5.14, df=2, p=0.077). The 159 samples collected during a period of one year did not differ from a normal distribution before transformation (X2=11.41, df=10, p=0.326), but did significantly differ after transformation with CPUE's (X2=16.41, df=8, p=0.037). Before transformation the variance of the pooled CPUE increased with an increase in in the mean, this effect was corrected after transformation of the pooled CPUE (Figure 5)
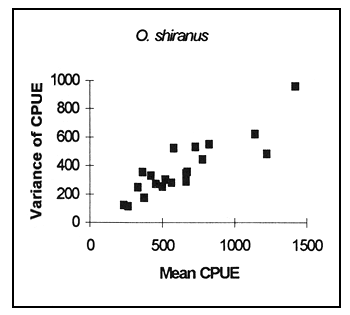
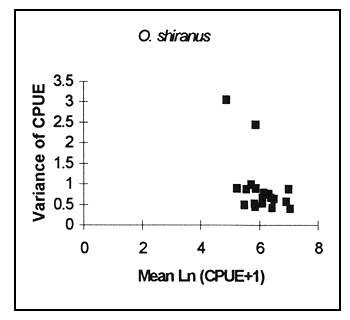
The logarithmic transformation of the CPUE data for B.paludinosus, brought the distribution slightly closer to a normal distribution. A Chi-square goodness-of-fit test on the 32 samples within 12 days at Mbvoniha dam showed this, before transformation the distribution was slightly different from the normal distribution (X2=5.92, df=2, p=0.052), while after transformation it did not differ significantly (X2=4.29, df=2, p=0.117). The improvement was however only marginal. The variance of the data is clearly positive correlated with the mean, the transformation made the variance independent of the mean (Figure 6).
In Mbvoniha the original CPUE data for O. shiranus did not differ significant from a normal distribution (X2=1.21, df=2, p=0.546). After the transformation the distribution could still be considered normal (X2=1.79, df=1, p=0.181), but had become less close to the normal distribution than before transformation. The variance became independent from the mean after transformation of the data (Figure 6).
 |  |
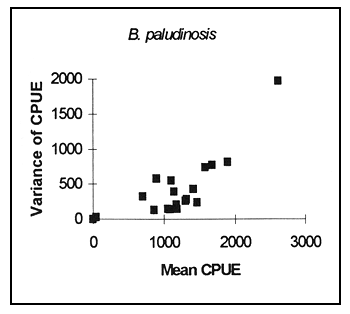 | 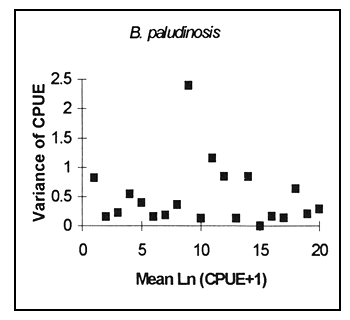 |
Figure 6: CPUE of O. shiranus and B.paludinosus, and variance of the CPUE before and after transformation