The typical farmer participates in a monetary economy. This is true for all farmers interviewed in Zambia. They need cash to buy items like medicines, clothes, and agricultural implements, to mention the most obvious. This means that the farmer must sell part of his products or services. Naturally, he wants to get the highest return (income per hour worked) on his efforts to produce for the market.
The typical farmer (in Zambia) has at his disposal land, water, (livestock) manure, agricultural tools and household labour. He seldom has mechanized farm equipment; rarely does he use permanent buildings. His main source of power is his own efforts and that of his family. He normally produces a number of different crops.
Regularly, at the start of the agricultural year, the farmer is faced with the questions:
There are two main reasons why “What to produce?” is a real problem for farmers. First, farmers do not produce all the crops/livestock products that their resources could possibly be used for. Therefore they have to choose. Second, several different combinations of inputs can be used to produce the same quantity of output. Thus, the farmer has quite some degree of freedom in increasing his production of one crop at the expense of another.
However, it seems unlikely that farmers, with years of experience behind them, spend much time pondering these questions. They do what they did last year, unless conditions (availability and prices of the major inputs, crops, livestock products) differ very much.
Nevertheless, when someone introduces a new activity (such as fish farming) the farmer has to consider not only the direct results of the new activity, but also how it will affect other activities on his farm.
Figure 1 illustrates a possible mix of cropping activities for a farmer who has difficulties finding markets for his produce. He therefore has idle resources, including household members. In this particular case the farmer does not use all the resources at his disposal. Why?
The first and most obvious cause would appear to be that the farmer cannot dispose of more than he produces. He cannot sell fish, nor “other products”; he can sell only limited amounts of maize and tomatoes.
However, it is existing technology which makes the market limitation a real obstacle. Known technologies permit substitution of factors of production within certain limits only. Thus, while it is possible to substitute some factors of production by others, it is often not possible to eliminate one completely. This is displayed schematically in figure 2. The farmer in Figure 1 has found that in no meaningful way can he replace his own effort in maize production by using more land, or more manure.
One might argue: why not use all the manure available in the fish ponds? The answer is that the manure is often not that easily available. The minimum effort is to bring it to the ponds; in rural Zambia that effort is normally preceded by the effort of collecting the manure from where free-grazing animals have left it.
The typical farmer's production mix
Access to markets: underemployment & idle resources
| INPUT | PRODUCT | INPUT | |||||
| Maize | Tomato | Tilapia | Other | Used | Avail | ||
| Land (ha) | 19.5 | 1/2 | 1/10 | 4/10 | 20.5 | 40 | |
| Water (m3) | 3000 | 500 | 1500 | 1000 | 5000 | 00 | |
| Labour (Mandays | 300 | 50 | 40 | 20 | 410 | 720 | |
| Manure (bags) | 30 | 5 | 10 | 5 | 50 | 80 | |
| Other | |||||||
| PRODUCTION | 50 bags | 20 buckets | 80 kgs | 45 boxes | |||
| USE: | |||||||
| i. | sale | 45 | 15 | 0 | 0 | ||
| ii. | consump. | 5 | 5 | 80 | 45 | ||
How to produce 50kgs of fish in ponds/year: Alternative combinations of inputs
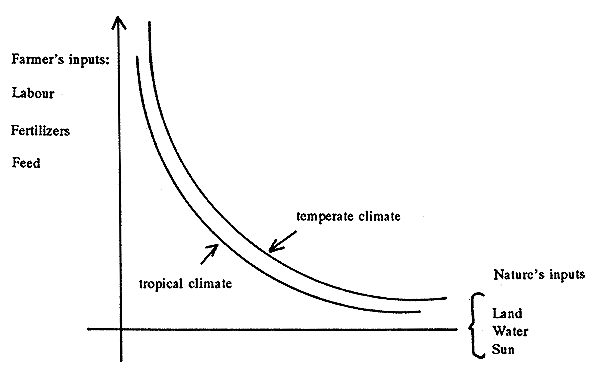
The vertical axis includes all those inputs which man brings to the fish culture effort: labour, fertilizers, feed introduced into the pond. The horizontal axis includes all those inputs which nature contributes: water with its naturally occuring nutrients, land, sunshine.
The curves above indicate the combination of factors of production that produces a particular quantity of fish. The top line corresponding to the temperate climate, indicates that due to the lower natural production (when compared to water bodies in a tropical climate), relatively more inputs are needed to produce the same quantity of inputs.
Then, why is some manure used and not all, or none? The answer is that the effectiveness (in terms of increasing the production of tilapia in a pond) of adding one kg of manure to the pond, depends upon how much has already been added (within a given period). See Figure 3. It is obvious that nobody will ever intentionally provide more manure than “m-max” in Figure 3. That would mean more expenses because of manure, and higher costs in terms of reduced production.
How much then will be added of manure? The answer is given in Figure 4. Manure will be added to the point where the cost of the additional kg of manure equals the net1 income obtained from sale of the additional tilapia produced by the additional kg of manure. Figure 4 shows the uncommon situation arising if manure can be bought at a fixed price; Figure 5, the common situation when manure is collected from free-roaming animals.
It is not too difficult to imagine a situation where almost no fertilizer will be used:
In this situation, when there are no obvious other uses for the land and water available, and the farmer can only use 80 kgs of tilapia per year, he has no incentive to use inputs of any kind (labour, feed or manure) to produce at a rate higher than the equivalent of 0.67 ton/ha year.
Neither is it too difficult to envisage a situation where the farmer, although he uses all the manure to which he has access, uses a relatively small part of it on fish ponds.
Imagine the farmer who has access to a theoretical maximum of 60 kg of manure (from his livestock). He can use it either on his tomatoes or in his fish ponds. The marginal (net) income generated by these two possibilities is shown in Figure 6. Upon reflection it becomes obvious, given the location of the marginal income curves, that the combination that gives the farmer the maximum net income (which is his goal; he doesn't mind the source of the net income) is “M-o”. Any other combination will reduce his global net income.
It is quite obvious from the above that, any modification of prices (but not a uniform price increase -- inflation -- or a uniform price reduction -- deflation) will change the allocation of factors amongst different products as well as the optimum input combination for any particular product.
If for example, harvest failures in other areas raise the price of tomatoes where the farmer lives, while availability of and cost (of purchased) of inputs remain unchanged, it makes sense for the farmer to use an increased share of his inputs on tomato production. See Figure 7.
Likewise, if one household member has the opportunity of earning income as an off-farm employee with a long-term, fixed (hourly, daily) wage, he is not going to engage in work on the farm that yields less of a return per hour or day worked. See Figure 7.
Declining marginal physical productivity:
Additional manure  diminishing increases in tilapia produced
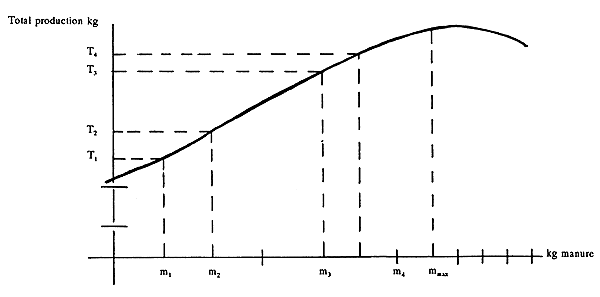
The figure shows the production of tilapia in a particular pond, in a particular place, with a given number of fish, and a given quantity of naturally occuring nutrients. It shows what happens to production when one input, manure, is added. On the vertical axis is measured the number of kilos of fish that is obtained in the pond. It is seen that even when no fertilizer is provided, some tilapia is produced. However, as the dosage of fertilizer goes up, so does the production in the pond, but at a certain point at a decreasing rate.
Cost of manure determines quantity used : purchase
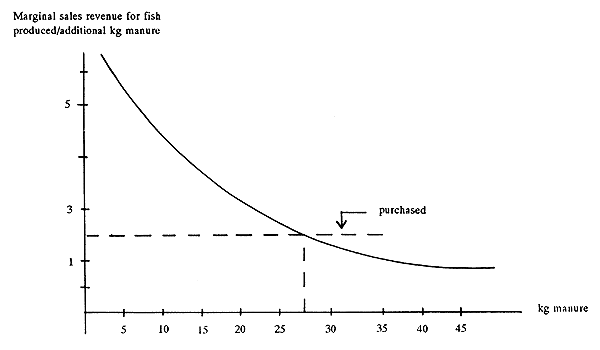
This figure is related to Figure 3. There are two differences. The first difference is that the vertical axis now shows the marginal, or “additional” production that is obtained by each additional kilo of manure. The second is that the addition is not measured in kilos but in the income the farmer derives from the additional production.
Cost of manure determines quantity used: available on farm
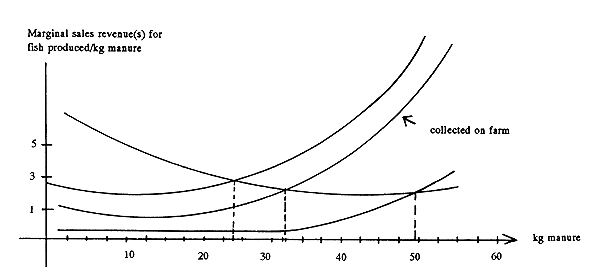
This is another version of Figure 4. The difference is that, in this case the farmer cannot purchase manure (the cost represented by the horizontal line in Figure 4) but is collecting it on his farm. The “cost” of so doing depends on the alternatives open to him. If he has good alternatives, the “opportunity cost” is higher than if he does not, and he therefore collects less manure than in the first case.
Allocation of fixed quantity of inputs: 60kg of manure between tomatoes and tilapia
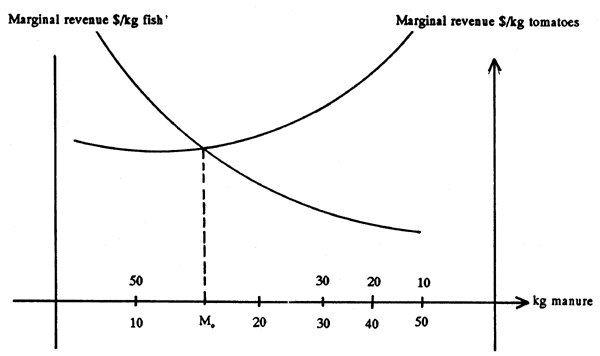
In this figure, two alternative crops (fish and tomatoes) are pitted against each other. They compete for a given quantity of manure: 60 kgs. The quantities applied in the fish ponds are measured from left to right; those applied on tomatoes, from right to left. If the farmer selects any other combination than that where the two curves intersect, he will be better off by switching to the combination indicated by the intersection.
Increased price for tomatoes: Effect on use of manure
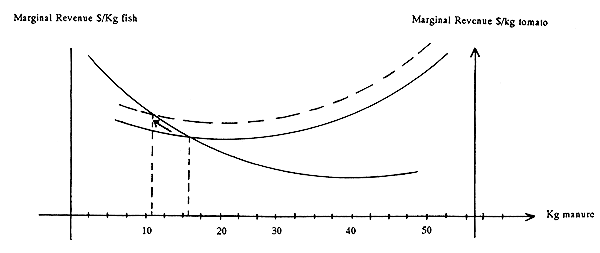
The axes are identical to those in Figure 6. The figure includes two curves of marginal income derived from sale of tomatoes. The higher curve is obtained through a higher price for tomatoes. It is rather obvious that such an increase will lead to more fertilizer being used for tomatoes and less for fish.
Salary increase: effect on use of labour in fish culture
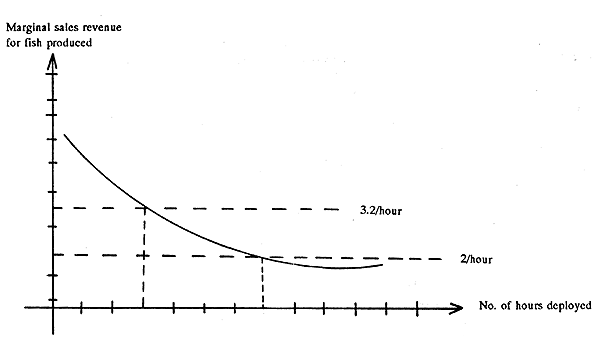
Similar to Figure 4, with the exception that the horizontal axis shows number of man hours instead of kg. of manure. The figure shows that when salaries increase (everything else remaining unchanged) the amount of manpower employed will decrease.
It should be obvious that changes in the cost of inputs(in this case the salaries) can lead to entier activities, including pond culture, being abandoned. If in Figure 8, the hourly salary rises above $7 per hour, it makes no sense to continue the fish farming activity. After all, it is sustainable return to labour (equivalent to salary) that interests household members.
A situation of labour shortage is displayed in Figure 9. The farmer is now using all his available labour. He will then start to ask himself, would it not be worthwhile to shift some of it from low-paying crops to high-paying crops? Perhaps producing just some of the crops and simply buying whatever the household consumes?
He will at first probably just calculate his average net return, per man-day, from the various activities:
| *75/450 bags/day × 50.00/bag | = 8.33/day in maize |
| *20/50 buckets/day × 15.00/buckets | = 6.00/day in tomatoes |
| *80/40 kgs/day × 2.00/kg | = 4.00/day in tilapia |
| *45/20 box/day × 4.00/box | = 4.50/day in “others” |
The analysis indicates that it might be worthwhile to shift manpower to maize production.
However, the farmer knows that the average is misleading, and that in all cases the marginal product (the product obtained from the last day of work on each particular crop) is smaller than what is obtained from the average day of work.
He will then compare the marginal product with what it would cost him to buy what he now produces for home consumption (fish and “others”). Where the cost of buying one day's worth of cultured fish production is considerably lower than the marginal income from the last day spent on maize production (in this case with an area of 30.25 ha) the farmer will probably decide to allocate as much of the fish farming labour as he can to maize production, without increasing the labour intensiveness of the latter. The increased income from maize production will be sufficient to pay for the fish he will not now produce from his pond, and to increase his expenditures on other goods and services. Thus, he has improved his overall material standard of living.
The appropriate technology for any particular farmer is in fact decided by (i) the existing technological relationships (which are given by the production functions) and (ii) by (access to) and prices of outputs and inputs. Therefore, extension advice must be based on the economic realities, and be modified as these realities change.
In particular this means that:
It may be inappropriate to make the farmer use available crop residues and livestock by-products to increase the output per unit of surface area of ponds.
Abandoned ponds may be an indication that they have outlived their economic usefulness, and that it is time to shift the emphasis in extension work away from introducing farmers to fish farming and towards intensification (improving the output/man-hour from those ponds which are still being used).
The typical farmer's production mix
Deficient access to markets: underemployment & idle resources
| INPUT | PRODUCT | INPUT | |||||
| Maize | Tomato | Tilapia | Other | Used | Avail | ||
| Land (ha) | 29.25 | ½ | 1/10 | 4/10 | 30.25 | 60 | |
| Water (m3) | 4500 | 500 | 1500 | 1000 | 6500 | 00 | |
| Labour (Man days) | 450 | 50 | 40 | 20 | 560 | 560 | |
| Manure (bags) | 45 | 5 | 10 | 5 | 65 | 100 | |
| Other | |||||||
| PRODUCTION | 75 bags | 20 buck | 80 kgs | 45 boxes | |||
| USE: | |||||||
| i. | sale | 70 | 15 | 0 | 0 | ||
| ii. | consump. | 5 | 5 | 80 | 45 | ||
A national economy
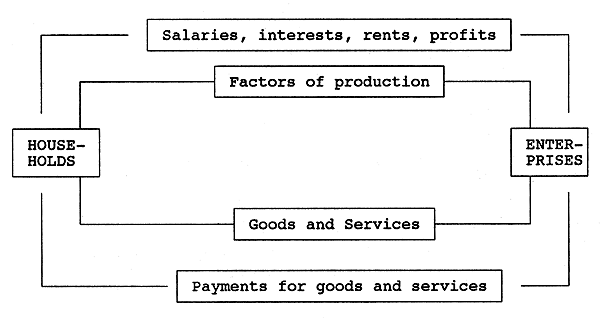
Note: The households own the enterprises. This means that the individuals who run and work in the enterprises, are also the individuals who make up the enterprises.