![]()
![]()
![]()
In a country like Malaysia where women constitute almost half of the population, the prevailing concern for the enhancement of women's economic participation and contribution is hardly surprising. Such concern seems to augur well with the genuine interest to improve the status and welfare of women. Furthermore, there has been growing recognition of the significant role of women in development efforts. It has also been widely recognized that the participation of women is crucial not only for development but also for the socio-economic welfare of their families. The increased economic participation of women is certainly a reflection of their increased opportunities in education, training, employment and, above all, increased emancipation of the women in this country.
Although still lagging behind that of men, the labour force participation rate (LFPR) of women has been increasing steadily from 38.9% in 1970 to 42.2% in 1980 (1970 and 1980 Population Census). The corresponding figures for men were noted as 81.0% and 84.8% for 1970 and 1980 respectively. In absolute terms, the 42.2% LFPR of women in 1980 means that there were more than 1.56 million women in the Malaysian labour force (1980 Population Census). It has been estimated that women made up 36% of the labour force in 1981 (Jomo et. al, 1985) as compared to 33% in 1970. (1970 Population Census). The Malaysian female labour force is comparatively young as indicated by the fact that nearly 40.0% of the total female labour force were under 25 years of age. The female LFPRs and age curves for Malaysia and its three regions are shown in Figures 1 to 4.
Several reasons can be advanced to explain for the increase in labour force participation rate of women over the last fifteen years. First, the government's policy of rapid export-oriented industrialization in the late 1960's has created tremendous new job opportunities for women in the manufacturing sector, particularly in the industrial estates and free trade zones (Jomo et. al, 1985). The types of industries where female employment are most evident include textiles, garments and electronics. It has been reported that the number of women employed in the manufacturing sector increased considerably from 73,058 in 1970 to 289,700 in 1979. In the electronics sector alone, the number increased from 3,200 in 1970 to 47,000 in 1976 and by 1983 the number has been estimated at well over 100,000 (Jamilah, 1983). Second, the rapid development of educational facilities giving ready and equal access of females as well as males to every level of education has invariably led to improved educational attainment and skills of women, increased their employability and income-earning and changed their attitude towards paid employment (Chia, 1987). Third, as contended by Chia (1987) the New Economic Policy which came into effect in the late 1970 has enabled Malay women “to make the transition from rural economic inactivity and status as unpaid family workers into modern sector paid employment.” Other reasons which might have attributed to the increased rate of participation include the erosion of social barriers to female employment, change in attitude amongst women themselves with regards to financial independence, personal satisfaction as well as having some control over their lives, later age of marriage and lower fertility rates.
Figure 1 Female labour force participation rates, Peninsular Malaysia, 1957, 1970, 1980
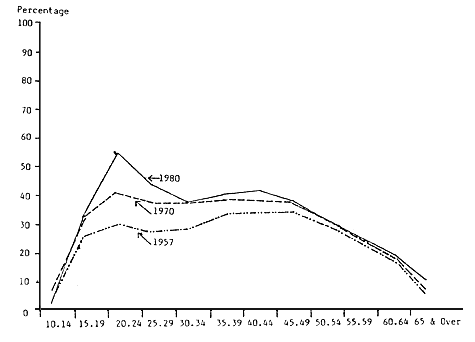
Sources: Population census reports, 1957, 1970 and 1980, Kuala Lumpur.
Figure 2 Female labour force participation rates, Sabah, 1960 and 1970
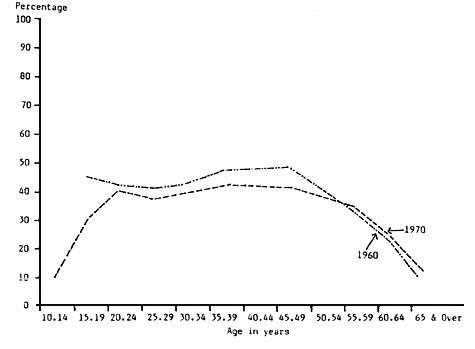
Sources: Population Census reports, 1970 and 1980, Kuala Lumpur.
Figure 3 Female labour force participation rates, Sarawak, 1960 and 1970
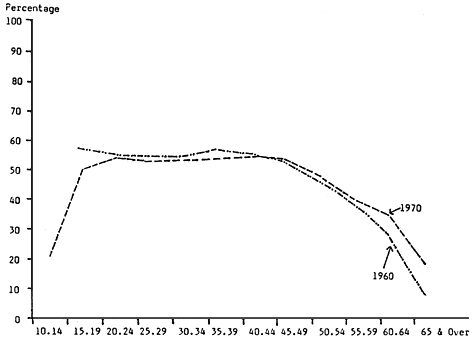
Sources: Population census reports, 1970 and 1980, Kuala Lumpur.
Figure 4 Female labour force participation rates, Malaysia, 1970 and 1980
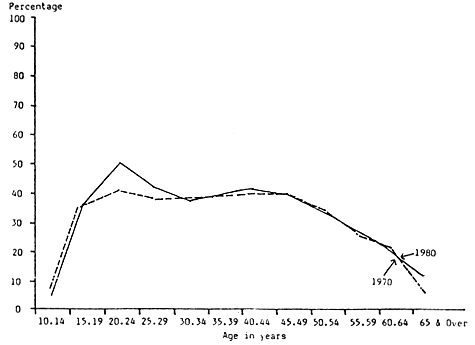
Sources: Population census reports, 1970 and 1980, Kuala Lumpur.
The bulk of the female labour force is located in the agricultural sector, although the proportion is declining rapidly. It has been estimated that of the experienced female labour force (working and unemployed with previous work experience) of 1.5 million in Malaysia in 1980, 43.7% were in the primary sector, 19.7% in the secondary and 34.2% in the tertiary sectors (Table 1). Within the primary sector, the women were predominantly concentrated in agriculture, while their presence in mining and quarrying was negligible. Over half of the women employed in agriculture were engaged in rubber cultivation and less than one-third in padi cultivation. The majority of those engaged in padi cultivation were Malays, while significant proportions of Chinese and Indian were also found in rubber. The predominance of women in agriculture may be attributed to the ease of entry in terms of educational requirements and the flexible working hours which has enabled the women to combine the burden of housekeeping and child care responsibilities with income-earning activities more easily. Studies have shown women even take their children along to work as in the case of the female plantation workers (Jomo et. al, 1984). The fact that many estates provide creches for the children of their workers has also prompted more and more women in the plantation sector to participate in paid employment.
Table 1 Distribution of experienced labour force aged 10 years and over by industry and sex, Peninsular Malaysia, 1957–1980
| (Percentage) | ||||||||||
| Industry | Males | Females | Difference (males .. females) | |||||||
| 1957 | 1970 | 1980 | 1957 | 1970 | 1980 | 1957 | 1970 | 1980 | ||
| Primary sector: | 55.8 | 48.0 | 34.8 | 78.4 | 59.7 | 43.7 | .. | .. | .. | |
| Agriculture and fishing | 52.7 | 45.4 | 33.2 | 76.6 | 58.9 | 43.3 | 23.9 | 13.5 | 10.1 | |
| Mining and quarrying | 3.1 | 2.6 | 1.6 | 1.8 | 0.8 | 0.4 | 1.3 | 1.8 | 1.2 | |
| Secondary sector: | 10.9 | 12.5 | 19.1 | 5.3 | 9.0 | 19.7 | .. | .. | .. | |
| Manufacturing | 7.0 | 9.5 | 12.6 | 4.3 | 8.5 | 18.6 | 2.7 | 1.0 | 6.0 | |
| Construction | 3.9 | 3.0 | 6.5 | 1.0 | 0.5 | 1.1 | 2.9 | 2.5 | 5.4 | |
| Tertiary sector: | 32.4 | 35.7 | 43.8 | 25.7 | 22.8 | 34.2 | .. | .. | .. | |
| Utilities | 0.7 | 1.0 | 0.2 | 0.1 | 0.1 | .. | 0.6 | 0.9 | 0.2 | |
| Commerce | 11.0 | 12.0 | 13.8 | 3.6 | 5.8 | 11.7 | 7.4 | 6.2 | 2.1 | |
| Transport and communication | 4.6 | 5.0 | 5.2 | 0.3 | 0.5 | 0.7 | 4.3 | 4.5 | 4.5 | |
| Services | 16.1 | 17.7 | 24.6 | 11.7 | 16.4 | 21.8 | 4.4 | 1.3 | 2.8 | |
| Activities undefined | 0.9 | 3.8 | 2.3 | 0.6 | 8.5 | 2.4 | 0.3 | 4.7 | 0.1 | |
| Total | 100.0 | 100.0 | 100.0 | 100.0 | 100.0 | 100.0 | ||||
| Dissimilarity index | 23.9 | 18.2 | 16.2 | |||||||
Sources: Population census reports, 1957, 1970 and 1980, Kuala Lumpur.
The higher concentration of female labour in the agricultural/rural sector is also borne out by the fact that the female LFPR in this sector in 1979 was estimated to be 49.3% as against 45.0% for the urban sector (Table 2). This pattern of higher female LFPR once again seems to suggest that there is a relative ease of combining the gender role of mothers and wives with income-earning activities in the agricultural sector.
In line with the structural transformation of the Malaysian economy from traditional/agricultural to modern/industrial sector activities, there has been some dramatic changes in the structure of female employment. As indicated in Table 1, the percentage of females employed in the agricultural sector declined steadily from 76.0% in 1957 to 58.9% in 1970 and to 43.3% in 1980. On the contrary, female employment in the manufacturing sector increased from 4.3% in 1957 to 8.5% in 1970 and 18.0% in 1980. Similar upward trend in female employment in services was also recorded, increasing from 11.7% in 1957 to 16.4% in 1970 and to 21.8% in 1980. As a result of the rapid decline in the proportion of women in agriculture the index of dissimilarity for sectoral distribution by sex fell from 23.9% in 1957 to 16.2% in 1980.
Although the percentage of women in agriculture fell drastically between 1957 and 1980, the absolute number of female workers in the sector rose from 401,000 in 1957 to 532,000 in 1980. The drastic decline in proportion and the insignificant growth in female employment in agriculture may be attributed to a host of interrelated factors including increased mechanization and modernization of the agricultural sector, which reduced the scope of activities traditionally performed by the women; the exodus of youths from the rural to urban areas in search of employment and entertainment and increased female employment opportunities in other sectors of the economy (Chia, 1987).
Table 2 Labour force participation rates by sex and stratum, 1979
| 15–64 Years | |
| All Strata | |
| Both Sexes | 66.4 |
| Male | 84.8 |
| Female | 47.8 |
| Urban | |
| Both Sexes | 64.8 |
| Male | 84.3 |
| Female | 45.0 |
| Rural | |
| Both Sexes | 67.1 |
| Male | 85.0 |
| Female | 49.3 |
Source: Malaysia, Labour Force Survey Report 1979, p.105
An examination of the industrial distribution of the female labour force by ethnicity reveals one pertinent observation. Whereas the female Malays and Indians were concentrated in agriculture and fishing, the female Chinese on the other hand, were more evenly distributed among agriculture and fishing, manufacturing, commerce and community, social and personal services. (Table 3). It is understood that the majority of the female Malays and Indians in agriculture were engaged in padi and rubber cultivation.
A comparison of the occupational distribution of the female and male labour force in Malaysia in 1980 is shown in Table 4. The highest concentration of female employment was found in the agricultural and fishery occupation group which absorbed about 42.1% of the total female labour force, followed by the production and related occupation group at 16.1% and clerical and related occupation group at 10.1%. Only an insignificant 0.3% of the female labour force were in the administrative and managerial occupational group as compared with 3.0% for men. What this means is that the majority of women are occupying only subordinate positions vis-a-vis their male counterpart. This is indeed a manifestation of sexual discrimination against female labour. Likewise, the fact that there is a high concentration of women in the clerical and related occupation group reaffirms the contention that women are typically employed in supportive and manual types of occupation (Jomo et. al, 1985).
From Table 4, women seemed to be over-represented in the professional, technical and related occupational group. This apparent over-representation is largely attributed to the high concentration of women in the teaching and nursing professions. These two professions alone accounted for over 80% of women in the professional and technical occupational group. It should be noted that both these professions are considered to be at the lower end of the hierarchy of professional employment. Other occupations where women were over-represented were veterinary and related occupations, statisticians, system analysis and related technicians, composers and performing artists.
Table 3 Distribution of experienced female labour force aged 10 years and over by industry and ethnic group, Peninsular Malaysia, 1980
| (Percentage) | |||||||
| Industry | By industry | By ethnic group | |||||
| Malays | Chinese | Indians | Malays | Chinese | Indians | ||
| Primary sector: | 53.1 | 27.1 | 54.9 | 64.6 | 20.8 | 13.7 | |
| Agriculture and fishing | 53.0 | 26.3 | 54.6 | 65.0 | 20.3 | 13.7 | |
| Mining and quarrying | 0.1 | 0.8 | 0.3 | 7.6 | 73.0 | 8.6 | |
| Secondary sector: | 16.7 | 25.5 | 20.1 | 45.2 | 43.3 | 11.2 | |
| Manufacturing | 16.4 | 23.2 | 18.6 | 47.0 | 41.8 | 10.9 | |
| Construction | 0.3 | 2.3 | 1.5 | 16.4 | 68.3 | 15.0 | |
| Tertiary sector: | 29.8 | 46.4 | 24.4 | 46.3 | 45.2 | 7.8 | |
| Utilities | 0.03 | 0.04 | 0.04 | 50.4 | 36.4 | 11.3 | |
| Commerce | 8.0 | 20.9 | 4.9 | 36.1 | 59.4 | 3.9 | |
| Transport and communication | 0.5 | 1.0 | 0.5 | 41.6 | 49.1 | 8.2 | |
| Finance and real estate | 1.0 | 3.2 | 1.2 | 29.6 | 61.5 | 7.9 | |
| Community, social and personal services | 20.3 | 21.3 | 18.5 | 53.8 | 35.4 | 10.1 | |
| Activities undefined | 0.3 | 0.9 | 0.4 | 28.8 | 61.5 | 9.0 | |
| Total | 100.0 | 100.0 | 100.0 | 54.1 | 34.0 | 11.1 | |
| Number | 652,680 | 410,535 | 133,895 | ||||
Source: Population census report for 1980, Kuala Lumpur
Table 4 Experienced labour force, aged 10 years and over, by occupation, sex and residential status, Malaysia, 1980
| Occupation | Total | Males | Females | Difference | |
| Total number | 4,593,173 | 3,092,733 | 1,500,440 | ||
| Percentage distribution: | |||||
| Professional, technical and related | 6.6 | 6.0 | 7.7 | 1.7 | |
| Administrative and managerial | 1.0 | 1.3 | 0.3 | 1.0 | |
| Clerical and related workers | 7.6 | 6.4 | 10.1 | 3.7 | |
| Sales workers | 8.7 | 9.7 | 6.6 | 3.1 | |
| Service workers | 8.4 | 8.4 | 8.2 | 0.2 | |
| Agricultural and fishery workers | 36.4 | 33.7 | 42.1 | 8.4 | |
| Production and related workers | 24.3 | 28.3 | 16.1 | 12.2 | |
| Unclassified | 2.2 | 2.4 | 1.7 | 0.7 | |
| Dissimilarity index | 15.5 | ||||
| Urban total number | 1,615,445 | 1,110,211 | 505,234 | ||
| Percentage distribution: | |||||
| Professional, technical and related | 10.5 | 9.1 | 13.4 | 4.3 | |
| Administrative and managerial | 2.1 | 2.8 | 0.6 | 2.2 | |
| Clerical and related workers | 14.1 | 10.7 | 21.4 | 10.7 | |
| Sales workers | 14.0 | 15.6 | 10.4 | 5.2 | |
| Service workers | 13.2 | 12.2 | 15.5 | 3.3 | |
| Agricultural and fishery workers | 5.3 | 5.3 | 5.3 | - | |
| Production and related workers | 33.9 | 37.8 | 25.4 | 12.4 | |
| Unclassified | 2.9 | 3.1 | 2.5 | 0.6 | |
| Dissimilarity index | 19.4 | ||||
| Rural total number | 2,977,728 | 1,982,522 | 995,206 | ||
| Percentage distribution: | |||||
| Professional, technical and related | 4.5 | 4.3 | 4.8 | 0.5 | |
| Administrative and managerial | 0.4 | 0.5 | 0.1 | 0.4 | |
| Clerical and related workers | 4.1 | 4.0 | 4.3 | 0.3 | |
| Sales workers | 5.8 | 6.4 | 4.6 | 1.8 | |
| Service workers | 5.7 | 6.3 | 4.5 | 1.8 | |
| Agricultural and fishery workers | 53.3 | 49.6 | 60.9 | 11.3 | |
| Production and related workers | 19.1 | 23.0 | 11.3 | 11.7 | |
| Unclassified | 1.8 | 2.0 | 1.2 | 0.8 | |
| Dissimilarity index | 14.3 | ||||
Source: Population census report for 1980, Kuala Lumpur
The division of labour along sexual line is not only evident between occupational groups but also within the same occupation group. Thus, whereas men dominate the high level managerial and supervisory positions, the women are mainly found in positions that are at the lower end of the occupation hierarchy (Chia, 1987). In the clerical and related occupations, for example, men are predominant in high positions such as clerical supervisors, government executive officials, and transport and communication supervisors, while women dominate subordinate and less satisfying occupations like typists, stenographers, card punch operators, bookeepers, cashiers, computing maching operators and telegraph and telephone operators. In the sales and service occupational groups, the managerial positions are more likely to be occupied by men, while women are contented to work as maids, cleaners, kitchen hands and waitresses. The sexual division of labour is also evident in the agricultural employment. For instance, in the plantation sector, men dominate as managers, supervisors and technicians while women dominate as estate labourers and workers. In the fishery sector, female workers in large fish processing plants are confined to low paying labour-intensive jobs such as sorting, dressing and packaging, while men dominate in activities like management of the plants, supervision and operation.
Lately, however, in conformity with the structural change of the economy, female occupational structure in the country also underwent some changes. A summary of the changes in the occupational structure of females in Peninsular Malaysia from 1957 to 1980 are given in Table 5. The most noticeable change occurred in the agricultural sector (including fishing and forestry) whereby the percentage of females engaged in agricultural work almost halved, declining from 76.5% in 1957 to 38.0% in 1980. On the other hand, all other occupational groups exhibited overall increases in their shares of total female labour force. These changes in the female occupational structure between 1957 and 1980 reflect, first, the rapid expansion of non-agricultural employment and, second, the increase in white collar jobs as a result of the rising educational achievement of the female labour force. Hence, with increased opportunities in education and training, women are able to penetrate into occupations which were once traditionally reserved for men.
![]()
![]()
![]()