![]()
![]()
![]()
CRAIG. R.E et S. FORBES, 1969 A sonar for fish counting. Fish. Dir. Skr. Ser. Havunders. 15. 210–219.
HANEK. G. et al., 1988 La pêche d'Isambaza (Limnothrissa miodon) au lac Kivu. RWA/87/012/DOC/TR/06, 91 p.
JOHANNESSON, k., 1984 A report of a consultancy to project GCP/RWA/008/NET in the field of fisheries acoustics-equipment and methods. Gisenyi, 20 p.
LAMBOEUF, M., 1989 Bilan des campagnes d'évaluation acoustique effectuées au lac Kivu de novembre 1984 à mars 1987. RWA/87/012/Aide mémoire no 54.
LINDEM, T., 1883 A preliminary analysis of hydroacoustic data from Maputo Bay. Lake Niassa and Cahora Bassa. FAO/GCP/MOZ/006/SWE, Field Document 6.
LINDEM, T., 1988 Results from the hydro acoustic survey Lake Kariba, Zambia/Zimbabwe SADCC fisheries project.
FIGURE 1
Débarquements d'Isambaza
FIGURE 2
Carte du lac Kivu montrant le schéma de prospection.
FIGURE 3
HADAS SYSTEM
Menu structure
FIGURE 4
Relation taille/poids/puissance d'écho
FIGURE 5
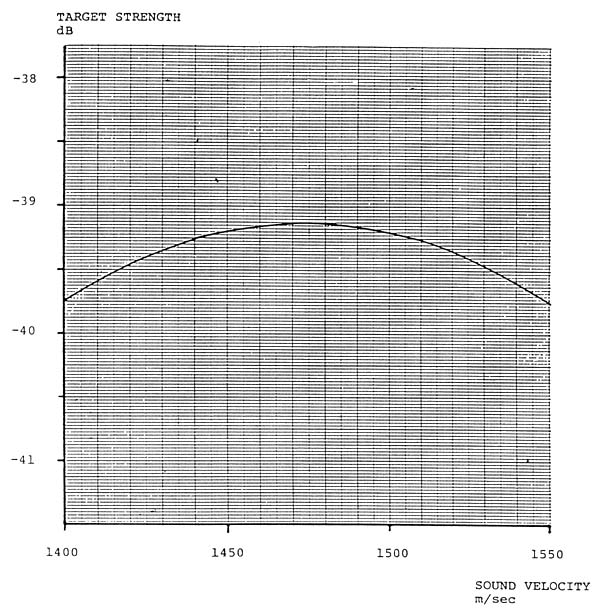
TARGET STRENGTH VS. SOUND VELOCITY.
| SIMRAD Reference Target | SIMRAD | ||||||
| NO. | SIGN. | DRAW | 87.04.07 | RLN | 70 kHz | 832-073394 | |
| CORRECT. | CONTR. | 87.06.03 | BR | 819-067175 | |||
| AUTH. | PAGE NO / OF / | FILE NO 546 - 46 | |||||
FIGURE 6
THE CURVE IS VALID FOR:
| TRANSM OUTPUT | 80 [W] |
| RECEIVER GAIN | 10 |
| TRANSDUCER | 70-24-F |
| TVG FUNCTION | 40 log r+2σr |
| PULSE DURATION | 0,6 ms |
| RANGE | 3–60 m |
FOR OTHER SETTINGS USE TABLE FOR CORRECTION
| CORRECTION | ||
| RECEIVER GAIN | Per step | -3 dB |
| TRANSDUCER | 74 AA | -7,5 dB |
| TRANSDUCER | dB |
FIGURE 6a
Fréquences de tailles
FIGURE 7
REACTION DES POISSONS A LA LUMIERE
FIGURE 8
Attraction des poissons à la lumière
FIGURE 9 Enregistrements effeçtués durant l'attraction lumineuse
(a) début, (b) agrégation maximum 40 minutes après l'allumage.
FIGURE 10
Distribution verticale de la biomasse
![]()
![]()
![]()