The purpose of the Chambo Fisheries Research project is to provide the Malawian Government with options for a new management plan in order to achieve an optimal exploitation of the fish resources in Lake Malombe, the Upper Shire area and the south-east arm of Lake Malawi on a sustained basis. A modification of the existing fishing regulations has become necessary, as the one in existence, prepared more than 7 years ago mainly on the basis of biological research, was never effectively enforced nor was its extension message passed on to the fishermen.
Overfishing, partly due to illegal fishing practises, has taken place, resulting in a severe depletion of stock of Chambo, the most valuable fish caught in the above mentioned water bodies.
To identify options for a new management approach the Chambo Fisheries Research project is currently carrying out biological and socioeconomic research. Data from the latter investigations provide a base for assessment of the impact of those options upon various sections of the fisherfolk.
Surveys on the economic situation of fisherman entrepreneurs, crew members and female heads of households have been undertaken, and their findings will be considered in the final draft of the management plan.
Results of surveys are elucidated in the present report, which focus on the fish traders in the traditional, the semi-industrial and the industrial sector of the fishery in the project area. This is supplemented by data on fish beach prices routinely collected in an ongoing traditional fishery catch assessment survey.
The fisheries in the south-east arm of Lake Malawi, the Upper Shire River and Lake Malombe are divided, according to the fishing techniques used, into the traditional, the semi-industrial and the industrial sector. All three sectors show different marketing patterns in terms of diversification, marketing channels, main species traded, working capital etc. It was therefore decided to stratify accordingly. Main attention was paid to the traditional fisheries sector, because it provides income earning opportunities to the bulk of small-scale traders, who would be seriously affected by the implementation of any effort-reducing aimed fisheries management measures.
Objective: The traditional fish trader survey was carried out to
assess the possible impact of new fisheries management options on the fish traders' activities.
Consequently, the survey addressed the following research topics:
estimation of the proportion of post harvest losses
Sampling strategy: Fish traders in the traditional sector of the fishery are not registered, and thus it was not feasible to make a comprehensive appraisal due to the time- and labour consuming nature of the work. Therefore, a pre-study was carried out in January 1991 to determine the number of traders operating in the area, to obtain a general idea about their equipment, the preferred fish species and the primary markets. This survey was prepared in a training course, and conducted on 23 beaches (15% of the beaches in the project area), which are visited frequently by the Technical Assistants of the Malawian Department of Fisheries for the purpose of catch assessment (Alimoso et al, 1991). As a result of the pre-study it was decided to follow the spatial stratification used by the Department of Fisheries (see map). Out of the total number of 440 fish traders, operating on those 23 beaches, 173 (40%) were chosen at random. A questionnaire (see annex) was prepared on the basis of suggestions made by a fish marketing consultant (FAO) and a nutrition consultant (FAO), reviewed together with the Technical Assistants of the Fisheries Department and tested and finalized during a training course in September 1991. The field work, involving ten Technical Assistants and the project specialist in socioeconomics, took place in October 1991. The data were analysed with Lotus 1–2–3 and Statgraphics programs in November 1991.
Semi-industrial fishing in the project area was done at the time of the survey by seven pair-trawl units, out of which 4 landed regularly at Namiasi. Discussions with Technical Assistants of the Fisheries Department provided basic information regarding the number of fish traders, equipment used and target species. It was suggested, that most of the traders show homogeneity in their economic performance. Therefore, it was decided to interview only five out of the estimated number of 100 traders. The questionnaire, used for interviewing fish traders in the traditional sector, was slightly modified. The interviews were carried out by the socioeconomist of the project and her counterpart.
Prior to the actual data collection, the Deputy Manager of the commercial fishing company MALDECO was consulted.
He provided information about MALDECO's fish distribution system, amounts of fish traded through the different marketing channels and a list of MALDECO's registered 49 Chambo traders. Six traders were interviewed using the questionnaire prepared for the semi-industrial sector. The field work was done by the marketing specialist counterpart of the project.
Objectives: Beach prices were collected primarily for cost and earning calculations to assess the profitabilty of the different fishing techniques used in the traditional fisheries sector.
Sampling strategy: Data collection on fish prices began in June 1990 and is still in progress. Information regarding prices is being collected in conjunction with the Catch/Effort data collection system used by the project. The data are stored and analysed in a computer program designed for catch assessment purposes (Stamatopoulos, 1991). Data on fish prices from June 1990 through December 1991 are used in the present report.
Extrapolating from the fish traders counts on the sample beaches it is estimated that the traditional sector of the fisheries in Lake Malombe, the Upper Shire River and the south-east arm of Lake Malawi is served by 2,000 – 3,000 fish traders. With approximately 50 beaches Lake Malombe alone attracts nearly 50% of the total.
Table 1: Fish trader density, by minor stratum
| Water body | MS | No of beaches | No of traders | Mean no/traders per beach | Mean no/traders per FE |
| Lake | 1.1 | 37 | 1200 | 32 | 7 |
| Malombe | 1.2 | 9 | 180 | 20 | 6 |
| Upper Shire | 1.3 | 8 | 150 | 19 | 1 |
| South-east | 2.1 | 19 | 200 | 11 | 1.5 |
| arm of Lake | 2.2 | 18 | 240 | 13 | 4 |
| Malawi | 2.3 | 17 | 400 | 24 | 2 |
| 2.4 | 18 | 400 | 22 | 4 | |
| 2.5 | 27 | 250 | 9 | 1 | |
| Total | 153 | 3020 |
The estimation of the total number of traders is hampered by the fact that traders often visit more than one beach to collect a sufficient amount of fish. The mean number of beaches visited by female traders (1.5) is significantly lower than for male traders (2.9) (ANOVA, F1, 170 = 9.821, p < 0.003).
Further, the number of traders may vary during the year owing catch fluctuations and involvement in other businesses.
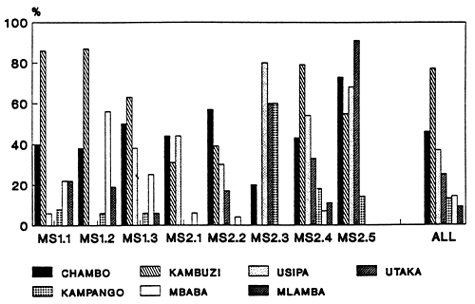
Chambo, Kambuzi, Usipa, Utaka, Kampango, Mbaba and Mlamba are the main target species of fish traders in the traditional sector of the fishery (figure 1).
Figure 1: Main target species of fish traders, by minor stratum
Fish processing is usually done by fish traders, as most fishermen do not process the fish before selling.
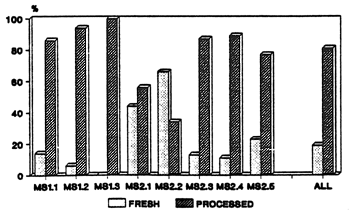
The bigger fish, Chambo and Kampango, is mainly sold fresh or smoked, while the smaller ones such as Kambuzi, Usipa and Utaka are sun-dried for preservation. Smoking is done in special kilns or open pits. For drying the fish is placed on drying racks or mats on the ground. Icing and salting is not common.
There is variation between minor strata in the proportion of fresh fish traders and traders who process the fish (figure 2). This variation is influenced by the species caught as well as by marketing logistic.
Example:
Fisherman Saidi stays in a village at Lake Malombe. He operates his Kambuzi seine net almost every day. He shares his catch 50 : 50 with the crew of 15 people.
His own share he sells normally to five different fish traders, out of which two come from his home village. These two traders sell the Kambuzi, after processing, to another trader, who comes out to the beach with his pick-up once a week. He buys wholesale, transports the fish to Thyolo and sells it wholesale to a trader on the fish market, who sells it retail to consumers.
Out of the other three traders, one carries the fresh fish to his home town Mangochi and sells it along the road to consumers.
The remaining two process the Kambuzi and take it to their home villages in the Dedza district, where one sells it to a market trader and the other one directly to consumers.
From the example above it can be seen, that fish trading in the traditional, small-scale sector involves many people at different stages. Fish may change owner many times, before it arrives at the consumer. Most traders can easily change their way of marketing.
Because of the complexity of the marketing network only the main marketing channels are given (figure 3).
Figure 3: Main marketing channels
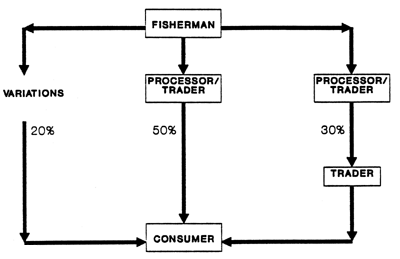
(direct sale fisherman → consumer on the beach is not included).
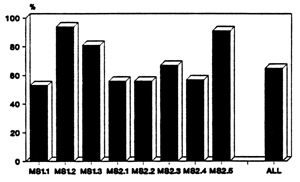
Customers for the fish from the southern part of Lake Malawi, the Upper Shire area and Lake Malombe are found all over the country. The majority of the fish traders sell fish to places outside the project area (figure 4).
Figure 4: Proportion of traders selling outside the project area, by minor stratum
Chambo from the main Chambo catching areas MS2.1 and MS2.2 is sold mostly to fish markets in Limbe/Blantyre (table 2).
Table 2: Proportion of Chambo sold to different destinations
| MS | Destinations | Percentage |
| 1.1 | Liwonde | 37 |
| Thyolo | 35 | |
| Balaka | 28 | |
| 1.2 | n. a. | |
| 1.3 | Balaka | 68 |
| Zomba | 16 | |
| Mchinji | 8 | |
| Namwera | 8 | |
| 2.1 | Limbe/Blantyre | 88 |
| elsewhere | 12 | |
| 2.2 | Limbe/Blantyre | 80 |
| Mangochi | 8 | |
| Lilongwe | 6 | |
| Namwera | 3 | |
| Chiradzulu | 3 | |
| 2.3 | mainly inside the project area | |
| 2.4 | Ntcheu | 69 |
| Lilongwe | 19 | |
| Blantyre | 8 | |
| Namwera | 4 | |
| 2.5 | Mzuzu | 40 |
| Dowa | 33 | |
| Chiradzulu | 27 | |
Utaka from MS2.5 is sold mainly to Lilongwe (49%), within Makanjira area (33%), Kasungu (15%) and Balaka (3%), while Usipa from the main Usipa catching area MS2.3 goes mainly to Mchinji (32%), Lilongwe (26%), Ntcheu (16%) and Rhumpi (13%).
Kambuzi is sold to many different locations, not necessarily town centres, but Limbe and Blantyre are again important destinations (table 3).
Table 3: Proportion of Kambuzi sold to different destinations
| MS | Destinations | Percentage |
| 1.1 | Mulanje | 32 |
| Blantyre | 20 | |
| Balaka | 15 | |
| Limbe | 7 | |
| Zomba | 6 | |
| Ntcheu | 6 | |
| Ulongwe | 4 | |
| Liwonde | 4 | |
| Phalula | 3 | |
| Machinga | 2 | |
| 1.2 | Thyolo | 88 |
| Mulanje | 5 | |
| Machinga | 2 | |
| Chiradzulu | 2 | |
| Zomba | 2 | |
| Mangochi | 1 | |
| 1.3 | Zomba | 33 |
| Mchinji | 27 | |
| Machinga | 14 | |
| Namwera | 7 | |
| Mangochi | 7 | |
| Lilongwe | 6 | |
| Balaka | 6 | |
| 2.1 | Blantyre | 83 |
| Dedza | 17 | |
| 2.2 | Chiradzulu | 49 |
| Blantyre | 28 | |
| Limbe | 15 | |
| Namwera | 4 | |
| Mangochi | 3 | |
| 2.3 | n.a. | |
| 2.4 | Zomba | 29 |
| Mulanje | 24 | |
| Lilongwe | 15 | |
| Blantyre | 14 | |
| Namwera | 8 | |
| Limbe | 5 | |
| Mangochi | 4 | |
| 2.5 | n.a. |
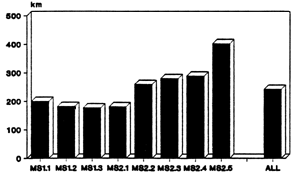
Traders cover long distances in order to obtain good prices for the fish (figure 5).
Figure 5: Mean distances to destinations outside the project area, by minor stratum
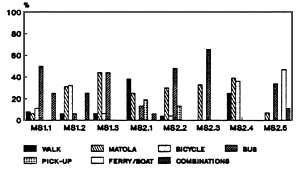
Matola and buses are the most common means of transport, but a considerable number of traders use bicycles or even walk to their target locations (figure 6). To cover short distances, e.g. from the beach to the main road, 60% of the traders hire bicycles and/or helpers.
Figure 6: Main transport means, by minor stratum
The seasonality of a fish traders' operation is influenced by various factors such as the availability of fish, which is determined by catch fluctuations and the effectiveness of fishing regulations, and further by access to the beaches and the feasibility of fish processing, which is hampered by heavy rains during the rainy season.
Lake Malombe
The fish traders' peak season is from May to October (figure 7).
Figure 7: Seasonality of operation in Lake Malombe
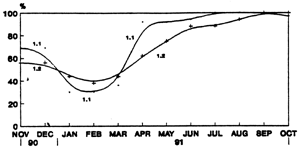
The present Fisheries Act prohibits Kambuzi seining from 1 January to 31 March. Although not explicitely mentioned in the Fisheries Act, the same regulation is applied for Nkacha nets, which is a modification of the Kambuzi seine. The main target species of traders in Lake Malombe is Kambuzi, which is caught with these nets. The closed season and the beginning of heavy rains explains the drop in activity in January, February and March.
The mean duration of a fish trading trip is significantly longer in MS1.2 than in MS1.1 (21 days versus 8 days) (ANOVA, F1,50 = 21.512, p < 0.0001). The mean number of trading trips per month is different in both areas (three in MS1.1 versus one in MS1.2, in the rainy as well as in the dry season).
Traders in both areas have similar target destinations and have to cover nearly the same distances. However, the fish supply in MS1.1 is more stable than in MS1.2, which enables fish traders there to collect sufficient fish for a trip in a shorter time periode (table 4). Fish sales appear to be more difficult for traders from MS1.2 than MS1.1. Traders in MS1.2 sell mainly to private customers rather than to other traders and generally have less stable business connections than those in MS1.1. The standard of fish processing facilities in MS1.2 is below those of MS1.1, which could explain the longer processing time in MS1.2.
Table 4: Average duration of fish trading transactions, Lake Malombe (days)
| MS1.1 | MS1.2 | |
| Travelling to the beach | 0.5 | 1 |
| Collection of fish | 3 | 7 |
| Processing of fish | 1.5 | 5 |
| Travelling to the market | 1 | 1 |
| Selling the fish | 2 | 7 |
| Total | 8 | 21 |
Upper Shire River
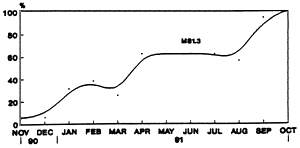
Chambo seining as well as Kambuzi seining is prohibited in MS1.3 from 1 November until 31 March. This explains the drop in fish trading activities during that time period (figure 8).
Figure 8: Seasonality of operation in the Upper Shire
Traders in the Upper Shire area manage to complete one to two trading trips per month during rainy season and one to three trips in the dry season (duration per trip see table 5).
Table 5: Average duration of fish trading transactions, Upper Shire River (days)
| MS1.3 | |
| Travelling to the beach | 1 |
| Collection of fish | 3.5 |
| Processing of fish | 1.5 |
| Travelling to the market | 1 |
| Selling the fish | 4 |
| Total | 11 |
South-east arm of Lake Malawi
As in the other areas of the project region, in the south-east arm of Lake Malawi the fisheries regulations on closed seasons (Chambo seine nets and Kambuzi seine nets: 1 November -31 December) influence fish traders activities. In MS2.4, where fish traders operate almost throughout the whole year on a high level, gillnetting is the most common fishing technique and is not affected by the Fisheries Act.
The general trend shows that the activity level increases towards October, which is the peak season for Chambo (figure 9).
Figure 9: Seasonality of operation in the south-east arm of Lake Malawi
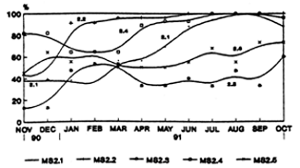
The duration of a fish trading trip differs significantly between MS2.1, MS2.2 and MS2.5, while MS2.3 and MS2.4 show homogeneity (ANOVA F4, 98 = 27.833, p < 0.0001) (table 6).
Table 6: Average duration of fish trading transactions, south-east arm of Lake Malawi (days)
| 2.1 | 2.2 | 2.3 | 2.4 | 2.5 | |
| Travelling to the beach | 0.25 | 0.5 | 0.5 | 0.5 | 2 |
| Collection of fish | 2 | 1 | 3 | 3 | 13 |
| Processing of fish | 1 | 0.5 | 3 | 2 | 6 |
| Travelling to the market | 0.25 | 0.5 | 1 | 1 | 2 |
| Selling the fish | 1.5 | 1 | 5 | 3 | 5.5 |
| Total | 5 | 3.5 | 12.5 | 9.5 | 28.5 |
| Mean no. of trips per month | 4 | 2 | 1 | 3 | 1 |
Not surprisingly, the areas where transactions are carried out most rapidly are the main Chambo landing beaches in MS2.1 and MS2.2. In MS2.2 Chambo fishermen “allocate” 1–2 fish trading trips per month to fish traders, which explains the low mean number of trips per month.
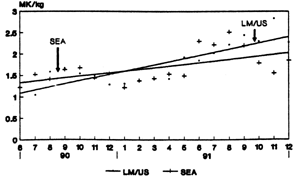
The Chambo stocks in Lake Malombe suffered a major collapse in 1990/1991 (Van Zalinge et al, 1991). Consequently, the Chambo beach prices increased substantially there (figure 10). However, the shortage of Chambo in Lake Malombe affected also the prices of Chambo caught and sold in the south-east arm of Lake Malawi (for detailed price information see annex).
Figure 10: Increase of Chambo beach prices, 1990 – 1991
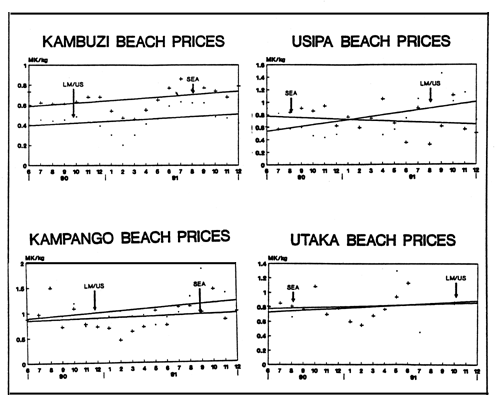
The beach prices for all other fish from Lake Malombe increased as well (figure 11).
Figure 11: Beach price increase for Kambuzi, Usipa, Utaka and Kampango
Gender distribution among traders
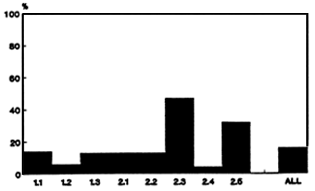
Female participation in fish processing and/or trading is rather low in the project region (figure 12), except in MS2.3 and MS2.5.
Figure 12: Proportion of female fish traders, by minor stratum
In MS2.3 and MS2.5 the proportion of wives of fishermen involved in fish processing and/or trading is higher than in any other location in the region (figure 13), which suggests, that in these MS the female fish traders are mostly wives of fishermen.
Figure 13: Involvement of fishermen's wives in fish processing, by minor stratum
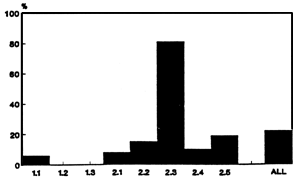
Various factors prevent females from taking up fish processing and fish trading. For example, the traditions of the muslim Yao, the dominant tribe in the project region, do not allow women to undertake businesses. Although these traditions have declined, they are still influential enough to hamper female participation in fish trading (the fisherfolk of MS2.3 are mainly of christian Tonga/Tumbuka origin).
Other factors include lack of start-up capital and limited access to the resource (Mdaihli and Donda, 1991). Access to fish becomes easier in cases when the fish trader is a relative of the fisherman. About 20% of the female fish traders reported that the fisherman, from whom they purchase the fish, is one of their relatives (in comparison to 8% of the male fish traders).
Access to the resource could be facilited through crew membership of females, but it is not common for females to participate in fishing operations in the project area.
Types of traders
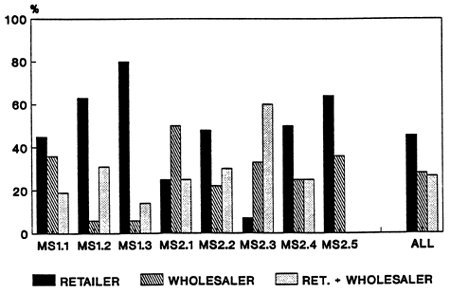
Fish traders in the project area operate on a retail and/or wholesale basis. A considerable number of traders are not bound to one type of trading (figure 14). No difference was found between male and female traders.
Figure 14: Types of traders, by minor stratum
Residence
About half of the fish traders, males as well as females, reside outside the project area in places on average 150km from the beach.
Age
Female fish traders are generally younger than the males. Their mean ages (females = 31; males = 38) differ significantly (ANOVA, F1,170 = 9.453, p < 0.003). There is little variation within the trader groups.
The mean starting age of fish traders is 29 years. There is no statistically significant difference between genders, which suggests that female engagement in fish trading is a rather recent development or that females drop out sooner (ANOVA, F1, 170 = 4.915, p > 0.05).
Marital status
The majority of female fish traders (61%) are heads of households (single 21%, divorced 29%, widowed 11%). Marriage often deters females from getting involved in cash income earning-activities.
Male fish traders are usually married (91%).
Household size
The mean household size of fish traders is eight people. There is no statistically significant difference in gender (ANOVA, F1,170 = 0.298, p > 0.05).
Education
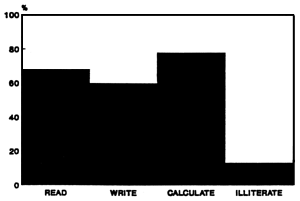
Traders were asked about their reading, writing and calculation abilities.
Figure 15 shows, that a small number of traders is illiterate and, surprisingly, 1/5 of the traders are not able to calculate.
The proportion of illiterate female traders is considerably higher than of males (32% versus 10%).
Figure 15: Education of fish traders
Previous occupation
Almost half of the female fish traders reported that they had no other profession prior to taking up fish trading (it would be interesting to ascertain the source of start-up financing).
Only a minority of the male traders did not have a former occupation (figure 16a,b).
Figure 16a: Previous occupation of male fish traders (%)
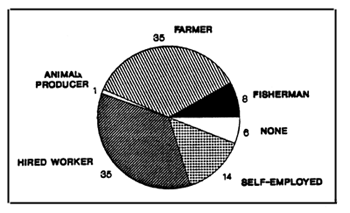
Figure 16b: Previous occupation of female fish traders (%)
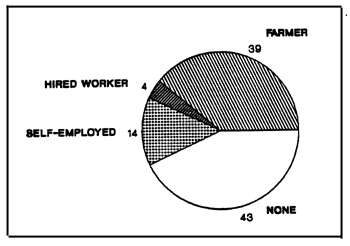
Additional occupation
A high proportion of traders are involved in additional income-earning activities (table 7). The seasonal character of fish trading allows many of them to undertake farming during the rainy season.
Table 7: Additional occupation of fish traders (%)
| Female traders | Male traders | |
| Fisherman | -- | 8 |
| Farmer | 54 | 47 |
| Hired worker | -- | 3 |
| Self-employed | 7 | 9 |
| None | 39 | 33 |
The target species of fish traders, who buy mainly from the traditional sector of the fishery, have been discussed already in the section above. Table 8 would suggest that female fish traders to a larger extent market smaller fish such as Usipa and Utaka, but the data should be viewed with caution. The main Usipa catching area coincides with the highest female employment in fish trading. Other factors than the main species caught also influences female participation in this branch of the business.
Table 8: Target species, by male and female fish traders (%)
| Species | Female traders | Male traders |
| Chambo | 21 | 45 |
| Kambuzi | 61 | 61 |
| Usipa | 61 | 32 |
| Utaka | 39 | 21 |
| Kampango | 14 | 12 |
| (responses are not mutually exclusive) | ||
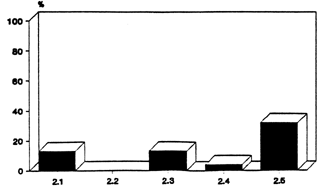
Throughout the survey in Lake Malombe and the Upper Shire no fish trader was found, who owns his or her fishing equipment.
Figure 17 shows the ownership of fishing equipment for the south-east arm.
Figure 17: Ownership of fishing equipment in the south-east arm of Lake Malawi
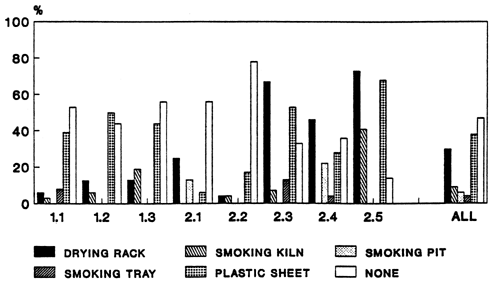
For processing many fish traders use their own equipment (figure 18). It is not surprising to find a high proportion of traders in MS2.2 who do not own any processing equipment since most of them sell fresh fish. In addition, some mainly use drying racks and smoking kilns provided by the Fisheries Department.
Figure 18: Ownership of fish processing equipment, by minor stratum
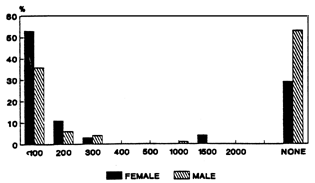
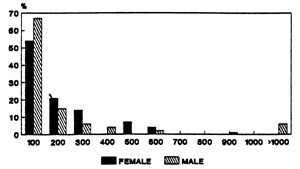
The capital invested in fish processing equipment is in many cases less than MK100 per fish trader. Female traders dominate in this group (figure 19).
Figure 19: Value of fish processing equipment, grouped into classes, by male and female fish traders
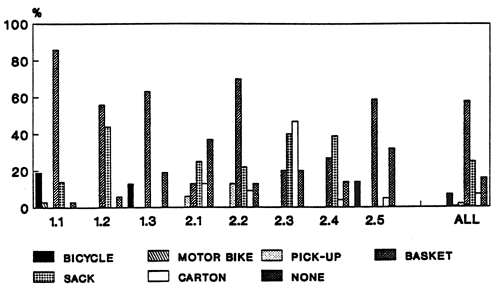
The majority of the fish traders travels by bus or hitchhikes (compare chapter 3.4). They use sacks, baskets or cartons for fish tranportation. Trader with own pick-ups operate mainly in MS2.1 and MS2.2 (figure 20).
A large proportion of male and female traders own transport equipment worth less than MK100. Women are not found in value classes higher than MK300.
Figure 20: Ownership of fish transport equipment, by minor stratum
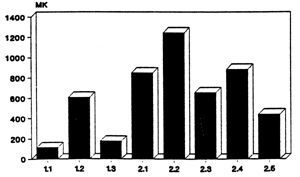
A comparison of working capital indicates, that MS2.2 is frequented by a few rich fish traders, while MS1.1 is the target location for many traders with a mean working capital of not significantly more than K100 (figure 21). MS1.2, MS2.1, MS2.3 and MS2.5 are not significantly different from each other, but this group is significantly different from the other areas of the project region (ANOVA, F7, 164 = 3.759, p < 0.01).
Figure 21: Mean working capital, by minor stratum
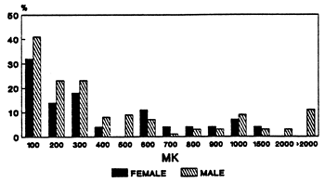
The mean working capital of female and male traders is not significantly different (ANOVA, F1,170 = 1.931, p > 0.05).
Grouping of capital into classes shows that males and females are almost equally represented in all groups below MK1500 (figure 22).
Figure 22: Working capital classes, by male and female fish traders
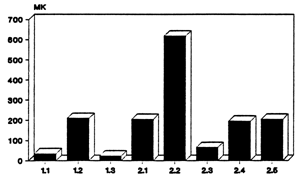
Not unexpectedly, the highest profit is made in MS2.2 (figure 23). MS1.1, MS1.3, MS2.3 and MS2.4 are statistically homogeneous as are MS1.2, MS2.1 and MS2.5 (ANOVA, F7,164 =2.993, p < 0.01).
Figure 23: Mean profit per fish trading trip, by minor stratum
A profit-per-trip comparison does not show a significant difference between male and female fish traders (ANOVA, F1,170 = 5.13, p > 0.05). This correspondends with the working capital figures. In many cases the profit per fishing trip does not reach MK100 (figure 24).
Figure 24: Profit classes, by male and female fish traders
Statistical analysis confirms the commonly heard statements by fish traders that the more money they have to invest, the more profit they can make. A correlation was found between the working capital and the profit per fish trading trip (Regression, log transformed data, r=0.633224, p < 0.001).
Some fish traders incur a loss instead of making profit (table 9). No reasonable explanation was found for the high figure for MS1.3.
Table 9: Proportion of fish traders incurring a loss in their most recent fish trading trip
| MS | 1.1 | 1.2 | 1.3 | 2.1 | 2.2 | 2.3 | 2.4 | 2.5 |
| Prop. of traders | 8 | 6 | 37 | --- | 4 | 7 | 4 | 9 |
The diversity of fish trading practises in the traditional sector of the fishery acts as a barrier in identifying homogeneous groups of fish traders.
Roughly the trader community can be grouped as follows: traders without any transport equipment, traders with a bicycle and traders with a pick-up. Cost and earning calculations for representatives of the three groups are shown in the following tables.
Table 10: Annual costs and earnings of a trader without any equipment in multi-species trade
| Investment costs: | |||
| Cash | 180 | ||
| Total | 180 | ||
| Fixed costs: | - | ||
| Variable costs: | |||
| Fish | 2100 | ||
| Transport | 210 | ||
| Lodging and food | 28 | ||
| Market fees | 21 | ||
| Wrapping material | 49 | ||
| Total | 2408 | ||
| Grand total costs: | 2408 | ||
| Earnings: | |||
| per trading trip: | 240 | ||
| No. of trips per month in dry season | 2 | ||
| No. of trips per month in rainy season | - | ||
| Annual earnings: | 3360 | ||
| Annual profit: | 952 | ||
| Return rate on investment: | 5.28 | ||
| Investment costs: | |||
| Dryings rack | 20 | ||
| Basket | 5 | ||
| Cash | 170 | ||
| Total | 195 | ||
| Fixed costs: | |||
| Depreciation | 19 | ||
| Total | 19 | ||
| Variable costs: | |||
| Fish | 3120 | ||
| Processing | 120 | ||
| Transport | 360 | ||
| Lodging and food | 252 | ||
| Market fees | 120 | ||
| Wrapping material | 7.2 | ||
| Helpers | 24 | ||
| Total | 4003.2 | ||
| Grand total costs: | 4022.2 | ||
| Earnings: | |||
| per trading trip: | 430 | ||
| No. of trips per month in dry season | 2 | ||
| No. of trips per month in rainy season | 2 | ||
| Annual earnings: | 10320 | ||
| Annual profit: | 6297.8 | ||
| Return rate on investment: | 32.29 | ||
Table 12: Annual costs and earnings of a trader equipped with a bicycle in multi-species trade
| Investment costs: | |||
| Bicycle | 280 | ||
| Plastic sheet(s) | 10 | ||
| Basket(s) | 10 | ||
| Drying rack(s) | 55 | ||
| Cash | 400 | ||
| Total | 755 | ||
| Fixed costs: | |||
| Depreciation | 56 | ||
| Maintenance transport equipment | 73 | ||
| Maintenance processing equipment | 7 | ||
| Total | 136 | ||
| Variable costs: | |||
| Fish | 24490 | ||
| Processing | 681 | ||
| Transport | 3476 | ||
| Lodging and food | 681 | ||
| Wrapping material | 158 | ||
| Helpers | 395 | ||
| Total | 29881 | ||
| Grand total costs: | 30017 | ||
| Earnings: | |||
| per trading trip: | 553.5 | ||
| No of trips per month in dry season | 7 | ||
| No of trips per month in rainy season | 6 | ||
| Annual earnings: | 43726.5 | ||
| Annual profit: | 13709.5 | ||
| Return rate on investment: | 18.15 | ||
Table 13: Annual costs and earnings of a trader equipped with a pick-up trading fresh Chambo
| Investment cost: | |||
| Pick-up including covering material | 16300 | ||
| Cash | 2400 | ||
| Total | 18700 | ||
| Fixed costs: | |||
| Depreciation | 1630 | ||
| Costs of maintenance | 900 | ||
| Total | 2530 | ||
| Variable costs: | |||
| Fish | 110400 | ||
| Fuel | 7590 | ||
| Lodging and food | 966 | ||
| Market fees | 3300 | ||
| Helpers | 1380 | ||
| Total | 123636 | ||
| Grand total costs: | 126166 | ||
| Earnings: | |||
| per trading trip: | 4330 | ||
| No of trips per month in dry season | 3 | ||
| No of trips per month in rainy season | 5 | ||
| Annual earnings: | 199180 | ||
| Annual profit: | 73014 | ||
| Return rate on investment: | 3.9 | ||
Table 14 shows returns on variable costs for the different species (only single-species traders are included). The returns for Chambo traders in MS2.3 and MS2.5 are significantly higher than in the other minor strata, but the small sample size prohibits conclusions (ANOVA, F5, 20=14.668, p < 0.001).
Returns for Kambuzi, Usipa and Utaka do not show any significant difference between minor strata and between species.
Table 14: Returns on variable costs: for Chambo, Kambuzi Usipa and Utaka
| MS | Mean return per unit variable cost | |
| Chambo | 1.1 | 1.12 |
| 1.3 | 1.24 | |
| 2.1 | 1.25 | |
| 2.2 | 1.60 | |
| 2.3 | 2.73 | |
| 2.5 | 3.42 | |
| Kambuzi | 1.1 | 1.28 |
| 1.2 | 1.30 | |
| 1.3 | 1.23 | |
| 2.1 | 1.17 | |
| 2.2 | 1.58 | |
| 2.5 | 1.43 | |
| Usipa | 2.1 | 1.35 |
| 2.2 | 1.88 | |
| 2.3 | 1.53 | |
| 2.4 | 1.68 | |
| 2.5 | 1.45 | |
| Utaka | 2.3 | 1.20 |
| 2.5 | 1.60 |
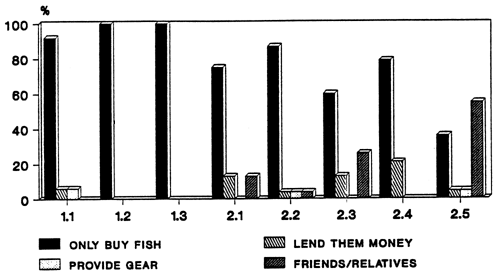
In the south-east arm of Lake Malawi fish traders appear to have a more stable relationship with fishermen than in the Upper Shire area and Lake Malombe (figure 25a and 25b).
Figure 25a: Proportion of fish traders who always buy from the same fisherman entrepreneurs
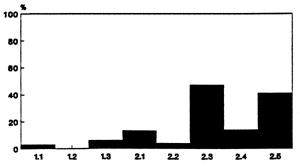
Figure 25b: Fish traders' relationship to fisherman entrepreneurs
The Chambo Fisheries Research project has discovered that the Chambo fishery in Lake Malombe is about to collapse and expects catch declines in future in other fisheries and other areas of the project region (Van Zalinge et al, 1991).
The present developments exacerbate the economic problems faced by the fisherfolk and related businessmen and women.
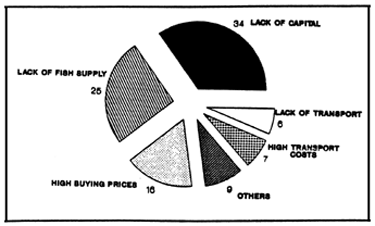
Consequently lack of fish supplies, together with lack of capital, high fish prices, lack of transport facilities and high transportion costs were quoted as the main problems of fish traders (figure 26).
Figure 26: Main problems of fish traders (%)
Scarcity of fish
Fish traders were asked about their target species and, in comparison to that, about the species they have actually traded during the previous fish trading trip.
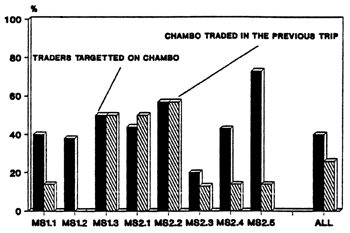
Not surprisingly, the demand for Chambo of many traders in Lake Malombe could not be satisfied because of the collapse of the Chambo stock (figure 27). Figures for MS2.4 and MS2.5 could indicate the same trend, but this must be confirmed on the basis of catch data. However, the survey period (October) is within the season of the highest Chambo catches.
Figure 27: Comparison Chambo demand - Chambo supply
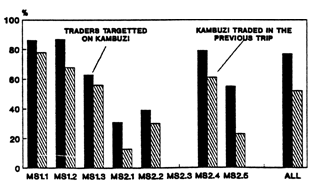
Kambuzi is still sufficiently abundant. Most Kambuzi traders were able to buy this species during their previous fish trading trip, although not always in the quantities required.
Figure 28: Comparison Kambuzi demand - Kambuzi supply
High transportation costs
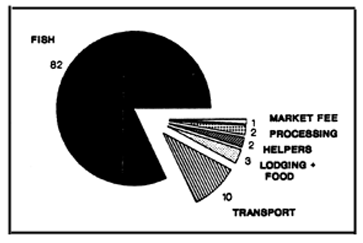
The capital endowment of the fish traders has been dicussed in the section above. Fish traders typically spend 10% of their working capital for transport alone (figure 29).
Figure 29: Proportion of different costs; for an average fish trading trip
Post harvest losses
A common problem in fish marketing is a loss of profit due to fish spoilage. However, in all minor strata of the project area about 70% of the traders did not report any considerable loss between September 1990 and September 1991. Where it occured, 8% of the traders lost all the fish, 5% more than half, 12% half and 8% less than half the amount they had bought.
Post harvest losses occur more frequently in the rainy than in the dry season.
Semi-industrial fishermen in the project area catch a much smaller variety of fish species than the traditional fisherman do. Their catch consist mainly of Chisawasawa (85%), followed by Chambo (6.6%), Catfish (2%), Utaka (1.8%) and a variety of other, not specified fish (5%).
Consequently, fish traders, who buy from those fisherman, trade mainly Chisawasawa.
Fish buying in Namiasi, where 4 out of the 7 semi-industrial pair-trawl units were landing during the survey period, shows the following patterns. All fishermen sell at a fixed price, which they have agreed on among themselves1. Fish traders, from inside and outside the project region, contact the semi-industrial fisherman and book the catch of a specific day in advance. The traders appear at the landing site in the late afternoon, wait for the fishermen and fill after arrival of the pair-trawlers their (own or hired) pick-ups with fish. They preserve the fish with ice, bought in Mangochi or from the ice plant in Namiasi, if in operation. After loading, they travel straight to Limbe market and sell there to another fish trader. Fishermen allocate up to three “trips” per month to a single trader.
A small amount of the pair-trawler's catch is sold directly to customers at the landing site or to fish traders, who process it before sale.
The following cost/earning calculation for an average fish trading trip was done on the basis of 5 interviews with fish traders.
| Costs | |
| Fish (48 crates of Chisawasawa) | MK 720 |
| Transport (fees for hiring a pick-up inclusive driver) | MK 340 |
| Helpers (transport of crates at landing site and at the market) | MK 20 |
| Ice (10 boxes) | MK 150 |
| Total: | MK 1230 |
| Earnings | MK 1300 |
| Profit | MK 70 |
Fish traders in Namiasi complained about a shortage of fish. They would like to expand their business and undertake more trips per month than they are able to do at present.
Further, they complained about the low profit due to high buying prices at the beach and low fish prices on Limbe market.
Limbe market, the main fresh fish market in reasonable distance from Namiasi, is target market for fish traders from all over the area. Sometimes the demand for fresh fish at Limbe market is satisfied and traders from Namiasi have to sell the fish at very low prices.
The industrial fishing company Maldeco caught app. 1600t of Chambo and 1200t of other species, mainly Chisawasawa, in 1991.
According to the Deputy Manager of the company, Maldeco's marketing policy is aimed at a wide coverage of fish supply. The main part of the Chambo catch is sold either through Maldeco's own marketing system (60%) or wholesale to some 40 private fish traders (35%).
The company runs two new and two old trucks, which transport fish to Blantyre, Lilongwe and Mzuzu. The company's aim is to supply the super markets in Lilongwe and Blantyre eight times per month and the one in Mzuzu ones a week with fresh Chambo. In addition, Maldeco has opened two fish shops recently, in Lilongwe and in Blantyre.
The private fish traders have to apply to be included in Maldeco's trader list. The company checks on the target market, the transport facilities and the business experience of those traders. It is explicitly mentioned on the list, that deliveries to super markets and cold storages are a first priority before any fish is sold wholesale. Any customer not on the trader list has to buy fish on retail basis. Maldeco allocates one trading trip to each Chambo wholesale trader per month.
Chisawasawa is sold either fresh to Chambo traders in times of Chambo shortages, or processed to a second set of wholesale traders, who are registred on a “Chisawasawa list”. These traders are entitled to trade 10 bags of processed fish two times per month. Any other customer, who is not on the list, has to pay retail prices, if the amount of fish bought does not exceed 5 bags.
Chambo trading from Maldeco is a very lucrative business, but requires a large working capital. The following calculation was done for an “average Chambo trader” on the basis of five interviews2.
| Costs | |
| Fish (50 crates of Chambo) | MK 3238 |
| Transport (fees for hiring a pick-up inclusive driver) | MK 400 |
| Market fees (MK1 per crate) | MK 50 |
| Ice (10 boxes) | MK 150 |
| Total: | MK 3838 |
| Earnings | MK 5100 |
| Profit | MK 1262 |
Like the traders in the semi-industrial sector of the fishery Maldeco's fish traders complained about the company's policy to limit the number of trading trips per month. In addition, they considered Maldeco's own involvement in fish trading on a retail basis in Blantyre and Lilonge as an increase of competition at their cost.
2 Wholesale price for Chambo: MK 2.59/kg
Wholesale price for dried Chisawasawa: MK 3.92/kg
In Malawi, the demand for fish is much higher than the supply. Fisherman entrepreneurs, not the fish traders, are in the position to fix the price. Any fish species, which is caught by the fishermen, finds consumers. So called trashfish does not exist. The major constraint hindering expansion of fish trading, is the limit on fish catches, not the inefficiency of the marketing network. Post harvest losses do not appear to be a major problem in the area. The present fish processing methods seem to be appropriate and the quality of the processed fish is obviously sufficient. Despite a lack of transport facilities and high transportation costs the sector attracts some 3000 fish traders and provides most of them with a cash income above the Malawian average.
Overfishing in the Lake Malombe area, where almost 50% of the traders operate, has depleted the Chambo stock. Kambuzi catch figures and an analysis of the Kambuzi catch composition show a declining trend for Kambuzi.
Restrictive measures on fishing effort are urgently needed. A package of recommendations for a new management plan for the traditional and industrial fishery will be provided by the Chambo Fisheries Research project. However, if implemented, the new regulations may on the short term reduce job opportunities for fish traders especially in the traditional sector of the fishery.
The semi-industrial and industrial sector (Maldeco) could partly absorbe those traders from the traditional sector, if they would change their policy of giving priority to large-scale wholesalers rather than to small-scale traders.
Alimoso, S., M.B.D. Seisay and N.P. van Zalinge. 1990 An efficient method for catch-effort sampling of the artisanal Chambo fisheries of the south-east arm of Lake Malawi, the Upper Shire River and Lake Malombe. GOM/UNDP/FAO Chambo Fisheries Research Project, Malawi. FI:DP/MLW/86/013, Field Document 6: 33p.
Mdaihli, M. and S. Donda. 1991a Fisherman entrepreneurs - a baseline survey. GOM/UNDP/FAO Chambo Fisheries Research Project, Malawi. FI:DP/MLW/86/013, Field Document 11: 65p.
Mdaihli, M. and S. Donda. 1991b The Role of women in the Chambo Fisheries of the south-east arm of Lake Malawi, the Upper Shire River and Lake Malombe. GOM/UNDP/FAO Chambo Fisheries Research Project, Malawi. FI:DP/MLW86/013, Field Document 13: 8p.
Stamatopoulos, C., 1991 MTF - Malawi Traditional Fisheries, Computer User Manual. GOM/UNDP/FAO Chambo Fisheries Research Project, Malawi. FI:DP/MLW/86/013, Field Document 7: 36p.
Van Zalinge, N.P, S.B. Alimoso, S.J. Donda, M. Mdaihli, M.B.D. Seisay and G.F. Turner. 1991 Preliminary note on the decline of Chambo catches in Lake Malombe. GOM/UNDP/FAO Chambo Fisheries Research Project. FI:DP/MLW/86/013, Field document 9: 7p.