Institute of Grassland and Environmental Research, Bronydd Mawr Research Station Trecastle, Brecon, Powys LD3 8RD, United Kingdom
ABSTRACT
An experiment was set up in 1994 to test the hypothesis that staggered sowing of white clover (Trifolium repens), creating a population of varied age structure, will ameliorate the clover decline experienced in the third year of a swards life. Three clover treatments were imposed on a newly sown sward of perennial ryegrass (Lolium perenne) cv. Magella namely: T1. 4 kg ha-1 clover seed sown in 1994, T2. 2 kg ha-1 clover seed sown in both 1994 and 1995 and T3. 4 kg ha-1 clover seed sown in 1995. There was an initial penalty in herbage production incurred by the late introduction of white clover into the swards. By 1996 T2 and T3 produced 84 and 74 percent of the herbage production of T1. However, no significant difference could be detected between the treatments during 1997. All three treatments sustained reductions in clover stolon abundance during 1997 with the declines ranking in severity T1>T2>T3. The individual clover plant measurements showed that the distribution of plant size, within white clover populations, could be manipulated by staggered sowings.
Keywords: Lolium, Trifolium, plant size, decline, production
INTRODUCTION
The white clover (Trifolium repens) content of mixed swards, subject to sheep grazing, often suffers a dramatic decline in the third year after sowing. These declines have been observed in different years, with different clover cultivars and with a range of companion grasses under varied grazing regimes (Fothergill et al., 1997b). In each case the young swards were characterized by very high clover contents. Detailed measurements of individual white clover plants within the swards indicated that plant size and complexity were at a minimum and plant number at a maximum just prior to the clover decline (Fothergill et al., 1997a). Subsequent declines may be less severe with the underlying plant population being more varied in terms of age and plant structure.
MATERIALS AND METHODS
The experiment was established in August 1994 at Bronydd Mawr Research Station (51°37'N, 03°38'W) at a height of 300 m above sea level. The soil was a brown earth of the Milford series overlying Devonian red sandstone and the site received an average annual rainfall of 1 500 mm with a mean screen temperature of 8°C. The area was initially sown with a single perennial ryegrass (Lolium perenne) cv. Magella at a seed rate of 30 kg ha-1. Nitrogen was applied to the seedbed at a rate of 25 kgN kg ha -1 and the swards received annual maintenance applications of P and K at rates of 25 kg ha-1 and 50 kg ha-1, respectively. Clover treatments were imposed incorporating white clover (Trifolium repens) cv. Menna into the sward in three different sowing regimes (Table 1). Each treatment was broadcast seeded, individual plots were 30 x 12 m and replicated four times within a randomized complete block design. Each block was fenced and grazed, by sheep, as a single unit. Light intermittent grazing took place in the autumn of the first year and thereafter the swards were maintained at a sward height of 4 cm throughout the growing season by regular adjustment of sheep numbers.
Dry-matter production was assessed from beneath exclusion cages during 1996-1997. Tiller density and stolon abundance of the sown species was assessed from twenty 5 cm diameter cores taken at random from each plot during the spring and autumn each year and clover plant number, size and structure determined from 25 x 25 cm quadrats taken in the spring and autumn 1997.
RESULTS
Establishment
Seedling counts and grass tiller numbers m-2 were assessed during the autumn of 1994 and 1995 and are presented in Table 2. Although increasing the open nature of the sward (42, 57 and 59 percent bare-ground for T1, T2 and T3, respectively), the method of introducing white clover into an already established grass sward (T1 and T2) did not create broad-leafed weed problems (mean values of 295 and 477 weed seedlings m-2 in 1994 and 1995, respectively).
Table 1. Treatments. Seed rate and time of sowing of white clover.
|
|
Year 1 |
Year 2 |
|
Treatment 1 (T1) |
4 kg ha-1 |
|
|
Treatment 2 (T2) |
2 kg ha-1 |
2 kg ha-1 |
|
Treatment 3 (T3) |
|
4 kg ha-1 |
Table 2. Establishment of sown species assessed in autumn 1994 and 1995 (tillers m-2 and seedlings m-2 for L. perenne and T. repens, respectively).
| |
1994 |
1995 |
||
|
L. perenne |
T. repens |
L. perenne |
T. repens |
|
|
T1 (94 sowing) |
1 764 |
504 |
9 849 |
0 |
|
T2 (94/95 sowing) |
1 192 |
187 |
7 750 |
262 |
|
T3 (1995 sowing) |
1 150 |
0 |
8 410 |
328 |
|
P |
NS |
<0.001 |
NS |
<0.001 |
|
LSD |
|
112.6 |
|
87.8 |
Table 3. Herbage DM production (kg ha-1) 1996-97.
|
|
1996 |
1997 |
|
T1 (94 sowing) |
11 062 |
13 144 |
|
T2 (94/95 sowing) |
9 356 |
13 255 |
|
T3 (1995 sowing) |
8 218 |
13 018 |
|
P |
<0.01 |
NS |
|
LSD |
1 168.1 |
|
Herbage production
Annual herbage DM production for 1996 and 1997 is presented in Table 3. Although Treatment 1 was significantly more productive than the other two treatments during 1996, the difference was particularly marked during the early spring samplings. By mid-summer 1996 the clover percentage was 30, 29 and 14 percent for T1, T2 and T3, respectively and as the season progressed the performance of the three treatments coalesced. No significant difference was detected in 1997.
Stolon abundance
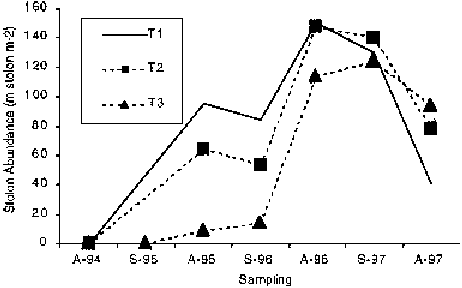
The white clover stolon abundance information for the period autumn 1994–autumn 1997 is presented in Figure 1 and charts the presence of white clover in the swards. T1 demonstrated a classic clover decline during the summer of 1997 whereas T2, did not decline to the same extent. T3, although exhibiting a slight decline during 1997, had the highest stolon abundance by the end of that year.
Figure 1. White clover stolon abundance (m stolon m-2) 1994-1997.

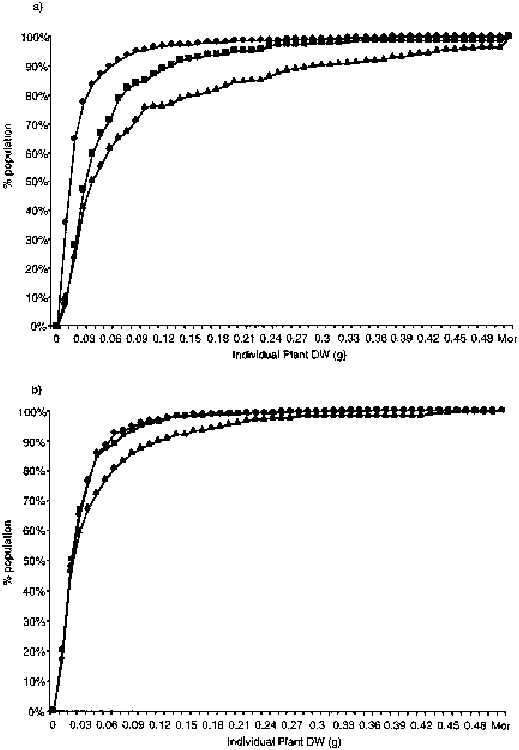
Figure 2. Cumulative % of the
population of individual white clover plants (DW increments of 0.01g) for a)
spring 1997 and b) autumn 1997 in T1
( ), T2
(
 ) and T3
(
 ).
).

Clover populations
Figures 2a and 2b present the individual white clover plant size information for 1997. In the spring of 1997 the three treatments possessed quite distinct population structures for plant size. T1 was dominated by a large proportion of small plants whilst T2 and T3 still possessed large plants within their population structure. The autumn data from the same year shows T1 and T2 to be almost identical in plant size distribution whilst T3 continued to maintain some large plants within its population.
DISCUSSION
The information presented in this paper shows that plant populations can be manipulated by employing a 'staggered sowing' technique. The experimental protocol successfully created the desired sward types. T1 and T3 had populations of white clover plants derived from single sowings of white clover in 1994 and 1995, respectively, whilst T2, through the combined sowing, produced two cohorts of white clover developing within the same plot. There was a clear penalty in terms of reduced annual herbage production with T2 only producing similar amounts of herbage to T1 by 1997. T1 exhibited a classic clover decline in 1997. Just prior to the decline the treatment was characterized by a very high stolon abundance which was dominated by extremely small individual plants. T2 and T3 still maintained some large plants within the white clover populations during 1997 and it remains to be seen if these marginal differences in distribution of plant size will avert the impending clover declines within these treatments.
REFERENCES
Fothergill, M., Davies, D.A. & Daniel, G.J. 1997a. Morphological dynamics and seedling recruitment in young swards of three contrasting cultivars of white clover (Trifolium repens) under continuous stocking with sheep. Journal of Agricultural Science, Cambridge, 128, 163-172.
Fothergill, M., Davies, D.A., Morgan, C.T. & Jones, J.R. 1997b. White Clover Crashes. In: Younie. D. (Ed). Legumes in Sustainable Farming Systems, Occasional Symposium of the British Grassland Society, No. 30, pp 172-1176.