![]()
![]()
![]()
SUMMARY
The potential forage production and UFL nutritive value of a mixed sward (sown with Lolium perenne, Lolium hybridum, Dactylis glomerata and Trifolium repens) under six cutting regimes and in the second year of production are reported. The cutting regimes consisted of simulated grazing (alone or alternating with silage cuts), cut and silage cuts. In a climatologically irregular year, the lowest forage production was found in the simulated grazing treatment and the highest one in that including only silage cuts. Those treatments alternating simulated grazing and silage cuts did not show significant differences in forage production. The UFL nutritive value of the forage exhibited similar trends, the lowest value (24 026 UFL ha-1) being obtained for the shortest cut intervals treatment (simulated grazing) and the highest one (28 936 UFL ha-1) for the longest cut intervals treatment (silage cuts). Intermediate treatments (alternating simulated grazing and silage cuts) resulted in similar UFL nutritive values.
Keywords: cutting regimes, forage production, forage quality, sward management, UFL nutritive value.
INTRODUCTION
In Galicia (NW Spain), grasslands represent 12.65 percent of the total surface and 40.96 percent of the cultivated lands (Xunta de Galicia, 1997). However, in areas with good characteristics for dairy cattle and low cost production forages, only 16.4 percent of the total milk production per animal is based on forages, far from the 40 percent which is nowadays considered the target (Barbeito, 1997). Therefore, an increase in forage use and/or production in the farms must be accomplished. Nitrogen fertilization and sward management are among the factors which may play a determinant role in the improvement of sward production and quality (Rodríguez-Julia, 1987).
In that context, a field experiment was carried out to study the effects of six cutting regimes on the potential forage production and quality of a mixed sward. Results obtained in the second year of the sward are reported in this work.
MATERIALS AND METHODS
The experiment was conducted at Monforte de Lemos (Galicia, NW Spain) and started in the autumn of 1995. The climate of the region is considered semi-continental with average annual rainfall of 801 mm, wide thermic amplitude (monthly mean 13-15ºC) and a season of drought generally not severe although variable from year to year. The soil was an umbric gleysol, developed from quaternary sediments and situated at 315 m altitude. Some characteristics of the cultivated soil are given in Table 1.
Thirty-six plots of 1.8 x 5 (9 m2) were established to achieve six cutting regimes (each with six replicates): 1. Simulated grazing (G); 2. Cut (C); 3. Simulated grazing - silage cut - simulated grazings (Gsg); 4. Simulated grazing - silage cuts (Gs); 5. Silage cut - simulated grazings (Sg); and 6. Silage cuts (S). Fertilizer inputs consisted of 154 kg P2O5 ha-1 and 198 kg K2O ha-1. Also 170 kg N ha-1 were applied as follows (according to the Spanish Royal Decree 261/1996 on water protection against contamination from nitrate of agronomic source): 30 kg after each simulated grazing, 40 after each cut (treatment two), 80 after the first silage cut and 60 after the second silage cut. The first nitrogen application was done on 17 February at a dose of 30 kg ha-1.
All plots were sown with 33 kg ha-1 of the following seed mixture: Lolium perenne cv.Verna 12 kg, Lolium hybridum cv. Ariki 9 kg, Dactylis glomerata cv. Cambria 9 kg and Trifolium repens cv. Huia 3 kg, the legume being previously inoculated with Rhizobium trifolii.
Grass height was measured with a graduated ruler. For simulated grazing, grass height was 15-18 cm (cut intervals of 21-30 days). For treatment two (cut), grass height was 20-25 cm (cut intervals of 28-37 days). Silage cuts were made at the beginning of the grass ear emergence (cut interval of six weeks).
Forage production was estimated by harvesting the central 1.2 x 5 m area of each plot to a height of 5 cm above ground level. Samples of 500-1 000 g were obtained from each plot for dry matter analysis and subsamples were taken to determine crude protein (CP) (standard Kjeldahl N x 6.25) and acid-detergent fibre (ADF) (Goering and Van Soest, 1970).
Table 1. Characteristics of the cultivated soil.
|
|
|
|
|
mg kg-1 |
|
||
|
Texture |
PH (H2O) |
OM% |
Extractable P1 |
K2 |
Ca2 |
Mg2 |
Al3 |
|
Silty clay loam |
5.43 |
4.85 |
22 |
0.46 |
6.34 |
0.9 |
9 |
1Olsen et al. (1954); 2extracted with NH4Ac 1N pH 7; 3 extracted with BaCl2 0.6N pH 7
Table 2. Analysis of variance of forage dry matter results.
|
|
G |
C |
Gsg |
Gs |
Sg |
S |
|
G |
-- |
* |
ns |
*** |
ns |
*** |
|
C |
* |
-- |
ns |
ns |
ns |
** |
|
Gsg |
ns |
ns |
-- |
* |
ns |
*** |
|
Gs |
*** |
* |
*** |
-- |
* |
* |
|
Sg |
ns |
ns |
ns |
ns |
-- |
*** |
|
S |
*** |
** |
*** |
* |
*** |
-- |
ns = non significant differences; *, ** and *** = significant differences for p< 0.05, 0.01 and 0.001, respectively.
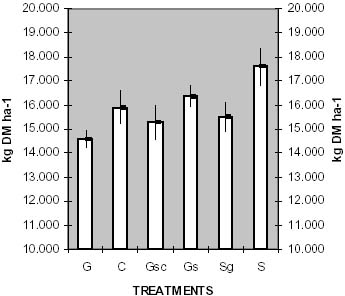
Figure 1. Mean+ standard error of the mean (n=6) of forage dry matter production in the different treatments.
These two parameters are enough to evaluate the sward quality for grazing or silage (González-Rodríguez, 1998) and can be related by a regression equation which calculates the UFL (forage unit for milk production) value. The UFL value estimates the grass energetic potential and has been calculated as suggested by the Centro de Investigaciones Agrarias de Mabegondo (CIAM, 1997) as follows: UFL = (1.58-0.0155ADF + 0.0227CP). In this work, results from the second year of sward production are presented.
RESULTS
Forage production increased with increasing cut intervals, the highest yield (17.6 t DM ha -1) being found when the cutting regime consisted of silage cuts only (treatment 6, cut interval of six weeks) (Figure 1). Treatments alternating simulated grazing and silage cuts did not show significant differences among them in forage production. The analysis of variance of forage dry matter results is presented in Table 2.
Table 3. Analysis of variance of UFL results.
|
|
G |
C |
Gsg |
Gs |
Sg |
S |
|
G |
-- |
ns |
ns |
** |
ns |
*** |
|
C |
ns |
-- |
ns |
ns |
ns |
*** |
|
Gsg |
ns |
ns |
-- |
ns |
ns |
*** |
|
Gs |
** |
ns |
ns |
-- |
ns |
* |
|
Sg |
ns |
ns |
ns |
* |
-- |
*** |
|
S |
*** |
*** |
*** |
* |
*** |
-- |
ns = non significant differences ; *, ** and *** = significant differences for p< 0.05, 0.01 and 0.001, respectively.
Figure 2. Mean+ standard error of the mean (n=6) of UFL values in the different treatments.
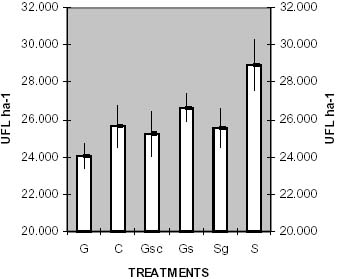
The most significant differences in UFL values were found between the simulated grazing treatment (with the shortest cut intervals) and treatment six which consisted of silage cuts only (and the longest cut intervals) (Figure 2). No significant differences in UFL values were found for treatments alternating simulated grazing and silage cuts. The analysis of variance of UFL results is shown in Table 3.
ACKNOWLEDGEMENTS
The authors thank the collaboration and support of the Servicio de Extensión Agraria de Galicia, Laboratorio Fitopatológico de Galicia and the students of the Escuela de Capacitación Agraria de Monforte (Spain).
REFERENCES
Barbeito, F. 1998. Manexo técnico y resultados económicos 1996. Ed. Consellería de Agricultura, Gandería e Politica Agroalimentaria, Xunta de Galicia. Santiago de Compostela (Spain).
González-Rodríguez, A. 1998. Manejo de la pradera de raigrás inglés y trébol blanco en primavera y uso de nitrógeno para el primer corte. En: Actas de la XXXVII Reunión Científica de la Sociedad Española para el estudio de los pastos. Ed. Servicio de Publicaciones e Intercambio Científico, Universidad de Valladolid (Spain), pp. 101-104.
Olsen, S.R., Cole, C.V., Watanabe, F.S. & Dean, L.A. 1954. Estimation of available phosphorus in soils by extraction with sodium bicarbonate. U.S. Department of Agriculture, Circular 939.
Rodríguez-Julia, M. 1987. Informes Técnicos nº3. Ed. Dpto. de Agricultura y Pesca del Gobierno Vasco. S.I.M.A, Derio, Vizcaya (Spain).
Xunta de Galicia. 1997. Anuario de Estadística Agraria-1995. Ed. Consellería de Agricultura, Gandería e Montes, Xunta de Galicia. Santiago de Compostela (Spain).
Xunta de Galicia. 1998. Manexo técnico y resultados económicos 1996. Ed. Consellería de Agricultura, Gandería e Politica Agroalimentaria, Xunta de Galicia. Santiago de Compostela (Spain).
|
[39] Escuela de
Capacitación Agraria, apdo. 23, E-27400 Monforte de Lemos, Lugo
(Spain) [40] Departamento de Producción Vegetal, Facultad de Veterinaria, Universidad de Santiago de Compostela, E-27002 Lugo (España) |
![]()
![]()
![]()