![]()
![]()
![]()
Table 3 : Specific Fuel Consumption
| Stove A | Stove B | Stove C | Stove D | |
| SCF based on Salt Yield | 2.332 | 2.304 | 2.678 | 1.859 |
| SCFbasedon Water Evaporated | 0.645 | 0.626 | 0.566 | 0.549 |
How about the time required to reach the boiling point and the speed with which this is reached ? The data shows (Table 4) that stove C (29 minutes) reached the boiling point fastest. Stoves C & D, however consumed more fuel than stoves A & B to reach the boiling stage. Stove B reached the boiling point the slowest (55 minutes). When the worker tending stove B tried to increase the fire to the same intensity as stove C, lots of smoke developed and the air flow was impeded. However, stoves C & D, consumed more fuel to reach boiling stage. Although it took a long time for stove B to reach the boiling point, it consumed the least fuel.
 |  |
| Snow white salt from cooked salt method | Packaged salt, ready to the market |
Table 4 : Average time consumed to boil and Average fuel consumption up to boiling point
| Stove A | Stove B | Stove C | Stove D | |||||
| Time consumed to boil | 45.5 min | 55 min | 29 min | 31 min | ||||
| Fuel consumption up to boiling point | 34.7 | 29.8 | 39.2 | 38.8 |
In theory, the degree of salt recovery depends on the concentration of salt. In table 5, stoves C & D have higher salt recovery based on the amount of salt water evaporated.
Table 5 : Percentage salt yield based on the amount of water evaporated
| Stove A | Stove B | Stove C | Stove D | |||||
| Salt yield/Amount of water evaporated | 27.70% | 27.23% | 32.11% | 29.56% |
There are 2 possible explanations for this. One, it is customary for the cook/worker who tends stove C & D to refill the pans prior to complete evaporation. The residual fluid increases the concentration of salt in the additional solution pans. Hence, this will result to a little bit higher concentration. This explanation is likely because at the beginning of the study all of the pans had the same concentration of salt. However, in successive trials the concentration was not measured because all of the stoves used the same number of bags of salt. Secondly, the coarse salt used in C & D may have had a higher concentration as it came from the Philippines while the salt used in A & B came from India. Also the worker tending stove C & D may have added a little less water. By the time this discrepancy was noticed they had run out of salt from India, such that a detailed analysis was not possible. Based on preliminary rate results, stoves C & D were thought to be more efficient.
C. Percentage Heat Utilization, Power Output and Burning Rate
The stove efficiency (PHU) was computed using the following formula and constants;

a. Heat Energy Output = Mw × Cp (Tb-Ti) + Me × L
| Where: | |
| Mw | = Initial amount of water in the pan (kg) |
| Cp | = Specific heat of water (kJ/kg/C) |
| Tb=Boiling temperature of water (C) | |
| Ti | = Initial temperature of water in the pan (C) |
| Me | = Amount of water evaporated (kg) |
| L | = Latent heat of water evaporation at atmospheric pressure and 100 C (kJ/kg) |
b. Heat Energy Input = Mf × Ef
| Where: | |
| Mf | = amount of fuel burnt (kg) |
| Ef | = calorific value of fuel used (kJ/kg) |
| Values for various quantities used: | |
| Cp | = 4.2 kJ/kg/ C |
| L | = 2256.9 kJ/kg |
| Ef | = 15,000 kJ/kg |
| The Specific Power Output is computed using the following formula: | |
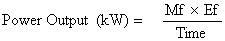 | |
| Burning rate = Salt Yield/time | |
| The Burning Rate was taken based on salt yield and based on the amount of water evaporated. | |
The results of the computations are presented in table 6 at the following page.
Table 7 shows that stoves C (30.5%) and D (31.09%) have a higher percentage heat utilization or thermal efficiency than stoves A (22.65%) and B (27.35%). Visual inspection construction revealed that C & D, have stronger updraft due to the tunnel design described earlier. Thus A & B expel darker smoke from their chimneys, especially when the fire is intensified. Stoves C & D also used fuel and produce more power than stoves A & B.
Table 7 : Percentage Heat Utilization & Power output
| Stove A | Stove B | Stove C | Stove D | |
| PHU (Thermal Efficiency) | 22.65 | 27.35 | 30.50 | 31.09 |
| Power Output (kw) | 149.6 | 142.6 | 177.9 | 193.8 |
Another factor which contributes to the efficiency of stoves C & D is the position of their grate. The grates slope down to the middle part allowing the heat to be distributed across the surface of the pan. In A & B, the fire hits the end of the pan near the fuel hopper because the grates are placed below the end of the pan.
Table 8 : Average burning rate based on salt yield and evaporation
| Stove A | Stove B | Stove C | Stove D | |
| Burning Rate | 0.26 | 0.24 | 0.40 | 0.42 |
| Evaporation Rate | 0.92 | 0.91 | 1.26 | 1.41 |
3.5. Economic Analysis
Production Cost and Revenues
Assumptions :
Table 6 : Computation results on Specific Fuel Consumption (SCF), Percentage Heat Utilization (PHU), Power Output & Burning Rate
| Stove A/R ep1 | Stove A/R ep2 | Stove B/R ep1 | Stove B/R ep2 | Stove C/R ep1 | Stove C/R ep2 | Stove D/R ep1 | Stove D/R ep2 | |||||||||
| SFC based on salt yield | 2.204 | 2.459 | 2.478 | 2.131 | 1.832 | 1.692 | 1.889 | 1.832 | ||||||||
| SFC based on water evaporated | 0.624 | 0.666 | 0.658 | 0.595 | 0.603 | 0.530 | 0.548 | 0.550 | ||||||||
| PHU (Thermal Efficiency) | 27.30 | 25.70 | 25.90 | 28.80 | 28.80 | 32.19 | 31.18 | 31.00 | ||||||||
| Power output (kw) | 147.2 | 152.0 | 149.3 | 135.8 | 189.4 | 166.4 | 205.6 | 182.0 | ||||||||
| Burning rate (kg/min)=Salt yield/time | 0.27 | 0.25 | 0.24 | 0.25 | 0.41 | 0.39 | 0.44 | 0.40 | ||||||||
| Evaporation rate (kg/min) | 0.94 | 0.91 | 0.91 | 0.91 | 1.26 | 1.26 | 1.50 | 1.32 | ||||||||
Note: Variable cost and revenue is computed based on per load basis; additional information is located in the following income statement.
| 1. | Capital Input | |||||
| 1.1. | Houses are made of wooden posts, coco lumber beams, thrushes and purling. | |||||
| Roofs are made of cogon grass. Floor dimensions : 4m × 3.5m (life span: 8 years; roofing: 4 years) | = | P | 8,000 | |||
| 1.2. | 2 stoves and 4 pans | |||||
| - | 4 gauge 18 G.I. flat sheet (4 × 8m/pc.) 4 × P 560/pc + (P140 labor in pan construction × 4 pans) | = | P | 2,800 | ||
| - | stove body materials including chimney and labor cost based on straight contract from stove constructors (P4,500/stove × 2 stoves) | = | P | 9,000 | ||
| 1.3. | Dissolving tank (2m × 1.5 m × 1m) | = | P | 1,800 | ||
| 1.4. | Cooking utensils (baskets, dirt scoop, etc) | = | P | 600 | ||
| P | 22,200 | |||||
| 2. | Variable Costs | |||||
| 2.1. | Coarse salt (P120/bag × 3.3 bags/loads for 2 stoves or 4 pans) | = | P | 396 | ||
| 2.2. | Fuel cost Labor in sacking rice hull (PO.50/sack × 22 sacks/stove × 2 stoves) | = | P | 22 | ||
| Fuel delivery (P100/small truckload/ 96 sacks = P 1.05/sack × 44 sacks) | = | P | 46 | |||
| 2.3. | Labor cost (P 35/load × 2 stoves) | = | P | 70 | ||
| 2.4. | Sacks (P 6/sack × 4 sacks) | = | P | 24 | ||
| 2.5. | Freight cost for marketing (P 7/sack × 4 sacks) | = | P | 28 | ||
| P | 586 | |||||
| 3. | Revenue | |||||
| 4 sacks × P250/sack | = | P | 1,000 | |||
| Income Statement | ||||||
| 1. | Gross revenue/month 3 loads/day × 2 sacks/stove/load × 2 stoves (25 days/month × P 250 /sack) | = | P | 62,500 | ||
| 2. | Operating expenses P 586/load for 2 stoves (2.5 loads/day × 25 days) | = | P | 36,625 | ||
| Net Income before depreciation of capital input | = | P | 25,875 | |||
IV. CONCLUSIONS AND RECOMMENDATIONS
Although data on fuel cost and efficiency of fuelwood salt stoves were not collected, rice hulls fed salt stoves are far more profitable because of the very minimal cost of fuel. Fuel accounts for only 11.6% of the total variable cost. Moreover, rice hulls are an agricultural by-product and their utilization reduces a possible source of pollution. By comparison, wood cutting for fuel in industrial stoves enhances deforestation, erosion, and environmental degradation.
The rice hull fed stoves used in salt making are generally highly efficient. They have a range of 25.7 % to 32.19 % percentage heat utilization (PHU) compared to other rice hull stoves which have 15–18 % efficiency (as reported in the literature). However, the PHU presented is abnormally high. This could be explained by the test conditions: the data were measured when the stove body was already hot. The temperature of the water when poured into the pan is 30–32° C. It takes some time for the cook to haul the fuel to the stove and fill the pans. By the time they start firing, the water temperature is already 38–43° C because of the residual heat from the previous cooking. However, we decided to take data then because residual heat was the usual condition. Before the cooks retire late at night they fire the stove first so that it is very warm in the early morning of the following day. So, the stove is almost continuously fired for 6 days a week. The actual efficiency of the stove could not be assessed from a cold condition which is present only at the start of the week.
Proper pans which are mounted in a level fashion will contain more solution and thus provide a higher salt yield. With the 3 loads per day of 12 – 16 hours of work per day, the additional salt yield makes the enterprise significantly more profitable.
Based on the computation of the PHU, the Specific Fuel Consumption, Power Output, Burning Rate and Time Consumed till Salt Harvest, this study concludes that stoves C & D are superior to stoves A & B. The main difference is in the design of the channel going to the chimney. In stoves C & D, the bottom of the channel inclines upward creating an updraft. Secondly, from the top view, the channel widens after coming from the rectangular body of the stove and tapers towards the chimney. This creates a higher air draught adapted to intense firing for quick cooking. In contrast to stoves A & B, the neck channel going into the chimney is straight and of the same size as the chimney. In stoves C & D, the grates also have a wider surface area over which to heat the pan. In the case of A & B, the intense fire heats the end of the pan near the fuel hopper, and has a lower surface area contact. If the pan is fired more intensely, there is a tendency for the water being boiled to spill.
It is therefore recommended that:
Information drives should be done to encourage salt makers using wood as fuel to shift to rice hulls where-ever rice hulls are available.
Technical information should be made available for existing rice hull stoves emphasizing the importance of proper mounting of pans, the position of the grate, the influence of tunnel design on air draught strength, and the modification of fuel hoppers which include control valves to make the feeding of fuel less laborious.
Environmental controls should also be legislated for rice hull ash disposal. Information should be disseminated on the value of rice hull ash in compost making and as soil conditioner in its ash form. It is highly effective in improving soil structure as already demonstrated by the author of this study.
Finally, this study is preliminary and merits follow-up research.□
Hil J. Padilla
AGTALON
2430, Pangasinan
Philippines
I. BACKGROUND
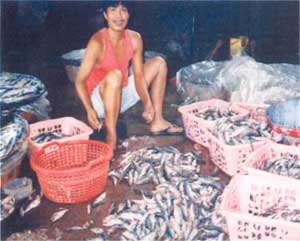
“Galunggong”, a variety of mackerel fish, is one of the cheapest fish items in the Philippines. It is widely available and is the staple fish for poor Filipino families. It was not surprising then that the famous president of the Philippines, Corazon Aquino, made the price of “galunggong” the indicator for her economic program of improving the plight of the poor. Galunggong is the main variety used for smoked fish making since it is the most affordable and hence, the most marketable.
This study was conducted in a town where there are approximately 28 “tinapahan” or smoked fish processing centers. They process an average of 16 “banyeras” daily per processing center with 50 kg of fish per “banyera” or vat. This means around 22.4 tons of fish are processed daily. One processing center employs an average of 15 workers in addition to the owners who intermittently participate in the work or act as supervisors and administrators. The industry also includes wholesale traders and retailers of smoked fish and fresh fish traders. So, one can imagine the employment benefits derived from this particular industry.
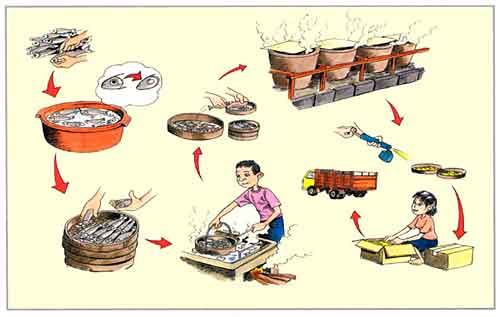
Smoked fish making flow diagram
Smoking preserves the fish. Fisher folks prize this industry because it provides them with market even during times when there is high volume of catch resulting in an oversupply of fish. Smoked fish enables households in remote places who have no refrigerator nor a means of storing or preserving fish to stock fish for some time without spoilage.
The processing of smoked fish utilizes sawdust and sugar cane “bagasse” (waste from sugarcane mills) as fuel, and thus helps in the properly dispose and manage wastes from other local industries.
However, some people resist eating smoked fish because of reports that it causes cancer. Also, some manufacturers use formalin to increase the shelf life of the fish. There has been consumer concern about the high dosage of formalin used in fish processing.
Moreover, the processing centers which are situated in residential areas are too smelly and are the subject of complaints in the community. Fish entrails which are not currently utilized as feed for animals compound the pollution problem.
The stoves used, although much improved from the open type of stoves, are still very inefficient and could still be improved further. The area, where fish are smoked, is also naturally too smoky for the workers.
II. THE STOVE
2.1. The Design of Stove
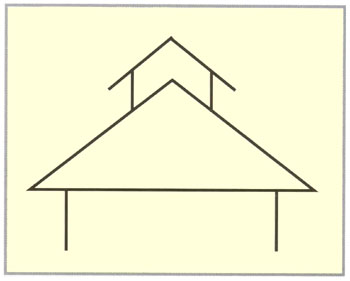
The stove used for fish processing was developed in response to problems with the open type of stove. The open flame stove made the cooking area too hot for the cook, consumed a lot of fuel, and was viewed as unstable and therefore unsafe. Modifications include the addition of a chimney reduce smoke exposure, the enclosure of the firebox to reduce excess heat, and the construction of a concrete stove body which is more stable. A second pot hole was also added to the new design.
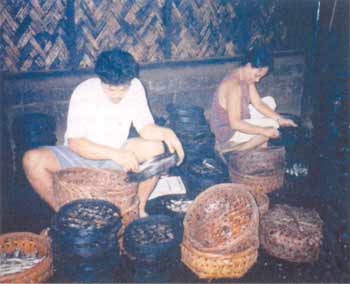
The workers are preparing the baskets for the smoking process
Typical stove used for smoked fish processing
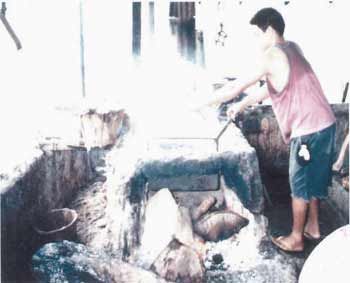
The cooking stoves are made from cement and iron bars as reinforcements (as in building constructions). Concrete masons that are available locally are hired for the job. Clay is not feasible, since there is a high amount of water dripping from the boiled fish which would erode the stove body. Fired clay is not also feasible since the stove body is too big to be fired.
Very few processors line the stove walls with clay bricks. However, the lining could improve the stove's efficiency
The bottom of the stove is made of earth. Usually, the chimney is made of B.I. pipe or fired clay. However, these materials are not durable. Concrete blocks could be used instead.
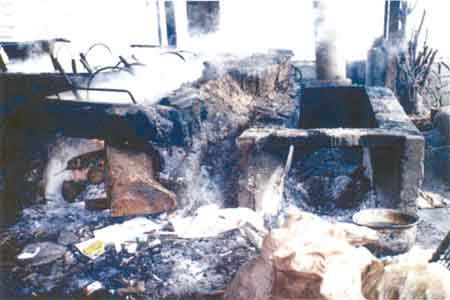
2.2. Problem With the Stove
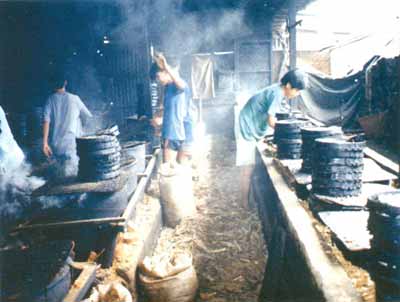
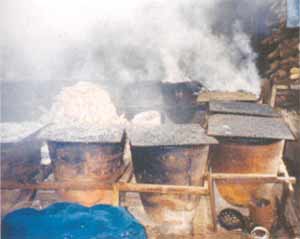
The main problem with the “tinapahan” cooking stove is the high amount of fuel consumption as seen from the enclosed pictures. A lot of heat comes out of the firebox entrance. This heat makes the working condition very uncomfortable. The workers said that they have to change their shirts 5–6 times daily because their shirts become quickly saturated with sweat. Since the workers are paid by their work output, they create a very intense, hot fire to bring the water to a boil as fast as possible.
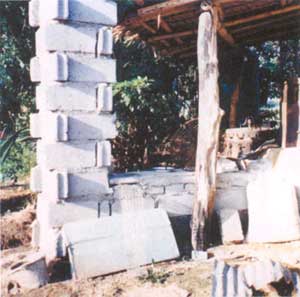
The concrete block chimney
The problem stems from the very wide firebox entrance and the small diameter of the chimney which reduces the draft. Actually, the chimney of the stove studied, which is made of metal, was worn out and has been removed. Chimney durability could be improved by using concrete blocks for its construction as in the photo beside.
They used the “banyera” made of flat metal sheet as a cooking pot or vat. The pots were installed with only the bottom exposed to the flame. The sides of the pot are in contact with the stove body. Heat transfer to the pot could be increased by hanging the pots by the rim only and thereby increasing the surface area in direct contact with the flame. A recent innovation is the use of a long cooking pan made of 16 gauge stainless steel. Since it is long (with no spaces in between), they could cook more. It also has higher rate of heat transfer. However, it costs more at P4,000 per unit as compared with a banyera which costs only P240 for 2 pots.
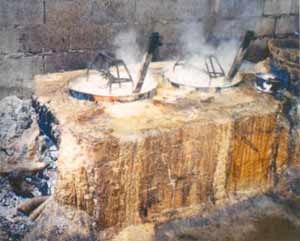
An improved stove, with enclosed firebox and chimney
2.3. The Smoking Vats
The smoking vat is made of ceramic. It is shaped like a big pot with iron bars put across the top from which small baskets of fish are hung.
The smoking vat is filled with burning charcoal taken from the other stove (stove for boiling). On top of the charcoal they put sugar cane bagasse and saw dust to generate smoke. The baskets of fish are then loaded into the smoking vat and covered with plywood.
2.4. Main Problem With the Smoking Vat
The main problem with the smoking vats is the very, very large amount of smoke created. Prolonged cooking for 10 – 14 hours can render the cook partially or temporary blind. This could be alleviated by installing smoke hoods on top of the smoking vats to draw out the smoke. The building's roofing should also have exhaust baffles as pictured below.
The second problem is the poor durability of the smoking vats which are made of ceramic. They very expensive now (P 800–1200 per piece). An alternative which is now being used by other processing units are vats made of concrete. They are cheaper and more durable.
III. FUEL USED
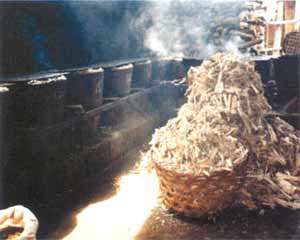
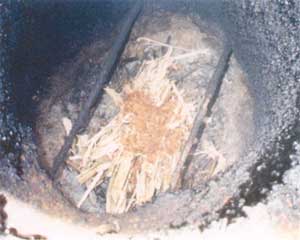
The fuel used for boiling fish is wood. One jeep load of fuel which is 5 m3, costs P1,200 (if delivered). Big trunks, 4 to 12 inches in diameter and 1 meter long, are used. This may explain why the firebox entrance of the stoves is so wide. Wood is preferred over rice hulls as fuel for 2 reasons: a) the charcoal from woodfuel can be used as a fire source for smoking; and b) wood produces less ash and hence creates less of a waste disposal problem. The wood consumption is 10 m3 per month.
 |  |
| The ceramic smoking pots | Exhaust baffles at the buliding's roof |
 |  |
| Sugarcane bagasse and sawdust used to generate smoke | The bagasse are chopped into 6 inches before loaded to the smoking pot |
The fuel used in smoking is sugarcane bagasse and sawdust. Sawdust costs P4 per sack. Sugarcane bagasse (waste from sugarcane mills) costs P1,000 per jeep load which is estimed to be around 5 m3. It is chopped into 6 inch lengths. One jeep load of sugar cane bagasse is consumed per month
IV. STOVE EFFICIENCY
The stove efficiency (Percentage Heat Utilization) was computed using the following formula and constants;

| a. | Heat Energy Output = Mw × Cp (Tb - Ti) + Me × L | |
| Mw | = Initial amount of water in the pot (kg) | |
| Cp | = Specific heat of water (kJ/kg/C) | |
| Tb | = Boiling temperature of water (C) | |
| Ti | = Initial temperature of water in the pot (C) | |
| Me | = Amount of water evaporated | |
| L | = Latent heat of water evaporation at atmospheric pressure and 100 C (kJ/kg) | |
| b. | Heat Energy Input = Mf × Ef | |
| Mf | = amount of fuel burnt | |
| Ef | = calorific value of fuel used (kJ/kg) | |
| Values for various quantities used: | ||
| Cp | = 4.2 kJ/kg/C | |
| L | = 2256.9 kJ/kg | |
| Ef | = 19.883 kJ/kg | |
4.1. Test Results and Computations for Smoke Fish Making Stove:
Test conditions:
Test results:
| Mw | = | 60 kg |
| Me | = | 33.4 kg |
| Mf | = | 29 kg (note: the amount of charcoal remaining has been subtracted using 4.8 : 7.0 of wood to charcoal) |
| Tb | = | 100° C |
| Ti | = | 31° C |
Computation:

The results of the computations show that the stove used in smoked fish making is quite inefficient. By comparison, an improved wood fuel cookstove used in mushroom spawn making was also tested.
Note: The efficiency of the smoking vats was not tested for practical reasons: a) one could not conduct water boiling test; b) the amount of fuel consumption is not very significant.
4.2 Test Results and Computation for Mushroom Spawn Stove:
Test Condition:
Test Results:
| Mw | = 30 kg |
| Me | = 12.85 kg |
| Tb | = 100°C |
| Ti | = 29°C |
| Mf | = 7.97 kg (remaining charcoal has been subtracted from initial fuel as before) |
Computation:

The stove for mushroom spawn production, even with only one pot hole, is more efficient than the stove used for smoking fish. The reasons for the higher efficiency are as follows;
THE PRODUCTION PROCESS OF TINAPA OR SMOKED FISH
 | 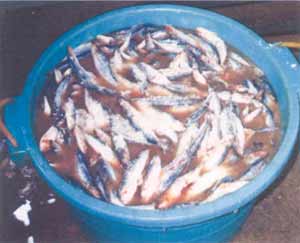 |
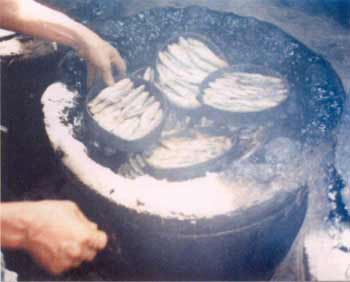
1. The fish are thoroughly cleaned. If fresh, the fish entrails are left intact. If not, the entrails are removed. | 2. The fish are soaked in brine solution (1 part salt + 2 parts water) until the eyes of the fish become white. This takes approximately 30 minutes. |
 |  |
3. The fish are then arranged in a bigger basket used for cooking. Weights are put on top of the basket so the fish won't float during cooking | 4. The fish are boiled in the brine solution for 5 minutes if the water is already boiling. After every 100 kg, 4 liters water and 2 liters of salt are added to the brine cooking solution. |
 |  |
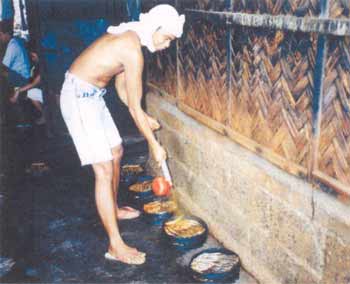
5. A smaller basket is used to hold 10–12 pieces of fish for the smoking process. | 6. The baskets loaded with fish go to the smoking area. The smoking vat is filled with burning charcoal from the stove boiler topped with sugar cane bagasse and sawdust to generate smoke. The baskets are then loaded into the smoking vat and covered with plywood. |
 | 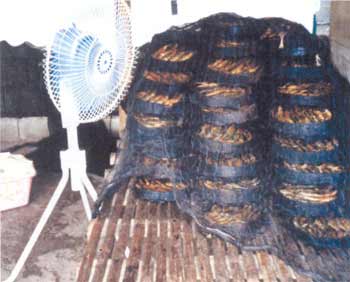 |
7. After smoking for about 30 minutes, the smoked fish is sprayed with yellow food coloring depending on the preference of the customers. If the customer does not like food coloring then thissteped. | 8. The smoked fish is aired to cool off before packing. If packed while still hot, fungus will be produced. |
V. ECONOMIC ASPECTS
5.1 Cost of Stove
The cost of construction was P 4,200; consist of:
| - chimney | = P 700 |
| - stove body (cement + iron bars + sand) | = P 2,275 |
| - labor | = P 1,225 |
| P 4,200 |
5.2 Durability
The stove was already 5 years old and still workable except for the B.I. pipe chimney which wore out after 4 years.
5.3. Economic Efficiency
| 1. | Capital Input | |||||
| 1.1 | Building made of wooden posts, G.I. sheet roofing, and cement flooring | |||||
| (floor area = 7 × 14 m) | = | P | 85,000 | |||
| 1.2 | Stove | = | P | 5,000 | ||
| 1.3 | Smoking vats (25 pcs × P900) | = | P | 22,500 | ||
| 1.4 | Baskets (P14/basket × 300 pcs) | = | P | 4,200 | ||
| 1.5 | Lawanit board cover for smoking vats (8pcs×P400/pc) | = | P | 3,200 | ||
| 1.6 | Stainless cooking pan | = | P | 4,000 | ||
| 1.7 | Basins and buckets (30 pcs × P 95/pc) | = | P | 2,850 | ||
| P | 126,750 | |||||
| 2. | Variable Costs | |||||
Note: The costs will be computed based on 10 banyeras = to 500 kg, then this will later be multiplied by the production rate for easier computation. | ||||||
| 2.1 | Cost of fish based on yearly average Price range - P 500 – P 1,500 per 50 kg (P 900 × 10 banyeras) | = | P | 9,000 | ||
| 2.2 | Labor | |||||
| - fish cleaner | = | P | 10/bya | |||
| - arranging in big basket | = | P | 10/bya | |||
| - cooking | = | P | 12/bya | |||
| - arranging in smoking basket | = | P | 10/bya | |||
| - smoking | = | P | 12/bya | |||
| - coloring | = | P | 10/bya | |||
| - drying/cooling | = | P | 10/bya | |||
| - packing P 10/bya (P 84/bya × 10 bya) | = | P | 840 | |||
| 2.3 | Woodfuel (.4 m3/10 bya) (P 240/m3 × .4) | = | P | 96 | ||
| 2.4 | Smoking fuel (.2 m3/10 bya) (P 200/m3 × .2) | = | P | 40 | ||
| 2.5 | Salt (P 5/bya ×10) | = | P | 50 | ||
| 2.6 | Packing materials (P 25/bya) | = | P | 250 | ||
| 2.7 | Utilities (water and electricity) | = | P | 40 | ||
| 2.8 | Food for laborers (P 18/meal × 17 laborers × 2 meals) | = | P | 612 | ||
| P | 1,928 | |||||
Note: Based on the calculations and experiences of the manager, he spends P200/banyera which comes close to the estimate above. The manager provides free meals to the workers as an added benefit. Usually, 2 meals are provided per day including snacks. But if they work overtime, they will be provided with 3 meals per day. The household of the manager does the cooking. | ||||||
| 3. | Revenue 150 baskets/banyera × P 10/bya × 10 banyera | = | P | 15,000 | ||
| 4. | Income Statement | |||||
| 4.1 | Gross revenue/ 10 banyera | = | P | 15,000 | ||
| 4.2 | Operating Expenses | = | P | 10,928 | ||
| Net income before capital depreciation | = | P | 4,072 | |||
Since they are processing 15 banyeras per day, the income of the manager comes to P 6, 108 daily.
VI. CONCLUSIONS AND RECOMMENDATIONS
The main problems in the smoked fish making industry are as follows:
The inefficient stove (16% PHU), which results in high fuel consumption and very hot working conditions.
The pollution caused by the high amount of smoke from the smoking vats and the cooking stove.
The durability of the smoking vats made of ceramic material.
The unsanitary condition of the processing centers. There are so many files that when one sees the production site, one would rather not eat the smoked fish. Although, the production site under study has good sanitation, there is still much to be desired for the majority of the entrepreneurs.
There is a lack of technical support for or access to information on alternative cookstoves and cooking techniques.
Our recommendations are as follows:
On Stove Efficiency
Install chimney made of concrete blocks because it is the most durable, easiest to construct and most cost effective.
The firebox entrance should be made narrower, or follow the design of the silkalan which registered an efficiency of 24%. The silkalan style also reduced the heat emanating from the firebox entrance which made the working environment more comfortable (please see attached photos on the next page). The attached Pogbi stove design could also be adopted.
The use of long, stainless steel cooking pans instead of the 2 round pots. The long pan, cooks more fish and produces greater surface area exposure to the flame. The stainless pot is more durable because it doesn't rust. In the long run, if the durability is considered it is cheaper.
The grate should be positioned in such a way that the flame heats the middle of the pan rather than the end of the pan. This allows more surface area for heat transfer with the higher intensity flame. Secondly, it will prevent spillage due to the turbulent boiling at the end part of the pan.
Baffles and dampers should be installed.
The inside walls should also be lined with ceramic bricks to increase heat insulation.
On Pollution
The installation of a smoke hood extractor above the smoking vats.
The installation of a chimney that goes up above the roof in the cooking stove.
The roof in the working area should be constructed in such a way that smoke can escape.
On Smoking Vat Durability
The use of concrete instead of ceramic vats should be promoted.
On Sanitation
Installation of screens in the walls of the building to prevent flies from coming in.
Utilization of fish entrails as feed for animals to solve waste disposal and avoid attracting flies. Stricter sanitation monitoring by the municipal government.
Others
The introduction of the commercial GLM smokehouse and dryer should be assessed. □
![]()
![]()
![]()