1. Abakada, A.O. and Hussain, M.A. (1980). Nutritional status and dietary intake of lactating Yoruba mothers in Nigeria. Ecology of Food and Nutrition, 10, 105–111.
2. Banerjee, B. and Saha, N. (1972). Energy intake and expenditure of Indian schoolboys. British Journal of Nutrition, 27, 483–490.
3. Bingham, s., McNeil, N.I. and Cummings, J.H. (1981). The diet of individuals: a study of a randomly-chosen cross section of British adults in a Cambridgeshire village. British Journal of Nutrition, 45, 23–35.
4. Black, A.E., Billewicz, W.Z. and Thomson, A.M. (1976). The diets of pre-school children in Newcastle upon Tyne, 1968–71. British Journal of Nutrition, 35, 105–113.
5. Blackburn, M.L. and Calloway, F.H. (1974). Energy expenditure of pregnant adolescents. Journal of the American Dietetic Association, 65, 24–30.
6. Blackburn, M.W. and Calloway, D.H. (1976). Energy expenditure and consumption of mature, pregnant and lactating woman. Journal of The American Dietetic Association, 69, 29–37.
7. Bleiberg, F. M., Brun, T.A. and Goihman, S. (1980). Duration of activities and energy expenditure of female farmers in dry and rainy seasons in Upper-Volta. British Journal of Nutrition, 43, 71–82.
8. Bleiberg, F., Brun, T.A., Goihman, S. and Lippman, D. (1981). Food intake and energy expenditure of male and female farmers from Upper-Volta. British Journal of Nutrition, 45, 505–515.
9. Boggio, V., Surville, J. M., Fuchs, Malval, M. et Klepping, J. (1980). Le profil alimentaire de l'enfant scolarisé de 5 à6 ans. Cahiers de Nutrition et Diétetique, 15, 2, 87–94.
10. Brun, T.A., Geissler, C.A., Mirbagheri, I., Hormozdiary, H., Bastani, J. and Hedayat, H. (1979). The energy expenditure of Iranian agricultural workers. The American Journal of Clinical Nutrition, 32, 2154–2161.
11. Brun, T., Bleiberg, F. and Goihman, S. (1981). Energy expenditure of male farmers in dry and rainy seasons in Upper-Volta. British Journal of Nutrition, 45, 67–75.
12. Cook, J., Altman, D.G., Jacoby, A. and Holland, W.W. (1975). The contribution made by school milk to the nutrition of primary schoolchildren. British Journal of Nutrition, 34, 91–103.
13. Chandrapanond, A., Ratchatasilpin, A. and Tansuphasiri, S. (1972). bis Dietary survey of preschool children and expectant women in Soonghern District, Nakorn Rajsima Province, Thailand. The American Journal of Clinical Nutrition, 25, 730–735.
13. Crawford, P.B., Hankim, J.H. and Huenemann, R.L. (1978). Environmental factors associated with preschool obesity. Journal of The American Dietetic Association, 72, 589–596.
14. Crowdy, J.P., Consolazio, C.F., Forbes, A.L., Haisman, M.F. and Worsley, D.E. (1981). The metabolic effect of a restricted food intake on men working in a tropical environment. Journal of Human Nutrition (in press.).
15. Crumrine, J.L. and Fryer, B.A. (1970). Protein components of blood and dietary intake of preschool children. Journal of The American Dietetic Association, 57, 509–512.
16. Darke, S.J., Disselduff, M.M. and Try, G.P. (1980). Frequency distribution of mean daily intakes of food energy and selected nutrients obtained during nutrition surveys of different groups of people in Great Britain between 1968 and 1971. British Journal of Nutrition, 44, 243–252.
17. Devadas, R.P., Sakthivelmani, A. and Kaveri, R. (1979). Nutritional profile of selected adolescent and adult women athletes. The Indian Journal of Nutrition and Dietetics, 16, 435–439.
18. Durnin, J.V.G.A., Lonergan, M.E., Good, J. and Ewan, A. (1974). A cross-sectional nutritional and anthropometric study, with an interval of 7 years, on 611 young adolescent schoolchildren. British Journal of Nutrition, 32, 169–179.
19. Edholm, O.G., Adam, J.M., Healy, M.J.R., Wolff, H.S., Goldsmith, R. and Best, T.W. (1970). Food intake and energy expenditure of army recruits. British Journal of Nutrition, 24, 1091–1107.
20. Edholm, O.G., Humphrey, S., Lourie, J.A., Tredre, B.E. and Brotherhood, J. (1973). VI. Energy expenditure and climatic exposure of Yemenite and Kurdish Jews in Israel. Philosophical Transaction of Royal Society London B, 266, 127–140.
21. FAO/WHO (1973). Energy and protein requirements. World Health Organization Technical Report Series No. 522. Geneva, Switzerland.
22. Ferro-Luzzi, A. and D'Amicis, A. The energy expenditure of rural school-age children in southern Italy (in preparation).
23. Ferro-Luzzi, A., Iacono, J.M., Dougherty, R.M. and Peltonen, R. Pilot epidemiological study in thrombosis. The diets of middleage farmers in Italy, Finland and U.S.A. (in preparation).
24. Ferro-Luzzi, A., Norgan, N.G. and Durnin, J.V.G.A. (1975). Food intake, its relationship to body weight and age, and its apparent nutritional adequacy in New Guinean children. The American Journal of Clinical Nutrition, 28, 1443–1453.
25. Fidanza, F. and Fidanza Alberti, A. (1975). Food and nutrient consumption of two rural population groups of Italy followed for ten years. Nutrition and metabolism, 18, 176–189.
26. Fleisch, A. (1951). Lé métabolisme basal standard et sa détermination au moyen du “métabo calculator”. Helvetica medica Acta, 18, 23–44.
27. Fryer, B.A., Lamkin, G.H., Vivian, V.M., Eppright, E.S. and Fox, H.M. (1971). Diets of preschool children in the North Central Region. Journal of The American Dietetic Association, 59, 228–232.
28. Gebre-Medhin, M. and Gobezie, A. (1975). Dietary intake in the third trimester of pregnancy and birth weight of offspring among nonprivileged and privileged women. The American Journal of Clinical Nutrition, 28, 1322–1329.
29. Ghassemi, H., Massoudi, M. and Azordegan, F. (1974). State of nutrition in preschool children in Teheran. I. Calorie and protein intake. The American Journal of Clinical Nutrition, 27, 1088–1094.
30. Griffiths, M. and Payne, P.R. (1976). Energy expenditure in small children of obese and non-obese parents. Nature, 260, 698–700.
31. Guzman De, P.E. (1981). Energy allowances for the Philippine population. Proc. Workshop ‘Energy expenditure under field conditions’ Prague, Czechoslovakia, April, 6–18, 1981 (in press)
32. Guzman De, P.E., Cabrera, J.P., Basconcillo, R.O., Gaurano, A.L., Yuchingtat, G.P., Tan, R.M., Kalaw, J.M. and Recto,R.C. (1978). A study of the energy expenditure, dietary intake and pattern of daily activity among various occupational groups. V. Clerk-Typist. Philippine Journal of Nutrition, 31, 147–156.
33. Guzman De, P.E., Dominguez, S.R., Kalaw, J.M., Basconcillo,R.O. and Santos, V.F. (1974). A study of the energy expenditure, dietary intake, and pattern of daily activity among various occuptional groups, I. Laguna rice farmers. The Philippine Journal of Science, 103, 53–65.
34. Guzman De, P.E., Dominguez, S.R., Kalaw, J.M., Buning, M.N., Basconcillo, R.O. and Santos, V.F. (1974). A study of the energy expenditure, dietary intake and pattern of daily activity among various occupational groups. II. Marikina Shoemakers and Housewives. Philippine Journal of Nutrition, 27, 21–30.
35. Guzman De, P.E., Kalaw, J.M., Tan, R.H., Recto, R.C., Basconcillo, R.O.,Ferrer, V.T., Tombokon, M.S., Yuchingtat, G.P. and Gaurano, A.L. (1974). A study of the energy expenditure, dietary intake and pattern of daily activity among various occupational groups. III Urban Jeepney Drivers. Philippine Journal of Nutrition, 27, 182–188.
36. Guzman De, P.E., Recto, R.C., Cabrera, J.P., Basconcillo, R.O., Gaurano, A.L., Yuchingtat, G.P., Abanto, Z.U. and Math, B.S. (1979). A study of the energy expenditure, dietary intake and pattern of daily activity among various occupational groups. VI. Textile-Mill Workers. Philippine Journal of Nutrition, 32, 134–148.
37. Kofranyi, E. and Michaelis, H.F. (1940). Ein tragbarer apparat zur bestimmung des Gasstoffwechsels. Arbeitsphysiologie, 11, 148
38. Lonergan M.E., Milne, J.S., Maule, M.M. and Williamson, J. (1975). A dietary survey of older people in Edinburgh. British Journal of Nutrition, 34, 517–527.
39. Malhotra, M.S., Chandra, U., Rai, R.M., Venkataswamy, Y. and Sridharan, K. (1976). Food intake and energy expenditure of Indian troops in training. British Journal of Nutrition, 35, 229–244.
40. Mc Killop, F. and Durnin, J.V.G.A. (in preparation).
41. Mc Naughton, J.W. and Cahn, A.J. (1970). A study of the energy expenditure and food intake of five boys and four girls. British Journal of Nutrition, 24, 345–355.
42. Montgomery, E. and Johnson, A. (1977). Machiguenga energy expenditure. Ecology of Food and Nutrition, 6, 97–105.
43. Morgan, J. (1980). The preschool children diet, growth and obesity. Journal of Human Nutrition, 34, 117–130.
44. Muller, E.A. and Franz, H. (1952). Energieverbrauchsmessungen bei beruflicher Arbeit mit einer verbesserten Respirations-Gasuhr Arbeitsphysiologie, 14, 499.
45. Nnanyelugo, D.O., Kubiangha, L.O. and Akpanyung, U.O. (1979). Food intakes and pattern of consumption among elderly Nigerians with a low income. Ecology of Food and Nutrition, 8, 79–86.
46. Norgan, N.G. and Durnin, J.V.G.A. (1980). The effect of 6 weeks of overfeeding on the body weight, body composition, and energy metabolism of young men. The American Journal of Clinical Nutrition, 33, 978–988.
47. Norgan, N.G. and Ferro-Luzzi, A. (1978). Nutrition, physical activity, and physical fitness in contrasting environments. Nutrition, Physical Fitness, and Health. Int. Series on Sport Sciences, 7, 167. University Park Press, Baltimore.
48. Norgan, N.G., Ferro-Luzzi, A. and Durnin, J.V.G.A. (1974). The energy and nutrient intake and the energy expenditure of 204 New Guinean adults. Philosophical Transactions of Royal Society London B, 268, 309–348.
49. O'Hara-May, J. and Widdwson, E.M. (1976). Diets and living conditions of Asian boys in Coventry with and without signs of rickets. British Journal of Nutrition, 36, 23–36.
50. Peckos, P.S. and Ross, M.L. (1973). Longitudinal study of the caloric and nutrient intake of individual twins. Journal of The American Dietetic Association, 62, 399–403.
51. Rattigan, S., Ghisalberti, A.V. and Hartmann, P.E. (1981). Breast - milk production in Australian women. British Journal of Nutrition, 45, 243–249.
52. Robertson, J.D. and Reid, D.D. (1952). Standards for the basal metabolism of normal people in Britain. Lancet, 1, 940–949.
53. Rutishauser, I.H.E. and Whitehead, R.G. (1972). Energy intake and expenditure in 1-3-year-old Ugandan children living in a rural environment. British Journal of Nutrition, 28, 145–152.
54. Schutz, Y., Lechtig, A. and Bradfield, R.B. (1980). Energy expenditure and food intakes of lactating women in Guatemala. The American Journal of Clinical Nutrition, 33, 892–902.
55. Smithells, R.W., Ankers, C., Carver, M.E., Lennon, D., Schorah,
C.J. and Sheppard, S. (19
56. Spady, D.W. (1980). Total daily energy expenditure of healthy, free ranging school children. The American Journal of Clinical Nutrition, 33, 766–775.
57. Stolley, H., Droese, W. and Cersting, M. (1977). Energie-und Nährstoffversorgung im Verlauf der Kindheit. Monatsschrift fur Kinderheilkunde, 125, 929–934.
58. Talbot, F.B., Nilson, E.B. and Norcester, J. (1937). Basal metabolism of girls. American Journal of Disease of Children, 53, 273–347.
59. Valverde, V. and Rawson, I.C. (1976). Dietetic and anthropometric differences between children from the center and surrounding villages of a rural region o Costa Rica. Ecology of Food and Nutrition, 5, 197–203.
60. Viteri, F.E., Torùn, B., Galcia, J.C. and Herrera, E. (1971). Determining energy costs o agricultural activities by respirometer and energy balance techniques. The American Journal of Clinical Nutrition, 24, 1418–1430.
| REP. No | AGE y | SUBJ. No. | WEIGHT kg | ENERGY MJ/d. | REQUIREMENT | METHODOLOGY | COUNTRY & REGION | OCCUPATION & CHARACTERISTICS | ||
|---|---|---|---|---|---|---|---|---|---|---|
| by age MJ/d. | by weight MJ/d. | |||||||||
| P R E S C H O O L C H I L R E N - Combined sexes | ||||||||||
| 13 | 6m | 448 | 7.9 | 3.2 | - | 3.7 | 3 d. - measured food intake records: longitudinal study | U.S.A.,California Berkeley | multi-racial sample from Health Department Birth certificates | |
| 1 y | 382 | 10.0 | 3.9 | 4.4 | 4.2 | |||||
| 2 y | 312 | 12.6 | 5.0 | 5.3 | 5.3 | |||||
| 3 y | 270 | 14.6 | 5.5 | 6.1 | 6.1 | |||||
| 4 y | 242 | 16.5 | 5.9 | 6.9 | 6.9 | |||||
| 6 y | 180 | 21.0 | 6.8 | 7.9 | 7.5 | |||||
| 15 | 3.9–5.8 y | 40 | - | 6.9 | 7.8 | - | 3 d. record in household units | U.S.A.,Ransas | middle and upper middle class | |
| 4 | 8 m | 44 | - | 3.8 | - | - | 5d. weighed inventory | U.K.,Newcastle | upper and lower socio-economic classes-represented | |
| 20 m | 61 | - | 5.0 | 5.0 | - | |||||
| 3 y | 83 | - | 5.8 | 6.1 | - | |||||
| 5 y | 26 | - | 6.8 | 7.4 | - | |||||
| 43 | 6–18 m | 23 | 9.8 | 3.8 | 4.2 | 4.1 | 7d. weighed inventory | U.K.,London | ‘lean’and‘overweight’ children | |
| 12–24 m | 21 | 11.2 | 4.1 | 4.9 | 4.9 | |||||
| 18–30 m | 18 | 12.6 | 4.5 | 5.3 | 5.3 | |||||
| 30 | 4–5 y | 17 | 19.2 | 5.5 | 7.2 | 7.9 | 5–7 d. duplicates hombed | U.K., London | normal and overweight parents | |
| 9 | 5 y | 108 | 19.5 | 6.8 | 7.7 | 7.4 | 7 d. weighed inventory | France, Dijon | from different districts of the city | |
60 | >1 y | 12 | - | 5.0 | 3.4 | - | 1 d. ‘recall+weighing’ | Costa Rica, area of San Ramon | rural and urban | |
| 1 y | 36 | - | 4.6 | 4.9 | - | |||||
| 2 y | 31 | - | 4.4 | 5.7 | - | |||||
| 3 y | 31 | - | 4.5 | 6.5 | - | |||||
| 4–5 y | 41 | - | 5.0 | 7.4 | - | |||||
| 29 | 1 y | 58 | 9.5 | 4.0 | 4.9 | 4.1 | 3 d. precise weighing by ‘nutritionists’ who stayed all day with family | Iran, Teher | low-income district | |
| 2 y | 88 | 11.4 | 4.3 | 5.7 | 4.8 | |||||
| 3 y | 73 | 12.8 | 5.1 | 6.5 | 5.4 | |||||
| 4 y | 67 | 14.6 | 5.1 | 7.1 | 5.9 | |||||
| P R E S C H O O L C H I L D R E N - Males | ||||||||||
| 27 | 3–6 m | 66 | 7.1 | 3.5 | - | 3.4 | 3 d. - Recording by mother under partial supervision | U.S.A., 12 North Central States | stratified multistage cluster of households | |
| 6–9 m | 35 | 8.9 | 4.0 | - | 4.1 | |||||
| 9–12 m | 79 | 10.2 | 4.6 | 4.5 | 4.5 | |||||
| 1–2 y | 297 | 11.4 | 5.7 | 4.9 | 4.9 | |||||
| 2–3 y | 298 | 13.8 | 6.5 | 5.7 | 5.8 | |||||
| 3–4 y | 308 | 15.7 | 6.8 | 6.5 | 6.5 | |||||
| 4–5 y | 344 | 17.9 | 7.2 | 7.2 | 7.4 | |||||
| 5–6 y | 360 | 19.8 | 7.9 | 7.8 | 7.5 | |||||
| 50 | 3 y | 35 | - | 6.0 | 6.5 | - | 7 d. weighed inventory by mother, No supervision during week of survey Semi-longitudinal | U.S.A., Boston | twin pairs and their age-matched siblings | |
| 4 y | 47 | - | 6.0 | 7.2 | - | |||||
| 5 y | 64 | - | 6.6 | 7.8 | - | |||||
| 40 | 3–6 m | 39 | 7.2 | 2.9 | - | 3.5 | 5 d. weighed inventory with frequent supervision | U.K., Glasgow | random sample stratified to cover the different social groups in the community | |
| 6–9 m | 22 | 8.8 | 3.4 | - | 4.0 | |||||
| 9–12 m | 28 | 10.1 | 4.4 | - | 4.4 | |||||
| 12–18 m | 36 | 10.8 | 4.5 | 4.5 | 4.6 | |||||
| 18–24 m | 37 | 12.3 | 5.0 | 5.1 | 5.2 | |||||
| 16 | 12–23 m | 149 | - | 5.1 | 4.9 | - | 7 d. weighed inventory with supervision | U.K., Country - wide | random selection | |
| 24–35 m | 206 | - | 5.7 | 5.7 | - | |||||
| 36–47 m | 276 | - | 6.4 | 6.5 | - | |||||
| 57 | 2–3.9 y | 16.6 | 6.0 | 6.1 | 6.9 | 7-100 days precise weighing | Germany, Dortmund | different social classes | ||
| 4–5.9 y | 2 | 19.3 | 6.9 | 7.5 | 7.6 | |||||
| 24 | 1–2.9 y | 10 | 11.1 | 5.0 | 5.3 | 4.7 | 5 d. weighed inventory with frequent supervision | New Guinea | - Kaul - Lufa | coastal area highland area |
| 3–4.9 y | 18 | 13.0 | 6.1 | 6.8 | 5.4 | |||||
| 5–6.9 y | 16 | 16.3 | 6.0 | 8.1 | 6.0 | |||||
| 1–2.9 y | 12 | 10.4 | 3.9 | 5.3 | 4.4 | |||||
| 3–4.9 y | 21 | 14.4 | 6.5 | 6.8 | 5.9 | |||||
| 5–6.9 y | 25 | 17.9 | 6.7 | 8.1 | 7.6 | |||||
| SCHOOL CHILDREN AND ADOLESCENTS - Males | ||||||||||
| 50 | 6 | 78 | - | 7.2 | 8.4 | - | 7 d. weighing | U.S.A.,Hoston | see no. 50 | |
| 7 | 83 | - | 7.8 | 9.0 | - | |||||
| 8 | 101 | - | 8.3 | 9.5 | - | |||||
| 9 | 96 | - | 8.3 | 10.0 | - | |||||
| 10 | 85 | - | 8.3 | 10.5 | - | |||||
| 11 | 77 | - | 8.5 | 10.9 | - | |||||
| 12 | 67 | - | 8.8 | 11.3 | - | |||||
| 16 | 10–11 | 163 | - | 9.1 | 10.7 | - | 7 d. weighing | U.K., Sheffield Hristol | children not qualifying for free school-meals | |
| 12 | 8–11 | 159 | - | 9.6 | 10.3 | - | 7 d. weighing | U.K., Kent | various social classes | |
| 57 | 6–7.9 | - | 22.5 | 7.5 | 8.7 | 8.0 | 7-100 days precise weighing | Germany Dortmund | see no. 57 | |
| 8–9.9 | - | 28.0 | 8.1 | 9.8 | 9.1 | |||||
| 10–11.9 | - | 32.2 | 9.2 | 10.7 | 9.8 | |||||
| 50 | 13 | 58 | - | 8.9 | 1.7 | - | 7 d. weighing | U.S.A., Boston | see no. 50 | |
| 14 | 42 | - | 9.0 | 12.1 | - | |||||
| 15 | 26 | - | 9.9 | 12.6 | - | |||||
| 16 | 17 | - | 9.9 | 12.8 | - | |||||
| 17 | 10 | - | 9.8 | 13.0 | - | |||||
| 18 | 14.5 | 102 | 51.1 | 11.7 | 12.1 | 12.0 | 7 d. weighed inventory supervised | U.K., Glasgow | 1964 | various socio-economic backgrounds |
| 14.5 | 198 | 50.8 | 10.9 | 12.1 | 11.9 | 1971 | ||||
| 16 | 14.5 | 92 | - | 11.2 | 12.1 | - | 7 d. weighed | U.K., Newcastle | see above | |
| 16 | 14–15 | 390 | - | 10.3 | 12.4 | - | 7 d. weighed supervised 7 d. weighed | U.K., Birmingham Australia, | random sample | |
| 41 | 16–20 | 5 | 71.0 | 12.2 | 13.0 | 14.5 | supervised | Melbourne | students and trainees | |
| 57 | 12–14.9 | 2 | 39.1 | 10.8 | 11.9 | 9.7 | precise weighing | Germany, Dortmund | see no. 57 | |
| 49 | 14–16 | 18 | 52.3 | 10.5 | 12.6 | 11.6 | 7 d. weighed with supervision | U.K., Coventry | Asian boys with and without biochemical evidence of rickets | |
| 24 | 7.8 | 16 | 20.0 | 5.7 | 9.3 | 6.8 | 5 d. weighing with supervision | New Guinea | - Kaul | see no. 24 |
| 9–10 | 18 | 22.4 | 6.4 | 10.3 | 7.1 | |||||
| 11–12 | 16 | 25.0 | 6.4 | 11.1 | 7.2 | |||||
| 7–8 | 10 | 20.7 | 6.7 | 9.3 | 7.1 | - Lufa | ||||
| 9–10 | 8 | 24.8 | 7.1 | 10.3 | 7.8 | |||||
| 11-12 | 17 | 29.0 | 7.3 | 11.1 | 8.4 | |||||
| 2 | 12–14 | 16 | 31.3 | 8.8 | 11.7 | 8.1 | 7 d. weighed ‘by warden’ | Singapore | Indian students | |
| 24 | 13–14 | 10 | 29.0 | 7.3 | 11.9 | 7.1 | 5 d. weighed | New Guinea | - Kaul | see no. 24 |
| 15–18 | 11 | 42.7 | 7.7 | 12.9 | 9.1 | - Lufa | ||||
| 13–14 | 8 | 31.0 | 7.1 | 11.9 | 7.6 | |||||
| 15–17 | 15 | 44.2 | 8.6 | 12.9 | 9.5 | |||||
| A D U L T S - Males | ||||||||||
| Light Activity | ||||||||||
| 47 | 36 | 38 | 75.6 | 12.7 | 13.2 | 7 d. weighed, supervised | Italy, Trieste | different sedentary jobs in shipyard | ||
| 3 | 20–39 | 13 | 75.9 | 10.2 | 13.2 | 7 d. weighed, supervised | U.K., Cambridge village | ramdom sample of village | ||
| 40–59 | 12 | 9.9 | 12.2 | |||||||
| 32 | 28 | 10 | 53.9 | 9.8 | 9.4 | 7 d. weighed | Philippines, Manila | clerk-typists | ||
| Moderate Activity | ||||||||||
| 47 | 39 | 37 | 77.9 | 13.3 | 15.1 | 7 d. weighed | Italy, Trieste | shipyard workers, see no. 47 | ||
| 34 | 26 | 10 | 56.3 | 10.9 | 10.9 | 7 d. weighed | Philippines, Marikina | shoemakers | ||
| 35 | 32 | 10 | 54.8 | 11.0 | 10.6 | 7 d. weighed | Philippines | jeepney drivers | ||
| 36 | 25 | 25 | 54.8 | 9.8 | 10.6 | 7 d. record unsupervised | Philippines | textile-mill workers | ||
| 31 | ? | 33 | (56.0) | 9.9 | 10.8 | 7 d. weighed | Philippines | fishermen | ||
| 31 | ? | 32 | 54.0 | 10.6 | 10.4 | 7 d. weighed | Philippines | sugar cane workers | ||
| 23 | 43 | 24 | 74.3 | 15.5 | 13.6 | 7 d. precise weighed | Italy, Canino (Central Italy) | farmers | ||
| 25 | 40–59 | 20 | 14.6 | 13.1 | 7 d. weighed | Italy, Crevalcore (Northern Italy) | longitudinal study at farmers 5 y. intervals on CHD risk factors | |||
| 45–64 | 20 | (75.0) | 10.9 | 13.1 | 3 d. weighed | |||||
| 40–59 | 20 | 12.8 | 13.1 | 7 d. weighed | Italy, Montegiorgi (Central Italy) | |||||
| 45–64 | 20 | 11.7 | 13.1 | 3 d.weighed | ||||||
| 23 | 42 | 29 | 81.4 | 13.8 | 15.1 | 7 d. weighed | Finland | farmers | ||
| Moderate activity | ||||||||||
| 23 | 44 | 21 | 83.9 | 13.9 | 15.4 | 7 d. weighed | U.S., Beltsville | farmers | ||
| 33 | 28 | 9 | 51.5 | 10.3 | 10.0 | 7 d. weighed | Philippines | rice farmers | ||
| 8 | 45 | 11 | 56.5 | 9.0 | 10.4 | 6 d. weighed | Upper Volta | farmers: end of harvest | ||
| 48 | 18–29 | 19 | 57.4 | 8.9 | 11.1 | 5–6 d. weighed supervised | New Guinea | - Kaul | farmers, see no. 24 | |
| 30 + | 32 | 55.1 | 7.7 | 10.4 | ||||||
| 18–29 | 28 | 58.3 | 10.4 | 11.3 | - Lufa | |||||
| 30 + | 15 | 56.0 | 10.9 | 10.5 | ||||||
| Heavy activity | ||||||||||
| 47 | 37 | 75 | 76.1 | 13.9 | 17.1 | 7 d. weighed | Italy, Trieste | shipyard workers. see no. 47 | ||
| 19 | 19 | 159 | 63.3 | 36.1 | 14.3 | 7 d. weighed | U.K. | army recruits, initial training | ||
| 60 | 30 | 18 | 60.1 | 14.9 | 13.5 | l d. record + weighing | Guatemala | agricultrual labourers | ||
| Elderly | ||||||||||
| 3 | 60–79 | 7 | (76.0) | 9.9 | 10.6 | 7 d. weighed | U.K. Cambridge village | see no. 3 | ||
| 38 | 62–74 | 158 | 67.8 | 10.4 | 9.4 | dietary history plus some 2 d. weighing | U.K. Edinburgh | random sample | ||
| 75–90 | 54 | 69.2 | 9.1 | 8.4 | ||||||
| 25 | 50–69 | 20 | (75.0) | 12.3 | 11.6 | 3 d. weighed | Italy | - Crevalcore | farmers see no. 25 | |
| 50–69 | 20 | (75.0) | 10.4 | 11.6 | - Montegiorgi | |||||
| 45 | 60–69 | 10 | 58.9 | 12.0 | 8.2 | 2 d. weighed by ‘dietitians’ | Nigeria | urban + rural low income | ||
| 70–79 | 9 | 54.1 | 11.0 | 6.6 | ||||||
| 80–89 | 4 | 52.3 | 12.2 | 6.4 | ||||||
| P R E S C H O O L C H I L D R E N - Females | ||||||||||
| 27 | 3–6 m | 61 | 6.6 | 3.2 | - | 3.2 | see ‘males’ no.27 | U.S.A., 12 North Central States | ||
| 6–9 m | 50 | 8.3 | 4.2 | - | 3.8 | |||||
| 9–12 m | 59 | 9.2 | 4.2 | - | 4.0 | |||||
| 1–2 y | 200 | 10.8 | 5.5 | 4.9 | 4.8 | |||||
| 2–3 y | 253 | 13.0 | 6.0 | 5.6 | 5.4 | |||||
| 3–4 y | 302 | 15.0 | 6.5 | 6.4 | 6.2 | |||||
| 4–5 y | 347 | 17.4 | 6.8 | 7.0 | 7.0 | |||||
| 5–6 y | 268 | 19.1 | 7.2 | 7.5 | 7.2 | |||||
| 50 | 3 y | 17 | - | 5.0 | 6.4 | - | see ‘males’ no. 50 | U.S.A.,Boston | ||
| 4 y | 39 | - | 5.6 | 7.0 | - | |||||
| 5 y | 50 | - | 6.0 | 7.5 | - | |||||
| 6 y | 76 | - | 6.6 | 7.9 | - | |||||
| 40 | 3–6 m | 31 | 6.6 | 2.7 | - | 3.2 | 5 d. weighed inventory see ‘males’ no. 40 | U.K., Glasgow | ||
| 6–9 m | 21 | 8.1 | 3.1 | - | 3.7 | |||||
| 9–12 m | 20 | 9.0 | 3.6 | - | 4.0 | |||||
| 12–18 m | 40 | 10.2 | 4.5 | 4.5 | 4.5 | |||||
| 18–24 m | 30 | 1.8 | 4.7 | 5.1 | 5.1 | |||||
| 16 | 12–23 m | 154 | - | 4.7 | 4.9 | - | 7 d. weighed see ‘males’ no. 16 | U.K., Countrywide | ||
| 24–35 m | 201 | - | 5.4 | 5.6 | - | |||||
| 36–47 m | 262 | - | 5.8 | 6.4 | - | |||||
| 57 | 2–3.9 y | 14.8 | 5.5 | 6.0 | 6.2 | precise weighing see ‘males’ no. 57 | Germany, Dortmund | |||
| 4–5.9 y | 20.1 | 6.4 | 7.3 | 7.8 | ||||||
| 24 | 1–2.9 y | 13 | 9.5 | 4.4 | 5.3 | 4.1 | 5 d. weighing see ‘males’ no. 24 | New Guinea | - Kaul | |
| 3–4.9 y | 22 | 12.7 | 5.2 | 6.7 | 5.2 | |||||
| 5–6.9 y | 18 | 15.6 | 5.8 | 7.7 | 5.4 | |||||
| 1–2.9 y | 3 | 10.9 | 4.6 | 5.3 | 4.7 | - Lufa | ||||
| 3–4.9 y | 21 | 13.3 | 4.6 | 5.3 | 4.7 | |||||
| 5–6.9 y | 22 | 16.8 | 6.0 | 7.7 | 5.9 | |||||
| SCHOOL CHILDREN AND ADOLESCENTS - Females | ||||||||||
| 50 | 6 | 76 | - | 6.6 | 7.9 | - | 7 day weighing see ‘males’no. 50 | U.S.A., Boston | ||
| 7 | 93 | - | 7.1 | 8.4 | - | |||||
| 8 | 107 | - | 7.4 | 8.8 | - | |||||
| 9 | 108 | - | 7.8 | 9.2 | - | |||||
| 10 | 97 | - | 7.7 | 9.6 | - | |||||
| 11 | 89 | - | 7.8 | 9.8 | - | |||||
| 12 | 73 | - | 7.7 | 10.0 | - | |||||
| 16 | 10-11 | 158 | - | 0.8 | 9.7 | - | 7 d. weighing see ‘males’ no.16 | U.K., Sheffield | ||
| 57 | 6–7.9 | 24.0 | 7.0 | 8.2 | 8.3 | see ‘males’ no.57 | Germany, Dortmund | |||
| 8–9.9 | 27.2 | 7.9 | 9.0 | 8.4 | ||||||
| 10–11.9 | 31.2 | 8.0 | 9.7 | 8.5 | ||||||
| 50 | 13 | 56 | - | 8.0 | 10.3 | - | 7 d. weighing see ‘males’no. 50 | U.S.A., Boston | ||
| 14 | 40 | - | 7.7 | 10.5 | - | |||||
| 15 | 24 | - | 7.7 | 10.5 | - | |||||
| 16 | 15 | - | 7.2 | 10.1 | - | |||||
| 17 | 6 | - | 8.1 | 9.8 | - | |||||
| 18 | 14.5 | 90 | 51.8 | 9.5 | 10.5 | 10.8 | 7 d. weighing see ‘males’ no. 18 | U.K., Glasgow | 1964 | |
| 14.5 | 221 | 50.7 | 8.5 | 10.5 | 10.6 | 1971 | ||||
| 36 | 14.5 | 85 | - | 8.6 | 10.5 | - | 7 d. weighed see ‘males’no. 16 | U.K., Newcastle | ||
| 14–15 | 401 | - | 8.0 | 10.5 | - | U.K., Birmingham | ||||
| 41 | 18–19.9 | 4 | 56.0 | 9.3 | 9.4 | 9.6 | 7 d. weighed see ‘males’ no.41 | Australia. Melbourne | ||
| 47 | 12–14.9 | 42.6 | 10.0 | 10.3 | 9.3 | precise weighing see ‘males’ no. 57 | Germany, Dortmund | |||
| 24 | 7–8 | 19 | 18.5 | 5.5 | 8.6 | 6.1 | 5 d. weighing see‘males’no.24 | New Guinea | - Kaul | |
| 9–10 | 22 | 24.0 | 6.4 | 9.4 | 7.0 | |||||
| 11–12 | 15 | 25.6 | 6.4 | 9.9 | 6.3 | |||||
| 7–8 | 9 | 21.5 | 6.4 | 8.6 | 7.0 | - Lufa | ||||
| 9–10 | 14 | 23.8 | 6.8 | 9.4 | 7.0 | |||||
| 11–12 | 18 | 28.3 | 7.6 | 9.9 | 7.0 | |||||
| 24 | 13–14 | 15 | 35.3 | 6.9 | 10.5 | 7.6 | 5 d. weighed see ‘males’ no. 24 | New Guinea | - Kaul | |
| 15–17 | 21 | 45.0 | 5.7 | 10.1 | 8.5 | |||||
| 13–14 | 10 | 36.8 | 8.2 | 10.5 | 7.9 | - Lufa | ||||
| 15–17 | 9 | 44.1 | 8.9 | 10.1 | 8.3 | |||||
| 17 | 13–15 | 6 | 41.6 | 8.0 | 10.5 | 8.7 | 3 d. weighing + chemical analyse | India, Coimbatore | students | athletes non athletes |
| 16–18 | 6 | 43.9 | 9.4 | 9.8 | 7.9 | |||||
| 13–15 | 6 | 40.9 | 7.7 | 10.5 | 8.5 | |||||
| 16–18 | 6 | 46.4 | 7.8 | 9.8 | 8.4 | |||||
| A D U L T S - Females non-pregnant, non-lactating | ||||||||||
| Light activity | ||||||||||
| 3 | 20–39 | 9 | 9.2 | 9.7 | 7 d. weighed | U.K., Cambridge village | see ‘males’ no.3 | |||
| 40–59 | 14 | 63.5 | 8.3 | 9.2 | ||||||
| 34 | 34 | 10 | 54.0 | 7.5 | 8.2 | 7 d. weighed | Philippines, Manila | housewives | see ‘males’no. 34 | |
| 32 | 25 | 10 | 46.9 | 9.0 | 7.1 | 7 d weighed | Philippines, Manila | typists | see ‘males’ no. 32 | |
| Moderate activity | ||||||||||
| 17 | 19–22 | 6 | 46.4 | 9.5 | 7.8 | 3 d. weighed+analysis | India, Coimbatore | students | athletes | |
| 19–22 | 6 | 47.1 | 8.1 | 7.9 | non-athletes | |||||
| 54 | 23 | 6 | 49.0 | 7.9 | 8.2 | 24h recall on 4 separate days | Guatemala, village | peasants | ||
| 8 | 31 | 14 | 49.9 | 6.3 | 8.4 | 6 d. weighed | upper Volta | farmers - end of harvest | ||
| 48 | 18–29 | 29 | 49.0 | 6.0 | 8.2 | 5–6 d. weighed see ‘males’ no.48 | New Guinea | - Kaul | coastal area subsistence farmers highland area | |
| 30 + | 31 | 44.4 | 6.0 | 7.2 | ||||||
| 18–29 | 28 | 51.3 | 9.0 | 8.6 | - Lufa | |||||
| 30 + | 6 | 45.8 | 8.3 | 7.5 | ||||||
| 36 | 33 | 14 | 48.7 | 6.3 | 8.2 | 7 d. record unsupervised | philippines | textile-mill workers see‘males’ no. 36 | ||
| Pregnancy | ||||||||||
| 6 | 26 | 13 | 63.7 | 8.6 | 10.7 | 7 d. household measures and servings | U.S.A., Berkeley | stage of pregnancy | 20–28 weeks | |
| 12 | 70.4 | 7.5 | 10.7 | 29–36 weeks | ||||||
| 14 | 77.0 | 8.4 | 10.7 | 37–40 weeks | ||||||
| 55 | - | 179 | - | 8.2 | - | 7 d. weighed supervised | U.K., Leeds | self-selected, of various social classes | 8–12 weeks | |
| 28 | 18 | 20 | 58.0 | 6.4 | 9.3 | 2 d. weighed (Energy results so peculiar not commented on) | Ethiopia. Addis Abeba | ‘non-privileged’ ‘privileged’ | 3rd trimester | |
| 23 | 10 | 58.8 | 12.4 | 9.3 | ||||||
| 48 | 27 | 9 | 51.7 | 5.9 | 9.1 | 5–6 d. weighed supervised see‘males’no. 48 | - Kaul | subsistence farmers | probably mostly 1st and 2nd trimester | |
| New Guinea | ||||||||||
| 25 | 7 | 53.5 | 8.4 | 9.5 | ||||||
| - Lufa | ||||||||||
| Lactation | ||||||||||
| 0 | 27 | 12 | 62.0 | 7.5 | 11.7 | 3d. household measures and servings | U.S.A., Berkeley | 8–12 weeks | ||
| 51 | 31 | 27 | 57.0 | 9.7 | 11.0 | 7 d. ‘measured portions’ | Australia, Perth | fully or partially breast-feeding | 1–15 months | |
| 1 | - | 100 | 53.7 | 9.9 | 10.5 | 24 h recall for 3 day+3 validation | Nigeria | 75 rurals and 25 urbans of poor socio-economic status | 3 weeks to 6 months | |
| 54 | 28 | 18 | 49.2 | 8.1 | 10.5 | 24h recall for 4 days | Guatemala-village | farmers see no.54 | 6 months or more | |
| 48 | - | 32 | 47.6 | 6.1 | 10.3 | 5–6d. weighed supervised see‘males’no 48 | - Kaul | up to 2y | ||
| New Guinea | ||||||||||
| - | 20 | 48.3 | 9.1 | 10.4 | - Lufa | |||||
| Elderly | ||||||||||
| 3 | 60–79 | 8 | (64.0) | 6.4 | 7.7 | 7 d. weighed see ‘males’ no. 3 | U.K., Cambridge | |||
| 38 | 62–74 | 190 | 62.9 | 7.4 | 7.7 | 7 d. weighed see ‘males’no. 38 | U.K., Edinburgh | |||
| 75–90 | 73 | 57.7 | 6.9 | 6.2 | ||||||
| 45 | 60–79 | 19 | (56.0) | 10.5 | 6.8 | 7 d. weighed see ‘males’no. 45 | Nigeria | |||
| 81 + | 12 | (51.0) | 6.6 | 5.4 | ||||||
| REF No | AGE y | SU BJ. No. | WEIGHT kg | ENERGY MJ/d. | REQUIREMENT | METHODOLOGY | COUNTRY & REGION | OCCUPATION & CHARACTERISTICS | ||
|---|---|---|---|---|---|---|---|---|---|---|
| by age MJ/d. | by weight MJ/d. | |||||||||
| PRESCHOOL CHILDREN - Combined sexes | ||||||||||
| 54 | 1.5–3.0 | 5 | - | 0.41/kg | - | - | modified diary + published values of energy costs | Uganda, Kampala | Europeans, children of professionals | |
| 30 | 4–5 | 12 | 19.1 | 6.3 | 7.1 | 7.8 | 4–7 d. integrated heart rate + calibration line (‘at least 2 points’) by air flow diapherometry | Great Britain, London (?) | normal parents overweight parents | |
| 8 | 19.5 | 4.9 | 7.1 | 7.9 | ||||||
| 53 | 1.5–3.0 | 20 | - | 0.33/kg | - | - | see no. 53 | Uganda, Kampala | African children | |
| SCHOOL CHILDREN & ADOLESCENTS - Males | ||||||||||
| 22 | 9.1 | 12 | 35.2 | 8.1 | 9.8 | 11.5 | 7 d. diary by observer calibrated KM44 +Douglas bag Sleep =BMR (Fleisch)26 | Italy, Salerno | school boys | rurals |
| 20 | 9.4 | 11 | 32.2 | 9.1 | 10.0 | 10.3 | 48 h heart rate count with intermittent readings. Calibration by‘open circuit’ technique. Sleep=BMR (Talbot)58 | Canada, Alberta | school boys | Iree-living |
| 41 | 16.7 | 3 | 65.7 | 10.7 | 12.8 | 13.9 | 7 d. diary by subjects; little supervision. IMP Sleep = BMR (Robertson & Reid)52 | Australia, Melbourne | school boys | |
| 2 | 13 | 16 | 31.3 | 7.6 | 11.7 | 8.1 | 7 d. supervision by warden; KM | Singapore | boy's hostel residents | Dravidian Indians |
| A D U L T S - Males | ||||||||||
| Light activity | ||||||||||
| 47 | 36 | 38 | 75.6 | 11.9 | 13.2 | 7 d. diary by observer + supervision Calibrated KM + Douglas bag Sleep = BMR (Fleisch) | Italy, Trieste | shipyard workers | different sedentary jobs | |
| 32 | 28 | 10 | 53.9 | 9.2 | 9.4 | 7.d diary Calibrated KM Sleep = BMR (measured twice) | Philippines, Manila | Clerk-typists | ||
| Moderate activity | ||||||||||
| 47 | 39 | 36 | 77.9 | 13.1 | 15.0 | 7 d. diary see no. 47 | Italy, Trieste | shipyard workers | moderately heavy jobs | |
| 46 | 21.7 | 6 | 64.0 | 11.8 | 12.4 | 14 d. diary of activity with supervision Calibrated KM + Douglas bag | U.K., Glasgow | students, overfeeding experiment | normal | |
| overfeeding | ||||||||||
| 70.0 | 11.4 | 13.6 | 42 d. diary | |||||||
| 41 | 20 | 2 | 80.1 | 10.9 | 15.5 | 7 d. diary by subject + supervision; IMP | Australia, Victoria, | 1 trainee and 1 engineer | ||
| 34 | 26 | 10 | 56.3 | 11.3 | 10.9 | 7 d. diary by observer ? Calibrated KM Sleep = BMR (Fleisch) | Philippines, Marikina | shoemakers | ||
| 35 | 32 | 10 | 54.8 | 10.4 | 10.6 | 7 d. diary, by observer? Calibrated KM Sleep = BMR (Fleisch) | Philippines, Rizal | jeepney drivers | ||
| 36 | 25 | 26 | 54.8 | 10.4 | 10.6 | 7 d. diary, by observer + KM | Philippines | textile-mill workers | ||
| 31 | 20–50 | 33 | 56.0 | 10.0 | 10.8 | 7 d. diary, by observer + KM | Philippines | fishermen | ||
| 33 | 28 | 9 | 51.5 | 13.8 | 10.8 | 7 d. diary, by10.0 Sleep = BMR (Fleisch) | observer + KM Laguna | Philippines, rice farmers | ||
| 31 | 20–50 | 32 | 54.0 | 12.7 | 10.4 | 7 d. diary, by observer + KM | Philippines | sugar cane workers | ||
| 20 | - | 32 | - | 12.8 | - | 1 d. diary, by observer + 2-5d. interviews. Some energy measures by KM. Mostly, values from literature or unpublished | - Yemenite | Mostly farm workers | Summer Winter Summer Winter | |
| - | 27 | - | 12.6 | - | ||||||
| Israel, | ||||||||||
| - | 48 | - | 12.8 | - | Negev | |||||
| - | 51 | - | 13.0 | - | - Kurdish | |||||
| 10 | 39 | 10 | 56.0 | 13.7 | 12.6 | 1 d. diary, by observer, with supervision Calibrated KM | Iran, plain of Varanin | Agricultural workers | Spring Summer Autumn Winter | |
| 38 | 14 | 56.0 | 14.4 | 12.6 | ||||||
| 35 | 10 | 59.0 | 15.2 | 13.3 | ||||||
| 38 | 12 | 59.0 | 11.0 | 11.4 | ||||||
| 11 | 36 | 23 | 58.5 | 10.1 | 11.3 | 2 d. diary by observer KM Sleep = 85% of RMR | Upper Volta, Mossi plateau | farmers | dry season wet season | |
| 16 | 14.5 | 13.2 | ||||||||
| 8 | 45 | 11 | 56.5 | 8.9 | 10.4 | 6 d. diary by observer + KM Group mean costs | Upper Volta, Mossi plateau | farmers | dry season, end of harvest | |
| 60 | 29.7 | 18 | 60.1 | 15.5 | 13.5 | 3 d. diary by observer + KM Schoelander & amperometry Sleep = BMR | Guatemala | agricultural labourers (considered ‘very active’) | ||
| 48 | 18–29 | 17 | 57.7 | 11.0 | 11.1 | 5–7 d. diary by observer with supervision, Calibrated KM and Douglas bag. Sleep = BMR (Fleisch) (Kaul = 90% BMR) | - Kaul | subsistence | coastal area | |
| 30–48 | 25 | 55.3 | 9.0 | 10.4 | highland area | |||||
| 18–29 | 25 | 58.8 | 10.7 | 11.4 | New Guinea | |||||
| - Lufa | ||||||||||
| 30–49 | 15 | 56.0 | 10.8 | 10.5 | ||||||
| 42 | 30 | 15 | 53.9 | 12.1 | 10.0 | Random visits through 1 y(3.500 for time allocation) | Peru, Upper Amazonian tributaries | Machiguenga Indians huntergatherer, horticulturalist | dry season | |
| 25 | 8 | 51.8 | 13.9 | 11.7 | Indirect calorimetry (no description given) | wet season | ||||
| very active occupations | ||||||||||
| 19 | 19.2 | 35 | 63.3 | 15.8 | 14.3 | 24 h diary by observer and subject; IMP worn for 24 h; BMR by Benedict-Roth repeated over 3 weeks | Great Britain, 6 centres | army recruits infantry | initial training | |
| 14 | 20.5 | 15 | 70.2 | 15.6 | 15.8 | 24 d. diary, on group or on individuals, by observer, | Malaya | British army jungle training | low energy diet (7.8 MJ) | |
| 21.8 | 14 | 71.2 | 15.9 | 16.0 | KM only during acclimatization period (pre-experimental) | control diet (15.0 MJ) | ||||
| 47 | 37 | 75 | 76.1 | 13.9 | 17.1 | 7 d. diary by observer see no. | Italy, Trieste | shipyard workers | heavy occupation | |
| 39 | - | - | 64.2 | 15.4 | 14.5 | 15 d. diary, repeated thrice over 3 months, by subjects; no supervision, no energy cost measurement | India | Indian army training | ||
| SCHOOL CHILDREN AND ADOLESCENTS - Females | ||||||||||
| 56 | 9.5 | 10 | 31.6 | 7.2 | 9.2 | 9.6 | 48 h heart rate see ‘males’ no. 56 | Canada, Alberta | school girls | free living |
| A D U L T S - Females non pregnant non-lactating | ||||||||||
| Light activity | ||||||||||
| 34 | 34 | 0 | 54.0 | 8.5 | 8.2 | 7 d. diary +KM see ‘see males’ no. 34 | Philippines, Marikina | housewives | ||
| 32 | 24.7 | 10 | 46.9 | 7.9 | 7.1 | 7 d. diary + KM see ‘males’ no. 32 | Philippines, manila | clerck-typists | ||
| Moderate activity | ||||||||||
| 41 | 19 | 4 | 56.3 | 8.8 | 9.6 | see ‘males’ no. 41 | Australia, Victoria | students trainee | ||
| 36 | 33 | 14 | 48.7 | 8.5 | 8.2 | 7 d. diary + KM see ‘males’ no.36 | Philippines | texile-mill workers | ||
| 42 | 25 | 20 | 44.5 | 8.3 | 7.4 | random visits for activity profile | Peru | Machiguenga Indians | wet season | |
| 27 | 8 | 44.3 | 8.2 | 7.4 | ‘indirect calorimetry’ see ‘males’ no. 42 | Indians | dry season | |||
| 48 | 18–29 | 23 | 49.8 | 8.1 | 8.3 | 5–7 d. diary + KM and Douglas bag see ‘males’ no. 48 | - Kaul | farmers | coast | |
| 30–48 | 17 | 45.9 | 7.1 | 7.5 | ||||||
| New Guinea | ||||||||||
| 18–29 | 31 | 51.1 | 9.5 | 8.6 | - Lufa | highlands | ||||
| 30–49 | 7 | 46.3 | 9.0 | 7.5 | ||||||
| 8 | 30.6 | 14 | 49.9 | 8.1 | 8.4 | 6 d. diary + KM see ‘males’ no. | Upper Volta, Mossi plateau | dry season, end of harvest;‘some’ lactating women | ||
| 7 | 30.6 | 1 | 50.6 | 8.9 | 8.5 | 2 d. diary + KM Sleep = 85 % RMR | Upper Volta, Mossi plateau | farmers | rainy season dry season | |
| 11.1 | 10.0 | |||||||||
| 20 | - | 21 | - | 9.6 | - | 1 d. diary & 2–5 interviews + KM and published values of energy costs see ‘males’ no. 20 | - Yemenite | farmers | summer winter | |
| - | 24 | - | 10.0 | - | ||||||
| Israel | ||||||||||
| - | 23 | - | 9.4 | - | - Kurdish | summer winter | ||||
| - | 28 | - | 10.0 | - | ||||||
| 54 | 23 | 6 | 49.0 | 8.2 | 8.2 | 48 h Heart rate read hourly. Individual regressions with 6 points Sleep = BMR (lowest of 2 measures) | Guatemala, village | farmers | ||
| Pregnancy | ||||||||||
| 5 | 16 | 12 | 66.5 | 9.3 | 12.5 | 1 d. diary in 5-min blocks, Douglas bag | black students black, except one (in metabolic ward) | 4–9 month pregnant 8 month pregnant | ||
| 17 | 15 | 63.2 | ||||||||
| 6 | 26 | 13 | 63.7 | 8.8 | 10.7 | 3 d. diary in 5-min block;some measures of energy costs | U.S.A., Berkeley | stage of pregnancy | 24 week pregnant | |
| 26 | 12 | 7.4 | 9.6 | 10.7 | 32 week pregnant | |||||
| 26 | 14 | 77.0 | 9.9 | 10.7 | 38 week pregnant | |||||
| 48 | - | 7 | 51.0 | 7.8 | 9.1 | see ‘males’ no. 48 | - Kaul | probably mostly 1 st and 2 nd trimester | ||
| New Guinea | ||||||||||
| - | 7 | 53.5 | 9.5 | 9.5 | - Lufa | |||||
| Lactation | ||||||||||
| 6 | 26 | 12 | 62.4 | 7.7 | 11.8 | 3 d. diaries see no. 6 | U.S.A., Berkeley | 10 week post partum | ||
| 54 | 28 | 18 | 49.2 | 8.4 | 10.5 | 48 h Heart rate see no. 54 | Guatemala, village | peasants | breast feeding 10 months post partum | |
| WEIGHT kg | E N E R G Y | ||
|---|---|---|---|
| Intake MJ/d. | Requirement MJ/d. | Expenditure MJ/d. | |
| DEVELOPED COUNTRIES | |||
| 76 | 12.7 | 13.2 | 11.9 |
| 76 | 10.2 | 13.2 | - |
| 9.9 | 12.2 | - | |
| 78 | 13.3 | 15.0 | 13.1 |
| 74 | 15.5 | 13.6 | - |
| 75 | 14.6 | 13.1 | - |
| 75 | 12.8 | 13.1 | - |
| 81 | 13.8 | 15.0 | - |
| 84 | 13.9 | 15.4 | - |
| 76 | 13.9 | 17.1 | 13.9 |
| 63 | 16.1 | 14.3 | 15.8 |
| 71 | - | 15.9 | 15.7 |
| 64 | - | 12.4 | 11.8 |
| DEVELOPING COUNTRIES | |||
| 54 | 9.8 | 9.4 | 9.2 |
| 56 | 10.9 | 10.9 | 11.3 |
| 55 | 11.0 | 10.6 | 10.4 |
| 56 | 9.9 | 10.8 | 10.0 |
| 55 | 9.8 | 10.6 | 10.4 |
| 52 | 10.3 | 10.0 | 13.8 |
| 57 | 9.0 | 10.4 | 8.9 |
| 59 | - | 11.3 | 10.1 |
| - | 13.2 | 14.5 | |
| 56 | - | 12.6 | 13.7 |
| 56 | - | 12.6 | 14.4 |
| 59 | - | 13.3 | 15.2 |
| 59 | - | 11.4 | 11.0 |
| 57 | 8.9 | 11.1 | 11.0 |
| 55 | 7.7 | 10.4 | 9.0 |
| 58 | 10.4 | 11.3 | 10.7 |
| 56 | 10.9 | 10.5 | 10.8 |
| 54 | 10.6 | 10.4 | 11.7 |
| 60 | 14.9 | 13.5 | 15.5 |
| 52 | - | 10.0 | 12.1 |
| - | 11.7 | 13.9 | |
| WEIGHT kg | ENERGY | ||
|---|---|---|---|
| Intake MJ/d. | Requirement MJ/d. | Expenditure MJ/d. | |
| DEVELOPED COUNTRIES | |||
| 64 | 9.2 | 9.7 | - |
| 8.3 | 9.2 | - | |
| 56 | 9.3 | 9.4 | 8.8 |
| DEVELOPING COUNTRIES | |||
| 54 | 7.5 | 8.2 | 8.5 |
| 47 | 9.0 | 7.1 | 7.9 |
| 47 | 8.1 | 7.2 | - |
| 46 | 9.5 | 7.8 | - |
| 49 | 7.9 | 8.2 | 8.2 |
| 50 | 6.3 | 8.4 | 8.1 |
| - | 8.5 | 8.9 | |
| 51 | 10.0 | 11.1 | |
| 49 | 6.0 | 8.2 | 8.1 |
| 44 | 6.0 | 7.2 | - |
| 46 | - | 7.5 | 7.1 |
| 51 | 9.0 | 8.6 | 9.5 |
| 46 | 8.3 | 7.5 | 9.0 |
| 49 | 6.3 | 8.2 | 8.5 |
| - | 7.4 | 8.2 | |
| 44 | 7.4 | 8.2 | |
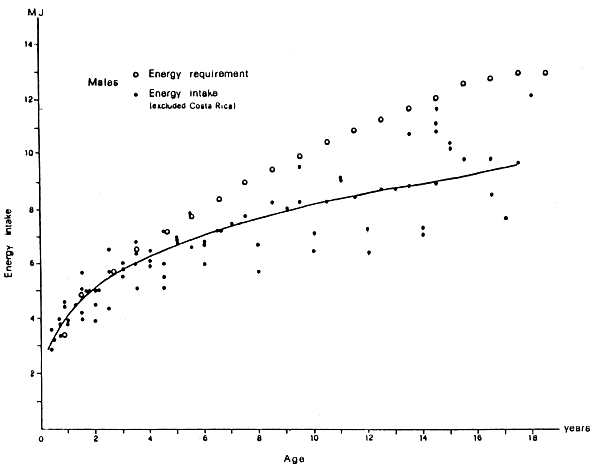
Fig. 1: Energy requirement by age (21) and relationship between mean daily energy intake and age, for male children from developed and developing countries
r = 0.922 p<0.001 log Y = 0. 6130 + 0.2957 log X
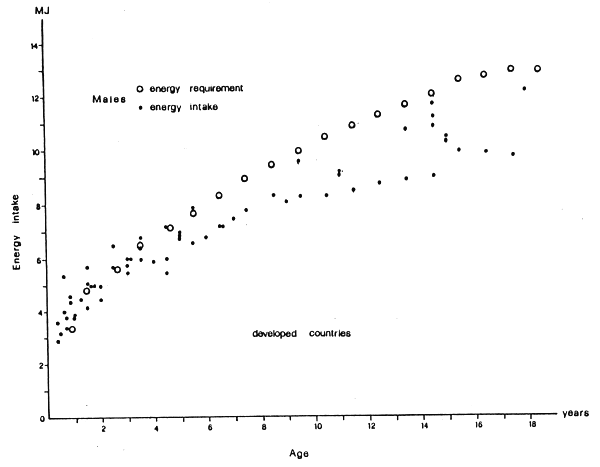
Fig. 2: Energy requirement by age (21) and mean daily energy intake of male children from developed countries.
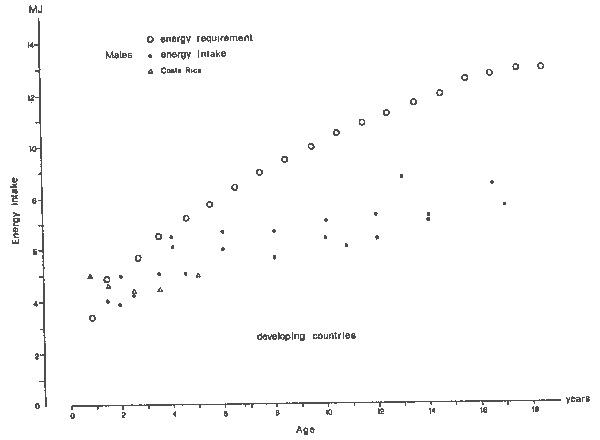
Fig 3: Energy requirement by age (21) and mean daily energy intake of male children from developing countries.
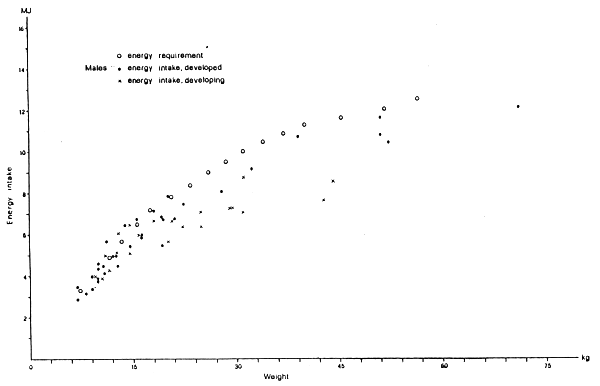
Fig. 4: Energy requirement (21) and daily energy intake on weight basis for male children from developed and developing countries.
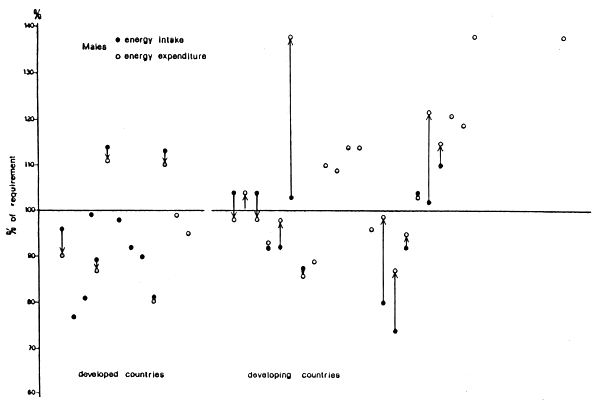
Fig. 5: Energy intake and expenditure, expressed as percent of energy requirement (21) of adult men in developed and developing countries. Arrows link the data of intake and expenditure obtained on the same group of subjects.
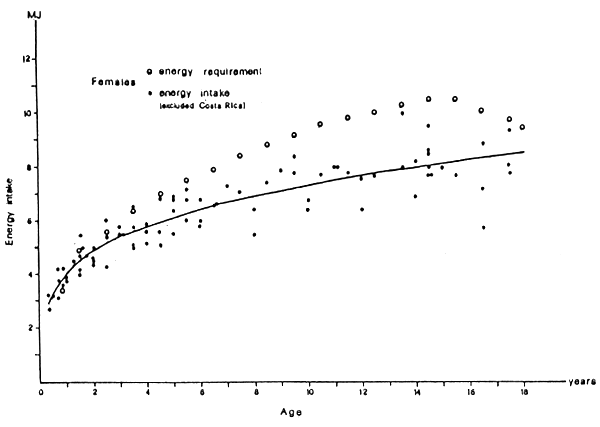
Fig. 6: Energy requirement by age (21) and relationship between mean daily energy intake and age, for female children from developed and developing countries.
r = 0.932 P < 0.001 log Y = 0.6047 + 0.2597 log X
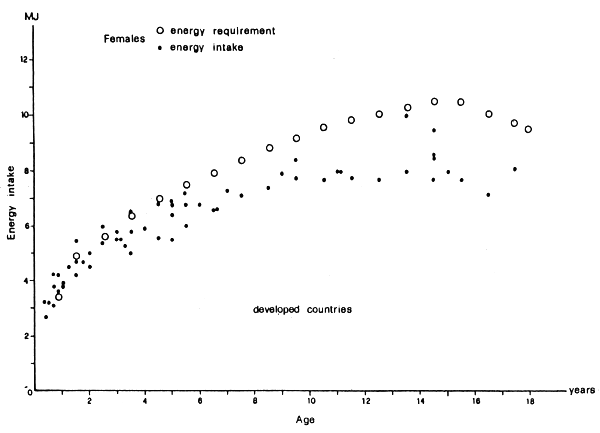
Fig. 7: Energy requirement by age (21) and mean daily energy intake of female children from developed countries.
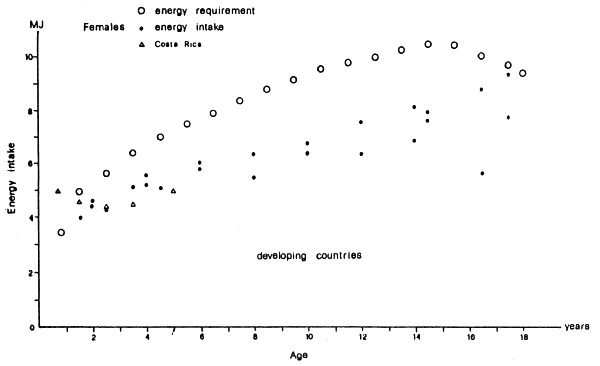
Fig. 8: Energy requirement by age (21) and mean daily energy intake of female children from developing countries.
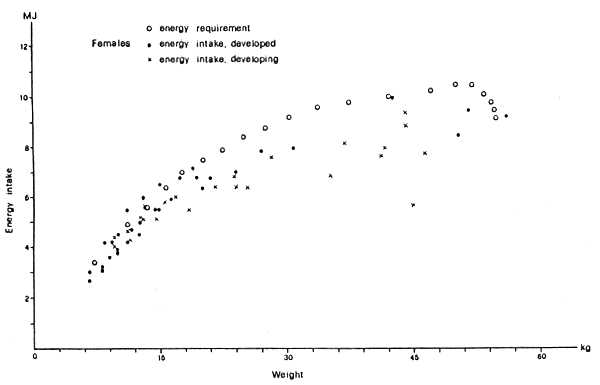
Fig. 9: Energy requirement (21) and daily energy intake on weight basis for female children from developed and developing countries.
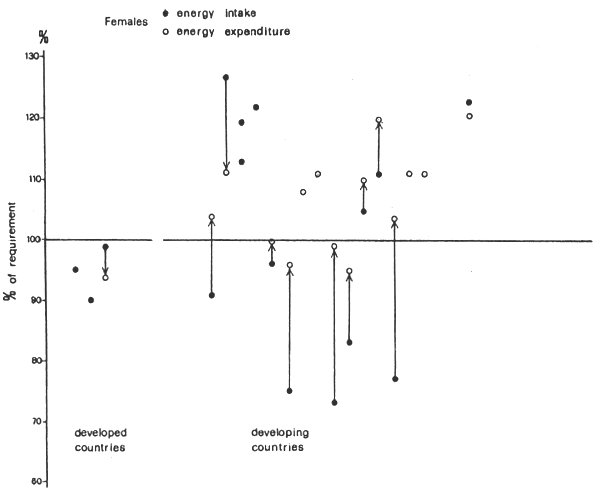
Fig. 10: Energy intake and expenditure, expressed as percent of energy requirement (21) of adult women in developed and developing countries. Arrows link the data of intake and expenditure obtained on the same group of subjects.