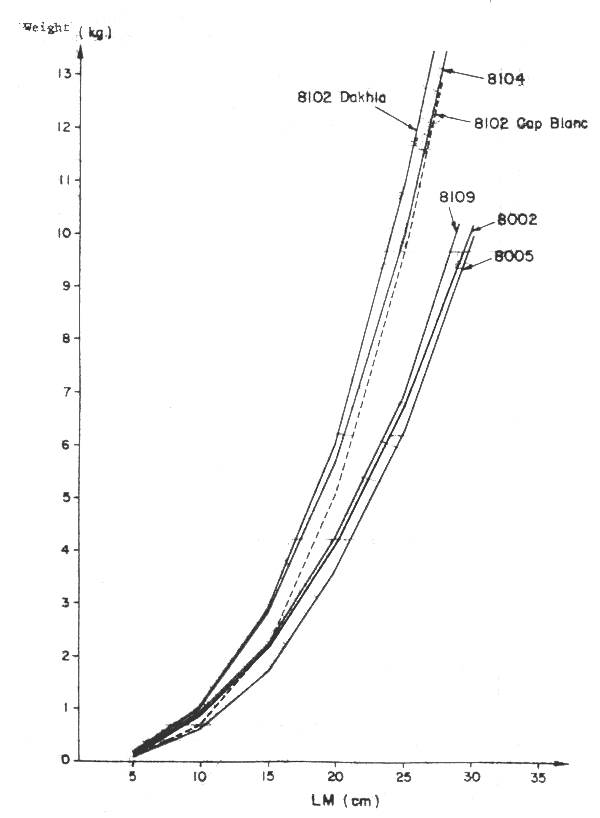
Fig. 1 Octopus vulgaris. Mantle length/weight ratios obtained during different cruises of research ship IBN SINA
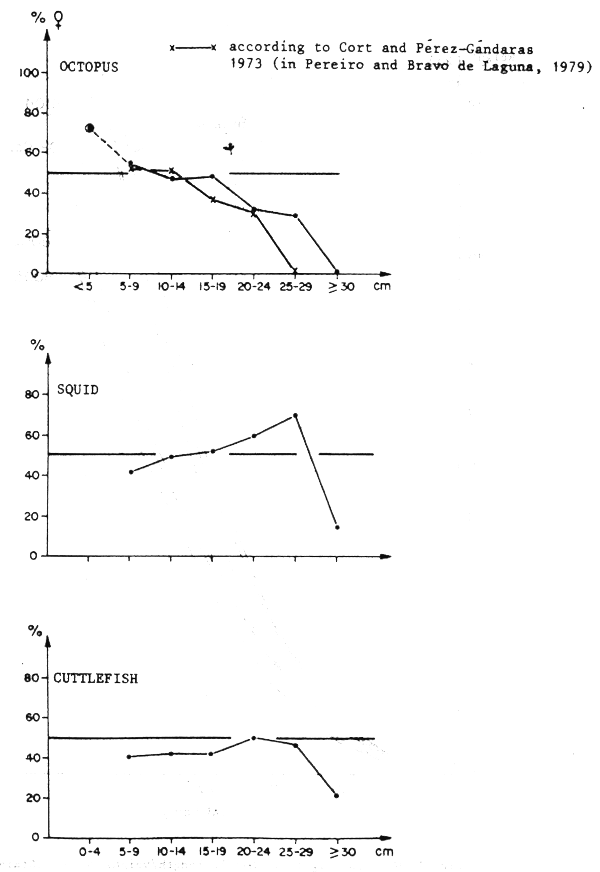
Fig. 2 Evolution of percentage of females according to mantle length (IBN SINA Campaigns 1980–1981). All data combines.
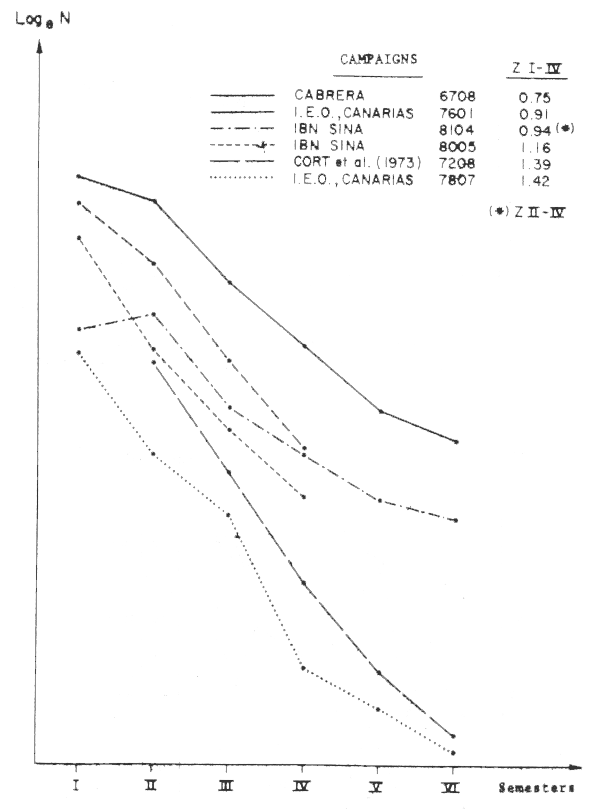
Fig. 3 Catch curves for octopus in the Dakhla region (experimental campaigns)
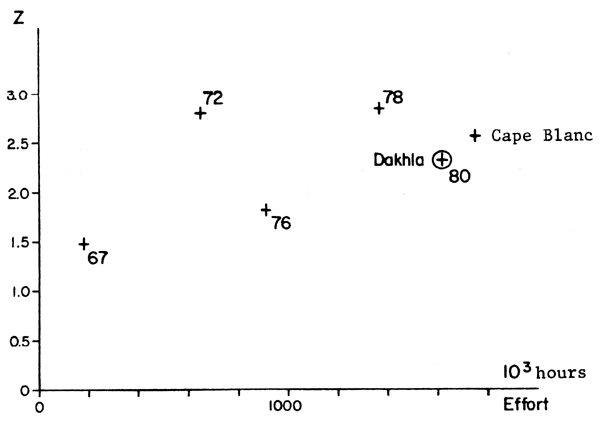
Fig. 4 Ratio between fishing effort and Z estimated total mortality (experimental data). Dakhla region, except for 1980
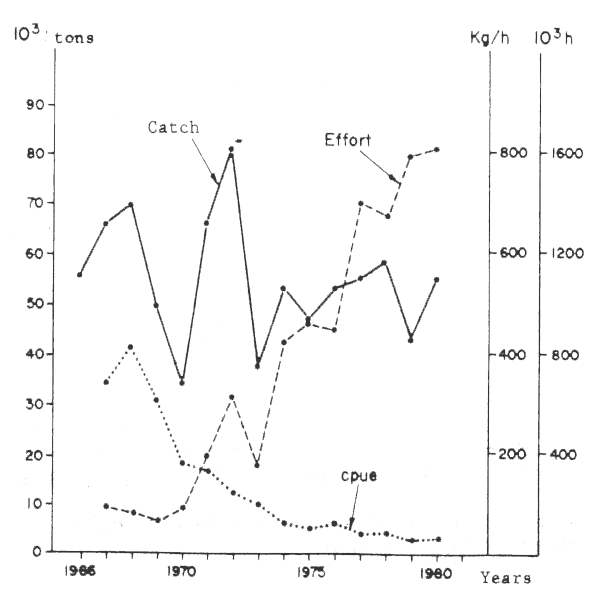
Fig. 5 Catch, efforts and cpue in the Dakhla region
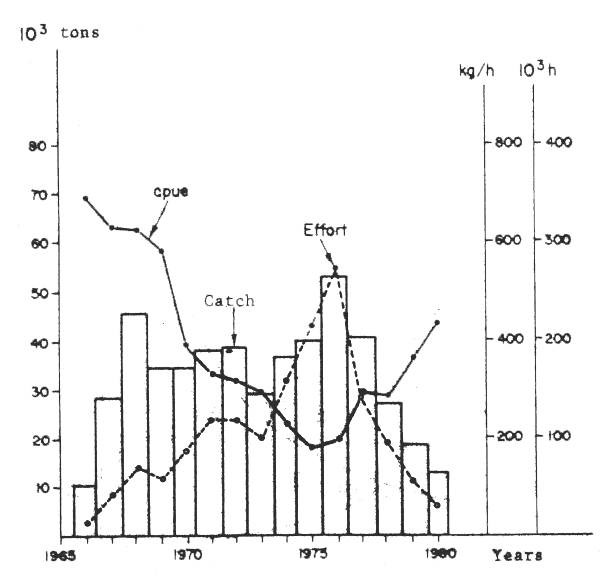
Fig. 6 Catch, efforts and cpue in the Cape Blanc region
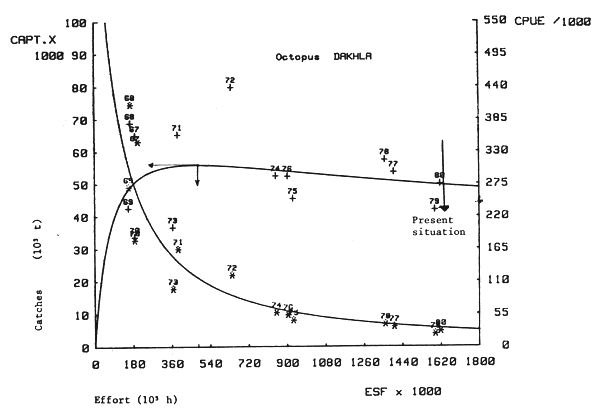
Fig. 7 Production model for Dakhla stock, best adjustment (M = 0.2)
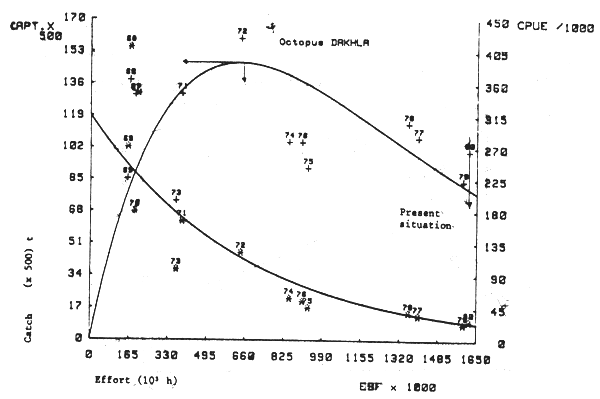
Fig. 8 Production model (Fox) for Dakhla octopus stock
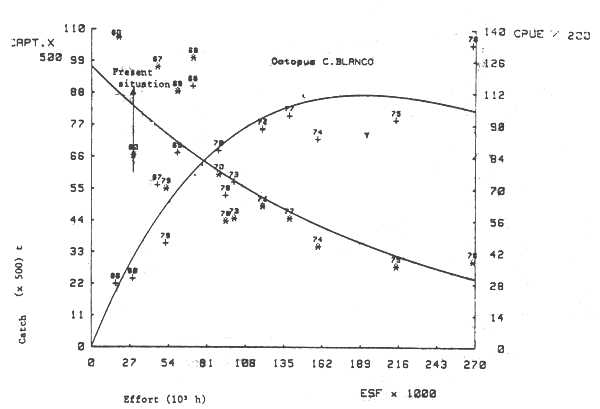
Fig. 9 Production models (Fox) for Cape Blanc octopus
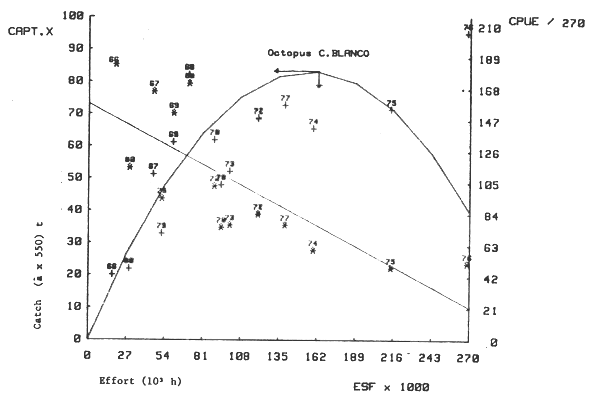
Fig. 10 Production model (Schaefer) for Cape Blanc octopus
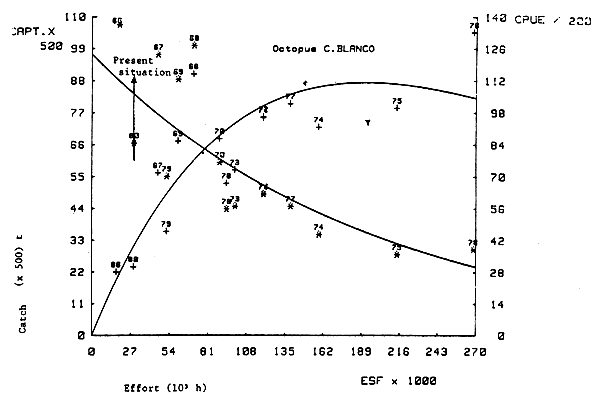
Fig. 11 Production model (Schaefer) for cuttlefish in Division 34.1.3
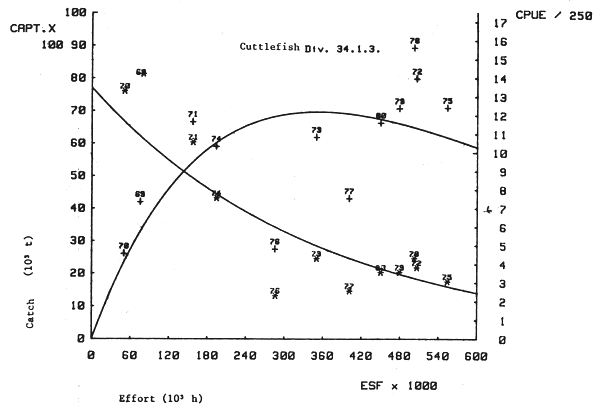
Fig. 12 Production model (Fox) for cuttlefish in Division 34.1.3
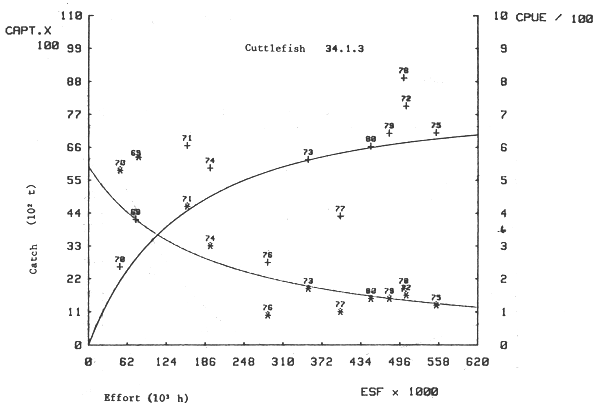
Fig. 13 Production model for cuttlefish in Division 34.1.3 (m = 0.1)
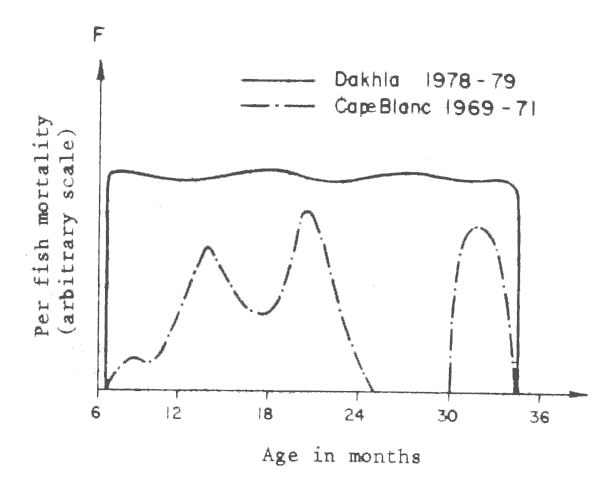
Fig. 14 Per fish mortality vector movement according to age for octopus at Cape Blanc (1969–71) and Dakhla (1976–79)
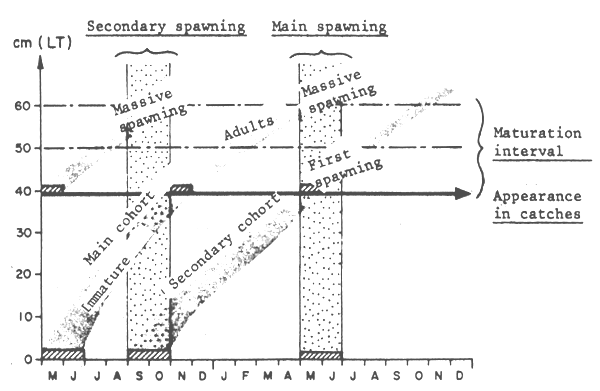
Fig. 15 Reconstruction of life cycle of Cape Blanc octopus
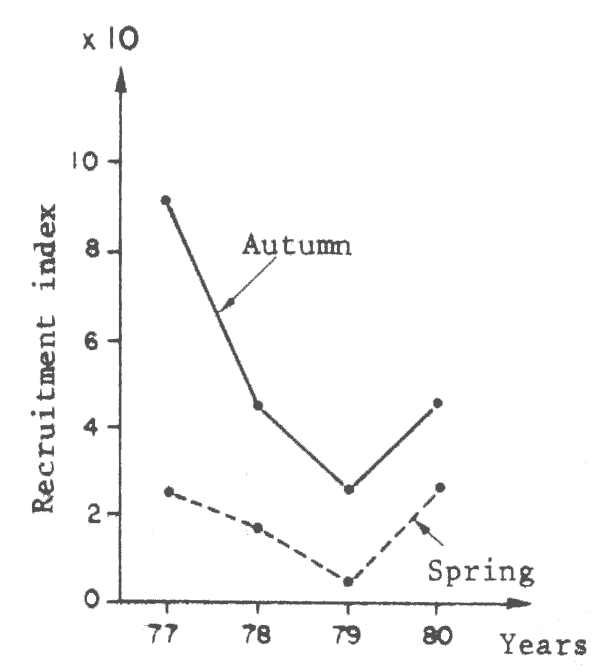
Fig. 16 Evolution of recruitment index in Dakhla region
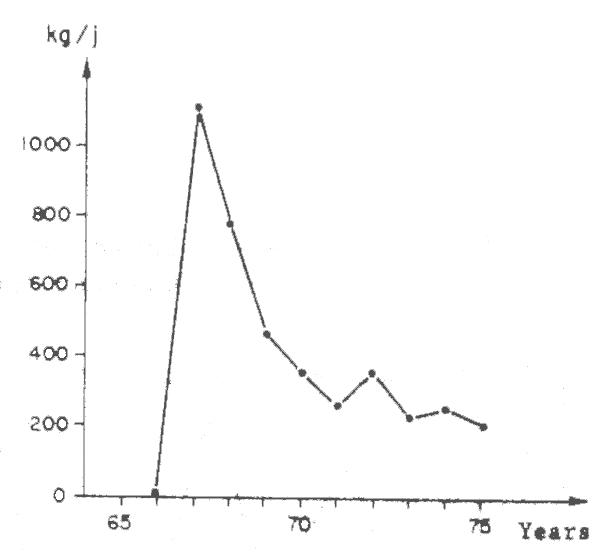
Fig. 17 Evolution of spring recruitment index in the Cape Blanc region (August cpue, Tab. 21, Hatanaka 1979)
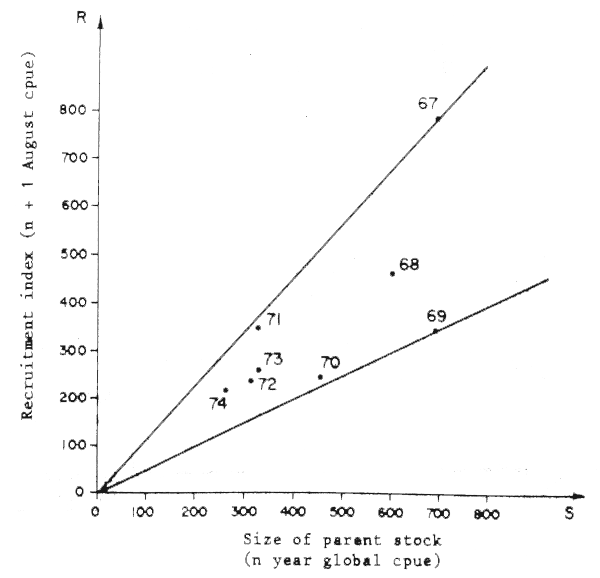
Fig. 18 Parent stock/recruitment ratio for Cape Blanc octopus