| Date* | Time | Vol.(m )† )† | Precipitation (mm) |
| 29 Nov.81 | start | - | - |
| 30 Nov.81 | 08.30 | 7 | 1.4 |
| 1 Dec.81 | 08.30 | 0 | 0 |
| 2 Dec.81 | 10.00 | 27 | 5.4 |
| 3 Dec.81 | 08.00 | 0 | 0 |
| 4 Dec.81 | |||
| 5 Dec.81 | |||
| 6 Dec.81 | 08.00 | 76 | 15.2 |
| 7 Dec.81 | 08.00 | 0 | 0 |
| 8 Dec.81 | 08.00 | 32 | 6.4 |
| 9 Dec.81 |
* Collector usually left for 24 hours before emptying, except for 2.12–5.12.81 (70 h) and 7.12–9.12.81 (48 h).
† Collector had a diameter of 8 cm (500 m glass beaker) and a cross sectional area of 50 cm2
| Date | Sample | pH | Alkalinity (meq/ ) ) | Iron (mg/ ) ) |
| 28.11.81 | P-29 (draining) | 7.50 | 1.58 | - |
| 28.11.81 | P-29 (draining) | 7.35 | 1.53 | - |
| 28.11.81 | P-29 (draining) | 7.33 | 1.52 | |
| 29.11.81 | P-29 (empty) | 7.28 | 3.68 | |
| 29.11.81 | P-1 | 7.03 | 1.05 | 2.0 |
| 29.11.81 | P-2 | 7.10 | 1.63 | 0.5 |
| 29.11.81 | P-3 | 7.27 | 1.55 | 0.7 |
| 29.11.81 | P-4 | 6.80 | 1.26 | 0.6 |
| 29.11.81 | P-5 | 7.02 | 1.20 | 1.0 |
| 29.11.81 | P-6 | 6.99 | 1.15 | 1.4 |
| 29.11.81 | P-7 | 6.65 | 1.08 | 1.5 |
| 29.11.81 | P-8 | 6.93 | 1.14 | 2.0 |
| 29.11.81 | P-9 | 7.01 | 1.30 | 2.0 |
| 29.11.81 | P-10 | 7.23 | 1.50 | 1.3 |
| 29.11.81 | P-11 | 7.25 | 1.62 | 1.3 |
| 29.11.81 | P-10 | 6.98 | 1.61 | - |
| 29.11.81 | P-23 | 6.65 | 0.66 | 4.1, 2.8 |
| 29.11.81 | P-25 | 6.53 | 0.54 | 2.4 |
| 29.11.81 | P-26 | 7.30 | 1.53 | 0.6 |
| 29.11.81 | P-27 | 6.93 | 1.01 | 1.2 |
| 29.11.81 | P-28 | 6.97 | 1.43 | 1.7 |
| 29.11.81 | P-29 | 7.50 | 1.53 | 2.1 |
| 29.11.81 | P-29 (PM) | 7.50 | 1.83 | - |
| 29.11.81 | P-33 | 6.93 | 1.55 | 2.0 |
| 29.11.81 | SG-2 | 7.30 | 1.38 | 0.7 |
| 29.11.81 | PG-8 | 6.83 | 1.21 | - |
| 29.11.81 | PG-25 | 7.31 | 1.40 | 1.3 |
| 29.11.81 | Canal opp P-1 | 7.17 | 1.66 | 0.1 |
| 29.11.81 | Stream opp MG-1 | 7.10 | 1.64 | 0.2 |
| 30.11.81 | P-1 | 6.22 | 0.68 | 2.4 |
| 30.11.81 | P-3 | 6.68 | 1.17 | 2.4 |
| 30.11.81 | P-10 | 6.54 | 1.11 | 9.2 |
| 30.11.81 | P-11 | 6.80 | 1.53 | 2.4 |
| 30.11.81 | P-14 | 7.33 | 1.67 | - |
| 30.11.81 | P-18 | 7.13 | 1.60 | 1.6 |
| 30.11.81 | P-19 | 7.45 | 1.65 | 1.2 |
| 30.11.81 | P-23 | 6.72 | 0.67 | 1.2 |
| 30.11.81 | P-24 | 7.22 | 1.46 | 1.4 |
| 30.11.81 | P-25 | 7.22 | 1.47 | 0.8 |
| 30.11.81 | P-28 | 7.51 | 1.62 | 5.0 |
| 30.11.81 | P-29 | 7.39 | 1.85 | 0.7 |
| 30.11.81 | P-30 | 7.23 | 1.38 | 2.4 |
| 30.11.81 | P-32 | 6.92 | 1.39 | 1.0 |
| 30.11.81 | P-33 | 7.23 | 1.66 | 3.6 |
| 30.11.81 | Stream opp PG 30 | 7.35 | 1.67 | - |
| Date | Sample | pH | Alkalinity (meq/ ) ) | Iron (mg/ ) ) |
| 1.12.81 | P-1 (North end) | 7.53 | 1.12 | |
| 1.12.81 | P-1 (South end) | ≃7.5 | 1.15 | |
| 1.12.81 | P-10 | 7.02 | 1.54 | 1.6 |
| 1.12.81 | P-23 | 6.90 | 0.83 | (0.5) |
| 1.12.81 | P-25 | 7.20 | 1.74 | 0.5 |
| 1.12.81 | P-28 | 7.12 | 1.51 | 1.4 |
| 1.12.81 | P-29 | 7.51 | 1.78 | 0.8 |
| 1.12.81 | Stream | 7.42 | 1.70 | 0.4 |
| 2.12.81 | P-1 (AM) | 7.45 | 1.15 | 1.1 |
| 2.12.81 | P-3 (AM) | 7.43 | 1.56 | 0.6 |
| 2.12.81 | P-10 (AM) | 7.47 | 1.57 | 0.9 |
| 2.12.81 | P-18 (AM) | 7.48 | 1.68 | 0.5 |
| 2.12.81 | P-20 (PM) | 7.40 | 1.71 | - |
| 2.12.81 | P-21 (PM) | 7.58 | 1.52 | - |
| 2.12.81 | P-23 (AM) | 6.73 | 0.62 | - |
| 2.12.81 | P-23 (PM)(bubbled) | 7.08 | 0.69 | - |
| 2.12.81 | P-23 (PM)(bubbled) | 7.88 | 0.72 | - |
| 2.12.81 | P-24 (AM) | 7.40 | 1.64 | 0.9 |
| 2.12.81 | P-25 (AM) | 7.28 | 1.62 | 0.6 |
| 2.12.81 | P-28 (PM) | 7.36 | 1.65 | - |
| 2.12.81 | P-29 (PM) | 7.50 | 1.72 | - |
| 2.12.81 | P-32 (PM) | 7.46 | 1.58 | - |
| 2.12.81 | P-33 (AM) | 7.34 | 1.66 | 0.7 |
| 2.12.81 | P-33 (PM) | 7.42 | 1.70 | - |
| 5.12.81 | P-3 | 7.51 | 1.59 | 0.6 |
| 5.12.81 | P-10 | 7.39 | 1.57 | 0.6 |
| 5.12.81 | P-11 | 7.20 | 1.65 | 2.4 |
| 5.12.81 | P-14 | 7.42 | 1.71 | 0.4 |
| 5.12.81 | P-14 | 7.36 | 1.70 | 0.8 |
| 5.12.81 | P-15 | 7.10 | 1.52 | 0.7 |
| 5.12.81 | P-16 | 6.74 | 1.40 | 4.6 |
| 5.12.81 | P-21 | 6.56 | 1.34 | 5.1 |
| 5.12.81 | P-28 | 7.02 | 1.53 | 1.1 |
| 5.12.81 | P-30 | 6.55 | 1.18 | - |
| 5.12.81 | P-30 | 7.33 | 1.44 | - |
| 5.12.81 | Stream | 7.50 | 1.60 | 0.5 |
| 5.12.81 | Stream | 7.50 | 1.74 | - |
| Date | Sample | pH | Alkalinity (meq/ ) ) | Iron (mg/ ) ) |
| 6.12.81 | P-1 | 7.70 | 1.15 | 0.3 |
| 6.12.81 | P-7 | 7.20 | 1.16 | 1.9 |
| 6.12.81 | P-18 | 7.39 | 1.56 | 0.8 |
| 6.12.81 | P-19 | 7.49 | 1.60 | 0.2 |
| 6.12.81 | P-23 | 6.82 | 0.67 | 2.0 |
| 6.12.81 | P-23 | - | 0.43 | 0.8 |
| 6.12.81 | P-23 (bubbled) | 7.58 | 0.68 | 0.7 |
| 6.12.81 | P-23 (bubbled) | 7.83 | 0.69 | 0.6 |
| 6.12.81 | P-24 | 7.35 | 1.43 | 7.2 |
| 6.12.81 | P-25 | 7.23 | 1.35 | 0.2 |
| 6.12.81 | P-29 | 7.62 | 1.54 | 1.0 |
| 6.12.81 | P-29 | 7.58 | 1.58 | 1.0 |
| 6.12.81 | P-29 (bubbled) | 8.12 | 1.56 | - |
| 6.12.81 | P-32 | 7.01 | 1.39 | 0.3 |
| 6.12.81 | P-33 | 7.46 | 1.60 | 2.0 |
| 6.12.81 | Stream | 7.46 | 1.63 | - |
| Chemical Species | Concentration | |
| NH4 | P-10 | 24 μM |
| P-23 | 49 μM | |
| P-25 | 31 μM | |
| P-28 | 15 μM | |
| P-29 | 11 μM | |
| Stream | 14 μM | |
| NO-2 | Several ponds | <0.1 μM |
| PO4 | Several ponds | <0.3 μM |
| HS- | Several ponds | <0.01 μM |
| Mn | Several ponds | <0.05 ppm |
Rust colored flocculant precipitate in Pond 23 (0.15 gm from 50 m volume): 63% Fe, by weight.
Table 4
SEDIMENTINTERSTITIAL WATER
COMPOSITION - POND 29 - CENTER
| Cell No.* | Fe+2, +3 (ppm) | HS- (μM) | SO4= (ppm) | NH4+ (μM) | PO43 (μM) | |
| 1 | 1.2 | 1300 | 25 | <1 | ||
| 2 | <6 | |||||
| 3 | 1.1 | 1400 | - | <1 | ||
| H2O | 4 | 6 | ||||
| Sed | 5 | 5.3 | 1100 | 66 | <1 | |
| 6 | <6 | |||||
| O2 | 7 | 13 | 1200 | - | <1 | |
| No O2 | 8 | <6 | ||||
| 9 | 40 | 1200 | - | <1 | ||
| 10 | 6 | |||||
| 11 | 38 | 1200 | 41 | <1 | ||
| 12 | 117 | |||||
| 13 | 2.3 | 1300 | - | <1 | ||
| 14 | 117 | |||||
| 15 | 9.3 | 1300 | 147 | <1 | ||
| 16 | 31 | |||||
| 17 | 1.4 | 1000 | 140 | <1 | ||
| 18 | 55 | |||||
| 19 | 3.2 | 900 | 487 | <1 |
| Cell No.* | Fe+2, +3 (ppm) | HS- (μM) | SO4= (ppm) | NH4+ (μM) | |
| 1 | 1 | 2000 | 16 | ||
| 2 | |||||
| H2O | 3 | 2 | 2200 | 82 | |
| Sed | 4 | <6 | |||
| 5 | 5 | 2000 | 31 | ||
| 6 | <6 | ||||
| 7 | 6 | 1900 | 38 | ||
| 8 | <6 | ||||
| 9 | 7 | 1900 | 62 | ||
| 10 | <6 | ||||
| 11 | 7 | - | 82 | ||
| 12 | <6 | ||||
| 13 | 7 | 1900 | 78 | ||
| 14 | <6 | ||||
| 15 | 29 | 1900 | 88 | ||
| 16 | <6 | ||||
| 17 | 11 | 1800 | 140 | ||
| 18 | <6 | ||||
| 19 | 14 | 1900 | 160 | ||
| 20 | ≃6 | ||||
| 21 | 12 | 1900 | 160 | ||
| 22 | ≃6 | ||||
| 23 | 13 | 1900 | 150 | ||
| 24 | <6 | ||||
| 25 | <1 | 1900 | |||
| 26 | <6 | ||||
| 27 | <1 | ||||
| 28 | <6 |
| Time (h) | Control | Bubbled | ||||
| Fe (ppm) | pH | Alkalinity (meq/  ) ) | Fe (ppm) | pH | Alakalinity (meq/  ) ) | |
| 0 | - | - | - | 4.9 | 6.81 | 0.67 |
| - | - | - | 2.6(F) | - | - | |
| 2 | 4.3 | - | - | 3.0 | - | - |
| 2.6(F)* | - | - | 0.7(F) | - | - | |
| 4.3 | 5.6 | 6.80 | - | 3.0 | 7.80 | 0.68 |
| 1.6(F) | - | - | 0.7(F) | - | - | |
| Pump off overnight | ||||||
| 0 | 3.4 | 6.85 | - | 1.5 | 7.35 | - |
| 1.5(F) | - | - | 0.4(F) | - | - | |
| 2 | 3.3 | 6.96 | - | 3.1 | 7.79 | 0.69 |
| 0.5(F) | - | - | 0.3(F) | - | - | |
| II Stream Water (3.12.81) | ||||||
| 0 | 0.5 | 6.95 | - | 0.5 | 6.96 | ≃1.6 |
| 0.1(F) | - | - | 0.1(F) | - | - | |
| 0.5 | - | 7.10 | - | - | 8.21 | - |
| 1 | - | 7.13 | - | - | 8.25 | - |
| 2 | 0.3 | 7.14 | - | 0.3 | 8.26 | - |
| 0.0(F) | - | - | 0.2(F) | - | - | |
| 2.5 | 0.2 | 7.20 | - | 0.5 | 8.26 | ≃1.6 |
| 0.1(F) | - | - | 0.3(F) | - | - | |
| III Pond 29 (6.12.81) | ||||||
| 0 | 1.1 | 7.49 | - | 0.8 | 7.49 | 1.58 |
| 0.1(F) | - | - | 0.2(F) | - | - | |
| 0.6 | 1.1 | 7.51 | - | 0.7 | 8.11 | - |
| 0.1(F) | - | - | 0.1(F) | - | - | |
| 2.5 | 0.8 | 7.55 | - | 0.6 | 8.12 | - |
| 0.1(F) | - | - | 0.1(F) | - | - | |
| 3 | 0.8 | 7.59 | - | 0.6 | 8.18 | 1.56 |
| 0.2(F) | - | - | 0.1 | - | - | |
* Sample filtered before analysis for iron.
Table 7
CARBON DIOXIDE PARTIAL PRESSURE CALCULATIONS
[H+] × [HCO3-] = [H2CO3] × K1
[H2CO3] = pCO2 × KCO 2
pCO2 = [H+] × [HCO3-]/K1 × KCO2
at S = 25‰ (Chlorinity = 13.8‰)
T = 25°C
K1 = 10-6.052 moles/liter
KCO2 = 3.12 × 10⁻² moles/liter-atmosphere
| Bubbling Experiment | Water Source | Alkalinity (meq/  ) ) | pH | pCO2 (x10-6 atm) |
| I-Begin | Pond 23 | 0.67 | 6.81 | 3700 |
| I-End | Pond 23 | 0.69 | 7.79 | 400 |
| II-Begin | Stream | ≃1.6 | 7.0-7.5 | 1800-5800 |
| II-End | Stream | ≃1.6 | 8.26 | 320 |
| III-Begin | Pond 29 | 1.58 | 7.49 | 1800 |
| III-End | Pond 29 | 1.56 | 8.18 | 370 |
| Sample | meq/100g | Initial pH |
| T-1 | (10)† | 3.29 |
| M-2a | 10 | 3.22 |
| M-3a | 20 | 3.75 |
| T-1 + 4.76% FeS2 | 70 | 2.00 |
| M-41 | 105 | 2.24 |
| M-3a + 4.76% FeS2 | 139 | 1.82 |
| M-41 + 4.76% FeS2 | 156 | 1.89 |
| T-1 + 9.09% FeS2 | 164 | 1.68 |
| M-2a + 4.76% FeS2 | 167 | 1.70 |
| M-3a + 9.09% FeS2 | 237 | 1.57 |
| M-2a + 9.09% FeS2 | 255 | 1.49 |
† All other samples of T-1 which were analyzed previously had potential acidities of <1 meq/100g.
| Sample | Sample weight (g) | Final Solution volume (m  ) ) | pH | Acidity (pH 7) (meq/100g) |
| M-2a* | 5 | 40 | 3.02 | 10 |
| M-2a* | 1 | 26.2 | 3.13 | 9.6 |
| M-2a* | 0.5 | 24.9 | 3.22 | 10 |
| M-2b* | 5 | 40 | 2.82 | 8.6 |
| M-2b* | 5 | 22.4 | 2.35 | 14 |
| M-2c* | 5 | 40 | 2.85 | 9.0 |
| M-2c* | 1 | 25.9 | 3.13 | 9.5 |
| M-3a+ | 5 | 40 | 3.89 | 6.2 |
| M-3a+ | 1 | 38.3 | 3.92 | 18 |
| M-3a+ | 0.5 | 25.4 | 3.75 | 20 |
| M-3b+ | 1 | 37.2 | 3.79 | 17 |
| M-3c+ | 5 | 40 | 3.83 | 7 |
| M-3c+ | 1 | 24.6 | 3.89 | 16 |
| M-3e§ | 5 | 40 | 4.48 | 4.6 |
| M-4† | 5 | 40 | 2.23 | 30 |
| M-4† | 1 | 21.6 | 2.08 | 151 |
| M-4† | 0.5 | 31.4 | 2.51 | 136 |
| M-4† | 0.5 | 20.4 | 2.24 | 105 |
| T-1Δ | 5 | 40 | 4.99 | 0 |
| T-1Δ | 1 | 18.1 | 5.40 | 0.4 |
| T-1Δ | 0.5 | 28.2 | 3.29 | 10 |
T-2 | 5 | 40 | 6.71 | 0 |
T-2 | 1 | 19.6 | 6.10 | 0.3 |
T-2 | 1 | 28.4 | 6.60 | 0.1 |
* Replicate soil samples from a large sample collected on the south dike of Pond 29.
+ Replicate sediment samples from a large sample collected near the south end of Pond 29.
§ Sample source as for other M-3 samples, but only particles >400 microns in size included.
† Dike soil from a new private pond facility in southeastern Johore State.
Δ Dike soil from a government aquaculture research station in Thailand.
 Dike soil from a traditional aquaculture pond in Thailand.
| Sample | Initial Acidity (meq/100g) | Final Acidity (meq/100g) | Δ (meq/100g) measured | Δ (meq/100g) theoretical† | Δ measured theoretical |
| T-1+4.76% FeS2 | 10 | 70 | 60 | 159 | .38 |
| T-1+9.09% FeS2 | 10 | 164 | 154 | 303 | .51 |
| M-2a+4.76% FeS2 | 10 | 167 | 157 | 159 | .99 |
| M-2a+9.09% FeS2 | 10 | 255 | 245 | 303 | .81 |
| M-3a+4.76% FeS2 | 20 | 139 | 119 | 159 | .75 |
| M-3a+9.09% FeS2 | 20 | 237 | 217 | 303 | .72 |
| M-4'+4.76% FeS2 | 105 | 156 | 51 | 159 | .32 |
† Maximum theoretical production of acidity was assumed to be 4 meq of H+ for each mM of FeS2.
| Sample | Titration Volume (m ) )pH 7 | Titration volume (m ) )pH 8 | Titration volume (m ) )pH 8.5 |  |
| T-1 | 0.02 | - | 0.034 | - |
| T-2 | 0.004 | 0.02 | 0.05 | - |
| M-2c | 0.366 | - | 0.521 | 1.42 |
| M-2a | 0.368 | - | 0.519 | 1.60 |
| M-4 | 2.17 | 2.67 | 2.87 | 1.32 |
| M-3a | 0.474 | 0.647 | 0.863 | 1.82 |
| M-3b | 0.452 | 0.612 | 0.771 | 1.71 |
| M-3c | 0.651 | 0.895 | >1.0 | >1.54 |
* Base (0.1 N NaOH) was added from a microburet to a sample volume of 10 m .
.
| Element | Dike Soil | Pond Sediment | |||||
| M-2a* | M-2b* | M-2c* | M-3a† | M-3b† | M-3c† | M-3d† | |
| Si | 34 | 35 | 34 | 29 | 28 | 27 | 27 |
| Al | 11.3 | 12.2 | 11.9 | 10.2 | 10.0 | 9.2 | 9.9 |
| Fe | 3.1 | 3.0 | 3.1 | 5.0 | 4.6 | 4.6 | 4.2 |
| Mg | 0.2 | 0.2 | 0.2 | 0.3 | 0.4 | 0.3 | 0.4 |
| Ca | <0.05 | <0.05 | <0.05 | 0.23 | 0.30 | 0.27 | 0.16 |
| Na | 0.1 | 0.1 | 0.08 | ≃4 | ≃7 | ≃9 | ≃7 |
| K | 1.5 | 1.3 | 1.4 | 1.4 | 1.2 | 1.2 | 1.0 |
| P | 0.01 | 0.01 | 0.01 | 0.02 | 0.02 | 0.02 | 0.02 |
| Mn | - | 0.03 | 0.02 | - | 0.02 | 0.02 | 0.02 |
| S | 1.00 | 1.03 | 1.00 | 1.20 | 1.38 | 1.31 | 1.02 |
| ∑ | 51.3 | 53.0 | 51.8 | 51.3 | 48.3 | 52.9 | 50.7 |
| Organic matter Δ | 5.1 | 5.4 | 5.5 | 6.5 | 5.9 | 5.7 | 5.5 |
* Replicate dike soil samples from a large sample from on site.
† Replicate sediment samples from a large sample from one site.
Δ Organic matter measured by oxidation overnight at 375°C after drying at 130°C.
| Santee Estates Dike Soil | Thailand Dike Soil |
| Johore, Malaysia |
| Element | M-4* | M-4'* | T-1† | T-lc§ | T-2+ |
| Si | 24 | 24 | 11 | 7 | 29 |
| Al | 7.7 | 8.2 | 2.6 | 1.8 | 8.4 |
| Fe | 3.7 | 3.3 | ≃7 | 5.6 | 8.2 |
| Mg | 0.8 | 0.7 | 0.4 | 0.2 | 2.5 |
| Ca | 0.82 | 0.81 | 0.15 | 0.12 | 0.96 |
| Na | 0.7 | 0.8 | ≃40 | >30 | 0.3 |
| K | 1.6 | 1.3 | 1.0 | 0.5 | 1.8 |
| P | 0.04 | 0.04 | 0.05 | 0.04 | 0.08 |
| Mn | - | 0.03 | 0.3 | 0.2 | 0.3 |
| S | 4.06 | 4.10 | 0.5 | 0.8 | 1.8 |
| Organic MatterΔ | 32.7 | 31.8 | 4.8 | - | 5.2 |
* Replicate dike soil samples from one site.
† Aquaculture station soil particles ground to fine powder.
§ Aquaculture station soil particles <400 μ.
+ Dike soil from traditional aquaculture farm near aquaculture research station.
Δ Organic matter measured by oxidation overnight at 375° C after drying at 130°C.
| Element | Resinous Yellow dike materials | Red dike materials | Pond water hydroxide precipitate | Ash from Johore brick kilns | ||
| M-1 | M-6 | M-7 | M-8 | M5a | M5b | |
| Si | 2 | 0.7 | 6 | 0.5 | 11 | 9 |
| Al | 0.7 | 0.2 | 3.8 | 0.03 | 2.7 | 4 |
| Fe | 0.6 | 0.6 | 28 | 0.1 | 1.5 | 1.2 |
| Mg | <0.1 | <0.1 | <0.1 | 14 | 6 | 5.7 |
| Ca | 0.04 | <0.05 | 0.07 | 0.5 | 19 | 19 |
| Na | 0.03 | 0.02 | 0.03 | 27 | 0.03 | 0.04 |
| K | 0.1 | 0.06 | 0.1 | 0.07 | 3.7 | 5.6 |
| P | 0.005 | 0.005 | 0.01 | 0.005 | 1.2 | 1.2 |
| Mn | 0.2 | 0.3 | <.01 | 0.01 | 0.1 | 0.1 |
| S | 0.6 | 0.3 | 0.9 | ≃4 | 3.1 | 5.2 |
| ∑ | 4.4 | 2.2 | 39 | 46 | 49 | 51 |
| Potential Excess Acidity (meq/100g) | Equivalent* FeS2 (wt %) | ΣS by XRF (wt %) | ΣFe by XRF (wt %) | |
| M-2† | 10 | 0.30 | 1.0 | 3.0 |
| M-3§ | 20 | 0.61 | 1.3 | 4.6 |
| M-4Δ | 130 | 3.9 | 4.1 | 3.5 |
T-1 | 0.4 | 0.01 | 0.5 | 7 |
| T-2+ | 0.2 | <0.01 | 1.8 | 8 |
* Assuming 4 meq H+ for each mM FeS2 = 33 meq H+/100g of sample.
† Gelang Patah dike soil (P-29).
§ Gelang Patah sediment (P-29).
Δ Santee Estates dike soil.
 Thailand aquaculture research station dike soil.
+Thailand traditional aquaculture dike soil.
| Sample | pH | Alkalinity (meq/ ) ) |
| Distilled H2O leach of P-29 dike soil - First | 3.64 | -6.2 |
| Distilled H2O leach of P-29 dike soil - Second | 3.98 | -2.5 |
| Distilled H2O leach of P-29 dike soil - First & Second† | 3.90 | -3.9 |
| Distilled H2O leach of P-29 dike soil - large particles | 3.93 | -3.4 |
| Stream H2O leach of P-29 sediment | 4.78 | +0.1 |
| Distilled H2O leach of Ash | 9.23 | +1.7 |
| Distilled H2O leach of Ash mixed with distilled H2O leach P-29 dike soil - large particles | 4.78 | -1.4 |
| Distilled H2O leach of Ash, followed by leach of P-29 dike soil (two step leach experiment) | 4.02 | -10.6 |
| Stream H2O stored with P-31 dike soil for 1 week | 4.36 | -0.1 |
* All experiments involved equal weights of solids and liquids.
† 1254 ml of H2O were added to 1254g of dry soil yielding 465m of leach-first; then 1489 ml of H2O were added to the same wet soil yielding 660 ml of leach-second; the two leach H2O's were pooled after 50 ml of each portion was withdrawn to measure alkalinity.
| Date | Sample | pH | Alkalinity (meq/  ) ) |
| 12/7/81 | Puddle in laterite following rain shower | 4.46 | +0.1 |
| 12/7/81 | Puddle on dike near P-30,31 following rain shower | 2.87 | -11.8 |
| 12/7/81 | Runoff from dike following rain shower | 2.74 | -15.3 |
| 12/7/81 | P-20 following rain shower, prior to stocking with shrimp | 7.30 | +1.30 |
| 12/8/81 | Pond filled for 6 months at Sante Estates* | 5.12 | 0.01 |
| 12/8/81 | Pond A filled for 1 week at Sante Estates* | 6.88 | 0.83 |
| 12/8/81 | Pond B filled for 1 week at Sante Estates* | 7.06 | 0.74 |
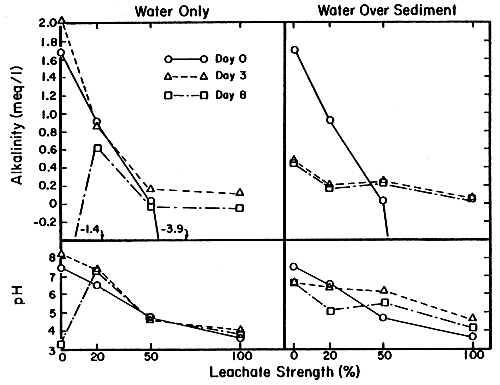
| Day | Leachate strength | Water only alkalinity | pH | Water over sediment alkalinity | Sediment pH |
| 0 | 1.83 | 7.50 | 1.83 | 7.50 | |
| 0 | 20 | 0.92 | 6.55 | 0.92 | 6.55 |
| 50 | 0.03 | 4.77 | 0.03 | 4.77 | |
| 100 | -3.91 | 3.90 | -3.91 | 3.90 | |
| 0 | 2.10 | 8.29 | 0.49 | 6.70 | |
| 3 | 20 | 0.87 | 7.42 | 0.22 | 6.40 |
| 50 | 0.16 | 4.70 | 0.25 | 6.20 | |
| 100 | -0.13 | 4.03 | 0.07 | 4.66 | |
| 0 | -1.44 | 3.21 | 0.42 | 6.64 | |
| 8 | 20 | 0.63 | 7.39 | 0.19 | 5.08 |
| 50 | -0.01 | 4.69 | 0.21 | 5.59 | |
| 100 | -0.02 | 3.88 | 0.06 | 9.17 |
Table 19
ESTIMATES OF TOTAL POTENTIAL ACIDITY IN DIKES OF
GELANG PATAH AQUACULTURE SYSTEM
Area = 10 ha = 105m2
Soil Depth = 1 m (assumed thickness which can react with the water).
∑ Volume = 105 m3
∑ Mass = 105 t (assumed density = 1g/lm )
)
If potential acidity = 10 meq/100g
then total moles of acid available = 10 7
If potential acidity = 100 meq/100g
then total moles of acid available = 108
Use same ∑ mass as above,
assume 1% by weight pyrite
then total pyrite present = 103t
If 4 moles of H+ produced per mole of pyrite
then total moles of acid available = 3 × 10⁷
Total Acid Potential: 107 – 108 moles
Table 20
ESTIMATES OF RATES OF REMOVAL OF ACIDITY
AT GELANG PATAH AQUACULTURE SYSTEM
Exchange of Pond Water by Present Practices
10 ha × (102m) 2/ha × 1 m/4 days = ≃ 2 × 10⁴ m3/day
If 20% of alkalinity in water is removed (1.6 meq/ →1.3 meq/
 )
)

Leaching of Dike Soils by Precipitation

III. Maximum Leaching of Dike Soils by Filling Entire System with Stream
Water-Acidity from leaching experiments (-6 meq/ of alkalinity)
≃ 20 × as effective per unit volume of water as present pond water
exchange.
If filled to 2 meters depth (8 × daily exchange depth) 20 × 8 = 160 160 × 6 × 103 moles of acid = 106 moles of acid per fill
1 ton of Limestone = 2 × 10⁴ moles of alkalinity
1 ton of Magnesium Limestone = 2.2 × 10⁴ moles of alkalinity
1 ton of Ash = 2 moles of alkalinity

Figure 1
Gelang Patah Pond Layout
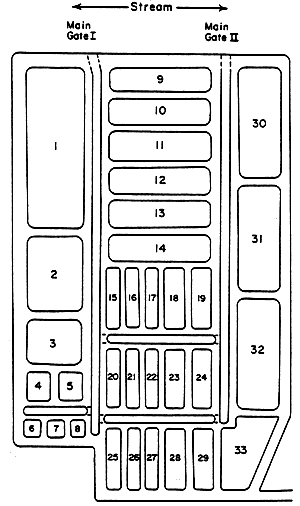
Figure 2
Gelang Palah Water Alkalinities
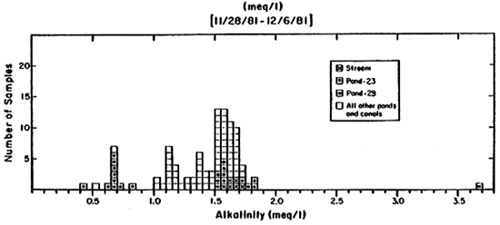
Figure 3
Gelang Palah Water Iron Concentrations (Total)
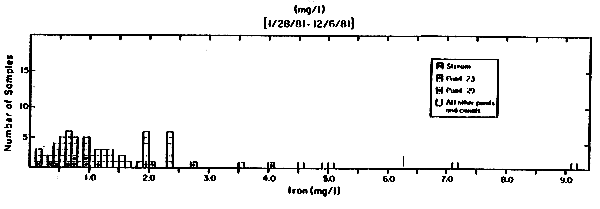
Figure 4
Sediment Interstitial Water
Pond 29-Center
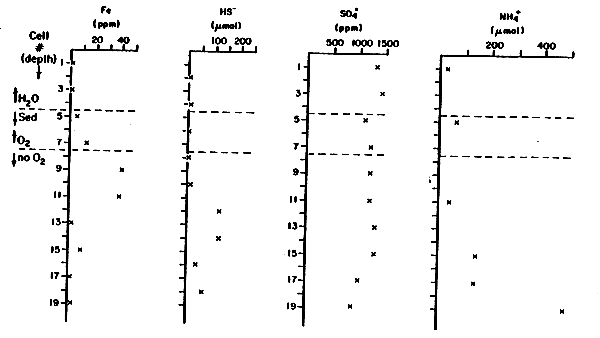
Figure 5
Sediment Interstitial Water
Pond 29-Margin
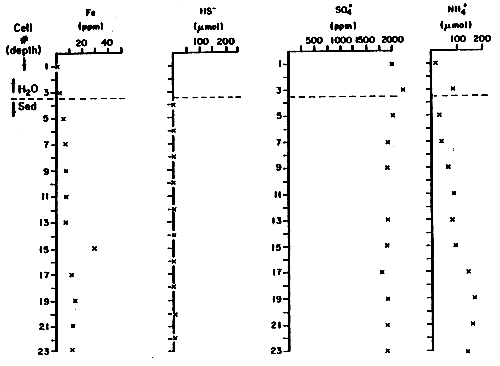
Figure 6
Potential Acidity vs. pH
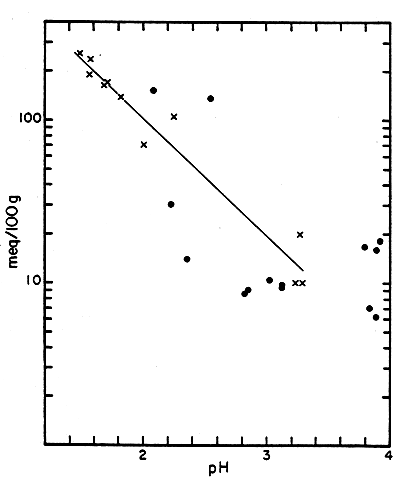
Figure 7
GELANG PATAH WATER-SEDIMENT INCUBATION EXPERIMENTS
