7.2.1 General
7.2.2 Cost model
7.2.3 Comparative costing
Accurate costing can only be done when local requirements, prices and economics are known.
Costing can also be involved and complicated in order to benefit from any concessions likely to apply, therefore, final calculations should be done by a competent person familiar with local conditions.
Prices and costing methods used in this document should therefore only be used in the absence of more precise instructions, since they are only likely to provide a crude guide for provisional budgeting purposes in most situations.
During the planning stages of a project, a number of costings require to be made to determine the overall viability of the project and also to make comparisons when a choice exists between using different types of equipment and processing methods. Preliminary costings also allow the effect of all likely variations on prices and profits to be assessed, and the longer term viability of the project can thereby be determined.
One approach, when making a case study, is to use costing methods to compute the prices that have to be paid to the fishermen for raw material supplies. For this purpose, an Internal Rate of Return (IIR) is assumed and discounted cash flow techniques are applied to compute the amount available each year for the purchase of fish and hence the price per ton that can be paid.
Using the basic model, the sensitivity of various changes, such as the selling price of the finished product and labour costs, can be tested and allowances can thereby be made for variations that are likely to apply.
Before examining in detail the various investment possibilities, planners should be aware of certain important characteristics. Firstly, fish supplies are heavily dependent on the weather and this may result in wide variations in the catch on both a daily and seasonal basis. Secondly, the relation between the effort that is expended in gathering fish and the actual yield is rather tenuous and only experience will give correct values.
Glut and periods of shortages are common and this may greatly effect the economics of the processing and freezing operation.
The introduction of a fish processing complex in a new area may impinge on traditional rates and patterns of activity in the community and this will have to be taken into account at the planning stage.
The new complex may itself overstimulate the fishing effort, and since fish stocks are finite, consideration will have to be given to this and other wider effects that may result from the implementation of the proposals.
The operation requires a high investment involving considerable risks, therefore, it will be necessary to ensure sustained effective management in order to realize the anticipated benefits.
The model used in the case study is based on a prawn processing and freezing operation and the principles and methods involved in the costing exercise will be substantially the same for other products and processes.
The main elements of the prawn processing operation are shown in the flow diagram, Figure 73.
The process has been designed to produce blocks of prawns frozen in trays in horizontal plate freezers. This is a widely used method of freezing which allows the product to be frozen with water added to form solid blocks, which is a form of presentation required by many importers.
The production of whole frozen prawns makes allowance for 5% waste/loss, thus 237 t of raw material requires to be purchased to sustain an output of 225 t of whole frozen prawns.
In the headless frozen prawn calculations a yield of 60% is assumed with an overall waste/loss of 5%, thus 394 t of prawns have to be purchased to sustain an annual output of 225 t of headless, raw prawns.
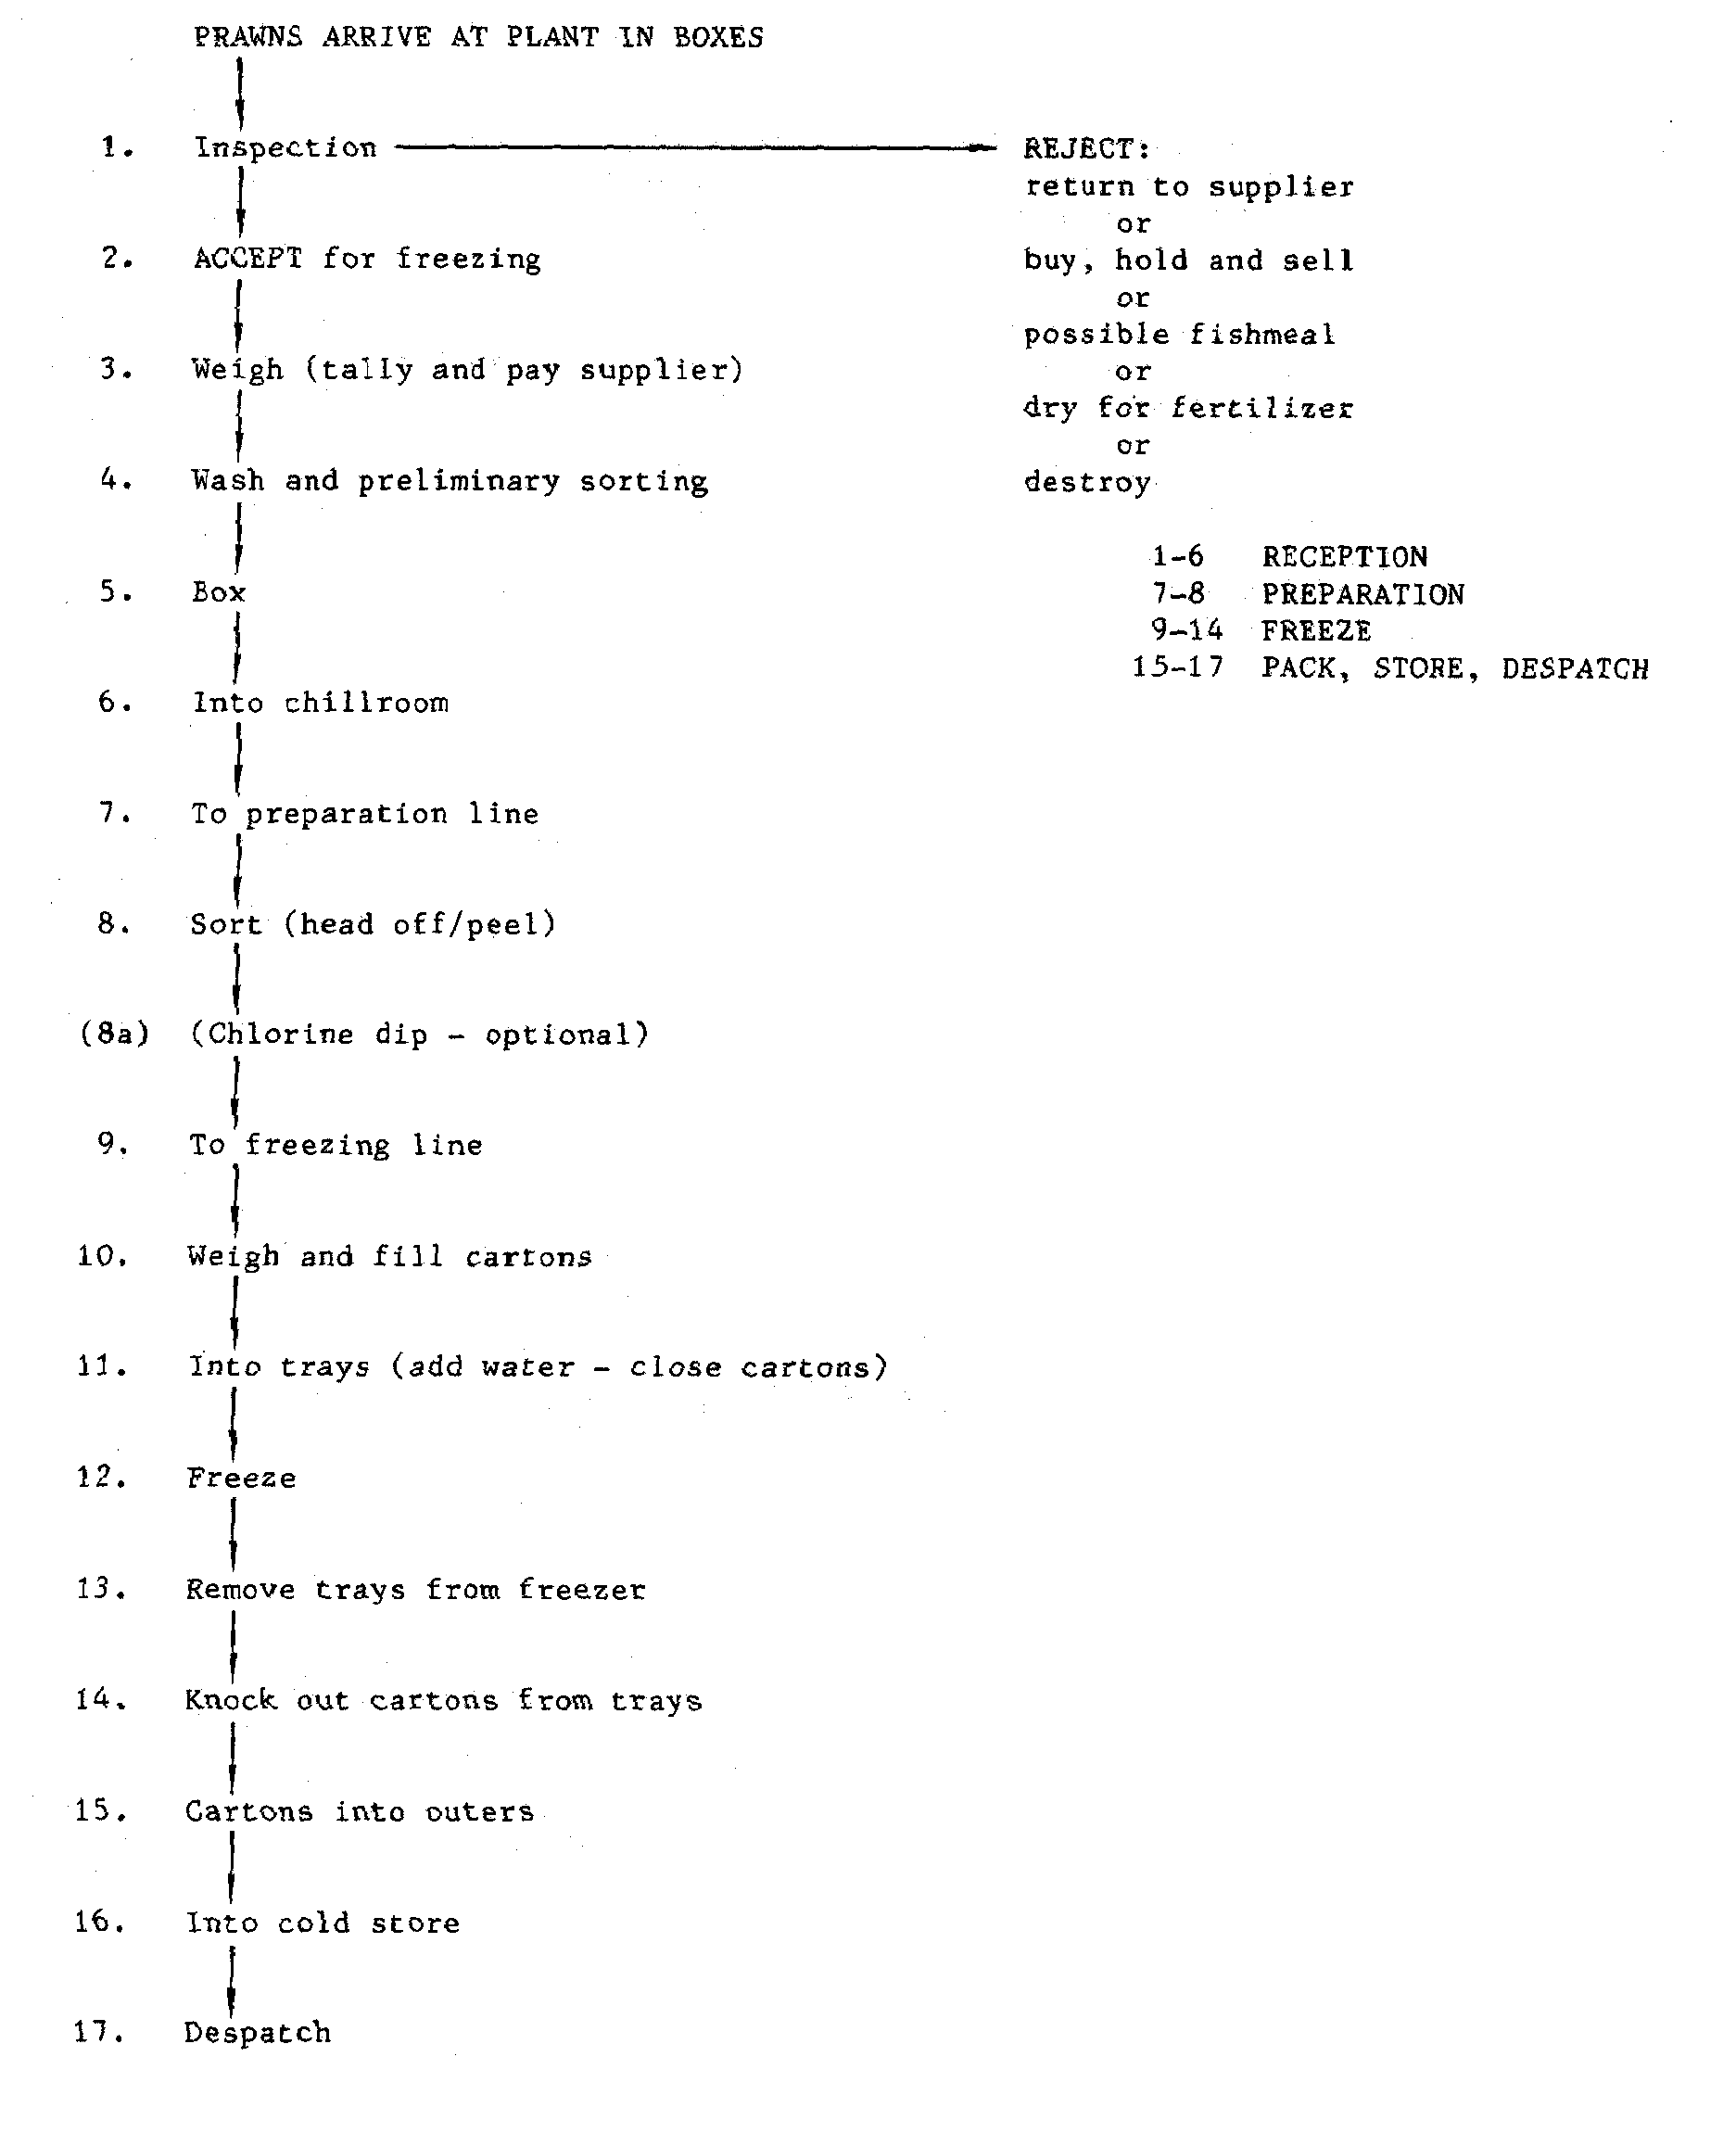
Figure 73 Product flow for prawn processing
Each point is equipped with a refrigerated chillroom for storing iced prawns prior to processing and a low-temperature cold store for the finished product. Chillroom capacity is generous and allows for the storage for up to 10 days supply of material. The reason for this is that although this storage time would not be recommended for prawns prior to freezing other fish are often caught as a by-catch and some of these may be stored prior to dispatch to local fresh fish markets or other processing lines.
The cold store is designed to hold up to one month the output of finished product which is the maximum holding time usual in production cold stores. Longer storage times should therefore involve the use of better equipped and larger bulk stores.
A flake-ice plant has been included in the model, but this may not be necessary in some situations where adequate supplies of ice are available. In the model it is assumed that three parts of ice to one part of prawns is required for cooling and keeping the prawns chilled from the time of catching until they are frozen. Ice requirements, however, are generally less for cheaper fish products, and they will vary depending on the time and temperatures involved and also re-icing requirements.
The costs include the supply of an appropriate stock of high density polyethylene fish boxes and that rental fees to fishermen would be sufficient to offset replacement costs, and thereby no allowance is made for replacements.
Two sets of trays have been allowed to enable one lot to be packed and prepared while the other is frozen. .
It is assumed that the plant operates with two eight-hour shifts on 250 days/year. In situations where there is a shorter working year due to the seasonal nature of the fishery, consideration should be given to operating a three-shift system to optimize the use of plant and equipment and reduce overhead costs per unit weight of product. A number of other operational patterns are possible, but in a model -whatever pattern is used -it is assumed that the chillroom and cold store facilities are operational at all times.
When costings are made to compare one type of equipment with another, or to determine the effect of changes in operating conditions, it is important to ensure that all relevant costs are included and that the conditions applied are applicable to the situation under consideration.
Manufacturers' costs tend to be for conditions which favour their own equipment and they are also likely to quote figures based on the best performance rather than those relating to average commercial operating conditions. Another recent trend is to use computer predictions rather than practical measurement for determining data used in costing and, again, this information may not be realistic. Since published figures are likely to be unreliable, comparative costings are more likely to be accurate if they are based on previous experience with the same, or similar, equipment. The following are some of the situations which may arise, that are known to give inaccurate or misleading comparative costings:
Some costs may not, at first, be associated with the equipment under consideration and, therefore, not be included in the costing. For example, if more space is required by one of the units under consideration, then building costs should be correctly proportional to take account of this. Other examples are when one unit requires additional services, such as electrical and water supplies and this involves additional expenditure on new or improved facilities.
The difference between one choice and another may mean a relocation of labour rather than an increase or reduction. For example, a batch freezer may need only a few minutes to load and unload the freezer and the labour requirement may be considered to be less than that required by a continuous freezer which needs constant attention. The batch freezer's main labour requirement, however, has been merely transferred to another location where trays and trolleys are loaded, and this labour cost should also be taken into consideration.
Some of the costs more readily associated with different types of equipment are often inaccurate. Example of this is that the weight lost by the product during freezing can vary between one type of freezer and another and, rightly, this should be taken into account when making a comparative costing. However, inaccurate figures are often used; usually, as the result of making unrelated comparisons, and for guidance on this subject, reference should be made to "Freezing in Fisheries".
The choice made for the period of capital depreciation can also make a considerable difference to the result of a comparative costing. A short-term costing would be in favour of a choice which had a low capital cost and high operating cost, whereas a longer period of depreciation would favour equipment with a high capital cost and low operating cost. Care should therefore be taken when making comparative costs that capital depreciation times are realistic and applicable to the situation. It is possible, due to differences in the circumstances which relate to the choice under consideration, that different periods of depreciation can be applied to the various options.
A procedure wrongly used in comparative costing is to isolate one cost which may obviously be different between the various choices and make overall decisions based on this comparison, which may -not be valid if the cost is placed in its time perspective within the total cost of the operation.
Calculating the cost of changing, the operational temperature of a cold store is an example which can be used to demonstrate the effect of this type of costing. From Table 5 it can be calculated that the power requirement for operating a cold store at -30�C can be about 30% higher than for the store operating at -20�C, and this is of obvious significance to the store operator. An overall cost, however, has been made which shows that operating at -30�C is only about 4% more costly than at -20�C. When it is further considered that cold storage costs may only account for about 8% of the cost to the consumer, the increase in cost may therefore be insignificant compared to the potential benefits in terms of product quality.
Other information on costing, together with individual costings for freezing and Cold storage operations , is given in "Freezing in Fisheries" .
Table 74 Labour requirements
| Position | Salary/ month (US$) |
No. |
| Manager | 1 125 |
1 |
| Personal assistant | 225 |
1 |
| Shift supervisor | 560 |
2 |
| Clerk/cashier | 337 |
2 |
| Mechanic | 150 |
2 |
| Tally man | 135 |
2 |
| Reception: | ||
| Foreman Labourers |
112 |
2 |
| Freezing: | ||
| Foreman Labourers |
112 |
2 |
| Cold store: | ||
| Foreman Labourers |
112 |
2 |
Table 75 Capital costs
No. |
Item |
US$ |
1 |
Building | 33 750 |
2 |
Plate freezer | 22 275 |
3 |
Chillroom | 9 900 |
4 |
Cold store | 17 550 |
5 |
Freezer trays | 2 925 |
6 |
Fish boxes | 6 187 |
7 |
Ice plant | 19 800 |
8 |
Ice storage bin | 4 950 |
9 |
Standby generator | 13 983 |
10 |
Weighing machine | 675 |
11 |
Work tables | 4 500 |
12 |
Steam cleaner | 2 925 |
13 |
Production line items | 4 950 |
14 |
Office equipment, clothing, etc. | 4 950 |
15 |
Pick-up truck | 2 375 |
| Sub-total 10% contingency |
151 695 |
|
| Total CIF at 20% items 2-15 10% installation and commissioning items 2-15 |
166 864 |
|
| Grand total | 202 247 |
Notes:
1- 250 m� @ US$ 135/m�
2 - 4-station mini-freezer; total charge 180 kg; 5 charges/day
3 - 10-t capacity, temperature range -1� to +1�C
4 - 20-t capacity, design temperature -30�C
5 - 30 x 2
6 - 500
7 - 2.7 t/24 h
8 - Local construction
9 - 70 kVA
10 - 100-kg flat bed
11 - 6 of each; stainless steel top, wooden supports
12 - One, with water input, diesel powered
Table 76 Operating costs
| No | Item |
US$ |
| 1 | Labour | 83 700 |
| 2 | Power | 28 125 |
| 3 | Packaging | 29 812 |
| 4 | Water | 262 |
| 5 | Insurance, spares, maintenance, repairs | 7 762 |
| Total | 149 661 |
Notes:
1- See Table 74
2- 250 000 kWh @ US$ 0.1 125/unit
3- 450/day, 2-kg inners, plus 45/day of 20 kg outers
4- 1 000 t@ US$ 0.56/1 000 litres
Calculation of the annual cash available for the purchase of raw material can be a rather involved accountancy procedure and it is beyond the scope of this document to deal with this aspect in detail, especially since procedures will also vary depending on local circumstances. The procedure used is therefore an elementary one which does not take account of the finer elements of accountancy, but it should be sufficient for an initial costing at the planning stage of a project.
US$ |
US$ |
|
| First cost | ||
| Buildings and equipment(Table 75) | 202 247 |
|
| Annual fixed costs | ||
| Depreciation (10%) Interest ( 10%) Insurance and taxes (4%) Capital maintenance (4%) |
20 224 |
|
| Operating costs | ||
| Labour, power, water, etc. (Table 76) | 149 661 |
|
| Total annual charges | ||
| Fixed Operating |
56 626 |
|
| Total | 206 287 |
|
Table 77 Derived raw material prices for the production of frozen whole prawns
Ex-plant price/kg |
Annual income |
Annual costs |
Annual cash for raw
material |
Raw material
requirement |
Derived landed
price/kg |
2 |
450 000 |
206 287 |
243 713 |
237 |
1.01 |
4 |
900 000 |
206 287 |
693 713 |
237 |
2.93 |
6 |
1 350 000 |
206 287 |
1 143 713 |
237 |
4.82 |
8 |
1 800 000 |
206 287 |
1 593 713 |
237 |
6.72 |
Table 78 Derived raw material prices for the production of frozen headless prawns
Ex-plant price/kg |
Annual income |
Annual costs |
Annual cash for raw
material |
Raw material
requirement |
Derived landed
price/kg |
3 |
675 000 |
206 287 |
468 713 |
394 |
1.19 |
6 |
1 350 000 |
206 287 |
1 143 713 |
394 |
2.90 |
9 |
2 025 000 |
206 287 |
1 818 713 |
394 |
4.61 |
12 |
2 700 000 |
206 287 |
2 493 713 |
394 |
6.33 |
The derived raw material prices in Tables 77 and 78 show the effect of variations in the ex-plant selling price for two products. Other variables, such as labour, water and power costs, can be introduced into the calculations and thereby all likely cost combinations can be explored at the planning stage.
Table 79 Enthalpy and apparent specific heat of cod flesh
Temperature |
Enthalpy |
Apparent |
-40 |
0.00 |
0.44 |
-36 |
1.77 |
0.45 |
-32 |
3.60 |
0.47 |
-28 |
5.55 |
0.51 |
-24 |
7.67 |
0.55 |
-20 |
10.03 |
0.62 |
-16 |
12.69 |
0.72 |
-14 |
14.18 |
0.78 |
-12 |
15.84 |
0.87 |
-10 |
17.73 |
1.01 |
-8 |
19.99 |
1.27 |
-6 |
23.01 |
1.85 |
-4 |
28.05 |
3.61 |
-2 |
42.16 |
15.68 |
0 |
77.16 |
0.99 |
2 |
78.90 |
0.87 |
4 |
80.65 |
0.87 |
6 |
82.39 |
0.87 |
8 |
84.14 |
0.87 |
10 |
85.89 |
0.88 |
12 |
87.64 |
0.88 |
14 |
89.39 |
0.88 |
16 |
91.14 |
0.88 |
20 |
94.65 |
0.88 |
24 |
98.17 |
0.88 |
28 |
101.69 |
0.88 |
32 |
105.21 |
0.88 |
36 |
108.73 |
0.88 |
40 |
112.25 |
0.88 |
Notes:
Enthalpy is the heat content of the fish measured above an
arbitrary datum of -40�C.
The change in enthalpy between 10�C and -30�C will therefore
indicate the amount of heat that has to be removed when freezing
fish.
Specific heat is the heat that has to be added or subtracted to change the temperature of the fish by 1�C. In the Table, this is listed as apparent specific heat since at temperatures below 0�C, it consists of a combination of both sensible and latent heat.
![]()
![]()
![]()