Some Canadian purse seiners have operated in the Gulf of Guinea from 1968 to 1976. The strength of this fleet appears in table 4.2. One can consider that these purse seiners are identical to those of the U.S.A. fleet and operate strictly in the same manner. Here we will not repeat detailed examination of the changes in this fleet and we will refer to the review of the U.S.A. purse seine fleet (paragraph 4.5.18).
Table 4.25 Mean weight of skipjack caught by the principal fleets operating in the study area.
| YEAR | BAITBOATS | SEINERS | ||||||
| F I S | CAPE VERDE | TEMA | ANGOLA | F I S | U S A | SPAIN | JAPAN | |
| 1972 | 2.80 | * | * | * | 3.10 | 2.00 | * | * |
| 1973 | 2.80 | * | * | * | 3.10 | 1.90 | * | 1.80 |
| 1974 | 2.80 | * | * | * | 2.30 | 1.90 | * | 2.20 |
| 1975 | 2.40 | * | 2.40 | 1.60 | 2.90 | 2.30 | * | 2.10 |
| 1976 | 2.00 | * | 1.90 | 1.60 | 2.10 | 2.20 | * | - |
| 1977 | 2.20 | * | 2.30 | 1.60 | 2.20 | 2.00 | * | - |
| 1978 | 2.30 | * | 2.00 | 1.70 | 2.50 | 2.00 | 2.70 | - |
| 1979 | 2.30 | * | 1.90 | 1.70 | 2.50 | 2.20 | 2.10 | - |
| 1980 | 2.30 | 2.80 | 1.90 | 1.60 | 2.40 | 3.00 | 2.20 | - |
| 1981 | 2.40 | 2.30 | 1.80 | 1.80 | 2.40 | 1.10 | 2.00 | - |
| 1982 | 2.70 | 2.90 | 2.10 | 1.90 | 2.20 | 1.90 | 2.10 | * |
| 1983 | 2.60 | * | * | * | 2.20 | 1.90 | * | * |
- No fishery
* Fishery, but data unavailable
Table 4.26 Mean weight of bigeye caught by the principal fleets operating in the study area.
| YEAR | BAITBOATS | SEINERS | LONG-LINERS | ||||
| F I S | TEMA | CAPE VERDE | F I S | U S A | SPAIN | ||
| ALL COUNTRIES | |||||||
| 1970 | - | - | - | - | - | - | 55.1 |
| 1971 | - | - | - | - | - | - | 52.5 |
| 1972 | - | - | - | - | - | - | 48.4 |
| 1973 | - | - | - | - | 10.7 | - | 48.2 |
| 1974 | - | - | - | - | - | - | 51.6 |
| 1975 | 7.3 | 2.8 | - | 12.2 | 33.5 | - | 53.0 |
| 1976 | 8.6 | 2.3 | - | 4.3 | 13.9 | - | 56.8 |
| 1977 | 11.1 | 3.0 | - | 6.6 | 3.2 | - | 51.5 |
| 1978 | 9.6 | 2.6 | - | 9.7 | 10.1 | 10.2 | 53.1 |
| 1979 | 10.0 | 3.5 | - | 5.9 | 19.4 | 6.8 | 44.2 |
| 1980 | 10.4 | 2.8 | 38.1 | 4.5 | 4.6 | 4.0 | 46.6 |
| 1981 | 7.4 | 2.7 | 36.2 | 4.1 | 11.3 | 4.9 | 48.7 |
| 1982 | 9.4 | 2.6 | 38.6 | 5.2 | 11.1 | 5.3 | 46.6 |
| 1983 | 10.1 | - | - | 4.7 | - | - | - |
The several fleets operating from the Cape Verde Islands are among the most oldest in the east Atlantic:
The fishing statistics of these various fleets are at unequal levels and not available for several years (tables 4.9, 4.10 and 4.13); they do not allow the reconstruction of the Cape Verde fisheries history. These fisheries are however probably very old, yellowfin always seeming to have been one of the principal protein sources of the population, and having been exploited artisanally for a number of decades.
There are no reliable statistics for the Cape Verde fleets except for the recent period, i.e. since 1980, but these fisheries are probably very old (Costa, 1960). The tuna fleets of the Cape Verde Islands an be stratified into three homogeneous types of fishing:
small boats: these are boats without decks, based on beaches. These boats are propelled by sails, oars or outboard motors. They measure 4–5 m long and go out daily in the vicinity of their home beach. These boats catch tuna, principally large yellowfin and Acanthocybium by using deep hand lines and by trolling. In the last census (Hanek et al., 1984), there were 1173 boats, of which 394 were motorized. These boats alternate according to the relative abundance of tuna, either fishing for demersal species of for tuna. The bulk of catch is destined for the local consumer market, a fraction being canned locally.
ice-carrying baitboats: there are around 30 boats from 5–70 G.R.T. that fish for tuna with live bait. These boats also make day trips.
freezer baitboats: three freezer baitboats, belonging to a state owned company, operate in Cape Verde waters alternating with other Atlantic (Sao Thome, Angola) and Indian Ocean (Mozambique) zones. These baitboats in general go out for several days after catching live bait in the proximity of the islands.
These statistics are not available by 1°. However it is known that tuna fishing takes place generally in the zone situated immediate proximity of the islands and nearby high seas known as the “archipelagic zone”. The exploited species are tuna with generally tropical ecologic affinities are caught principally during the warm season, i.e. from June to November; the tuna are generally caught however during the whole year.
Each of the three Cape Verde fleets, small boats, ice baitboats and freezer baitboats, exert their fishing effort on different species and sizes:
the small boat fleet catches an average (from 1981–83, M.H. Vieira, pers. com.) of 65% yellowfin and 33% Acanthocybium.
the ice baitboat fleet catches an average of (from 1981–83) 45% yellowfin, 50% skipjack and 5% bigeye. There are no statistics prior to 1980 to estimate variation of this species composition, even though these two fleets are old.
the freezer baitboat fleet catches are characterized by a large dominance of skipjack, an average of 87%, and by the catch of a small percentage of yellowfin (an average of 12% from 1981–83).
Tuna catches by the Cape Verde fleets have been the object of intensive sampling since 1980. These samples reveal the following characteristics: yellowfin caught by small boats are generally a large size, between 60 cm and 160 cm, with an average length of around 120 cm (M.H. Vieira pers. com.). These sizes are comparable, although lightly smaller, to those of the longliners operating in the sector. These similar sizes are due probably to the fact that the small boats generally fish tuna at depths comparable to those at which the traditional longliners operate (lines with a length varying from 150 to 450 meters). Yellowfin and bigeye caught by ice baitboats are in the same size range as those captured by the small boats; one notes however that the large fish (for example more than 80 cm.) are rare and that the dominant size in the catch is between 50 and 70 cm. Skipjack are generally “average” sized, between 40 and 55 cm. in fork length.
The Taiwan fleet is composed exclusively of longliners which have operated in the Atlantic since 1962. The fishing statistics of this fleet are only available from 1969. During the initial period (1962 to 1968), it was considered that these longliners operated in a similar fashion to those of Japan, a country for which the statistics are excellent. This fleet operates in all of the Atlantic, accounting for an important and growing part of catches in sectors not situated in the study zone.
The Taiwan fleet is exclusively composed of longliners. The total number of Taiwanese longliners in operation in the Atlantic (only a variable fraction of this fleet exercises its fishing effort in the study zone) is known from statistics submitted to the ICCAT (table 4.27).
 |  |
 |  |
 |  |
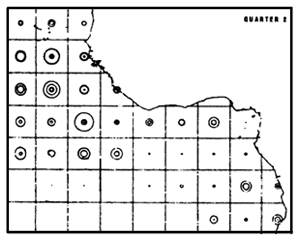 | 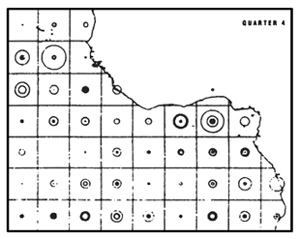 |
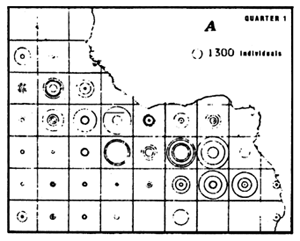
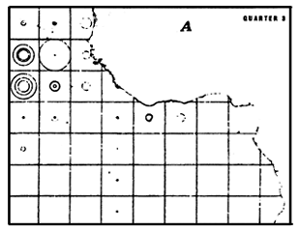
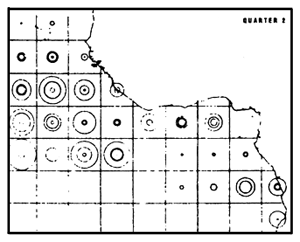
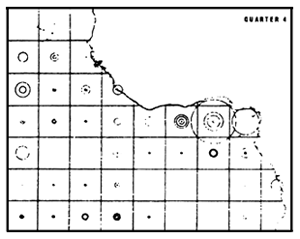
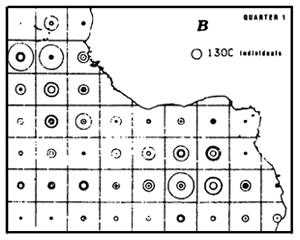
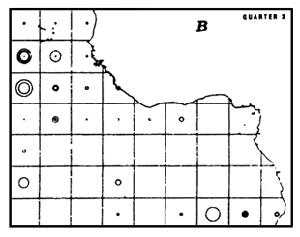
Figure 4.19 Quarterly catches of yellowfin (a) and bigeye (b) by the Taiwanese longline fleet, in number of individuals per 5° square, during the period 1969 to 1972. Each circle represents the catch during each quarter of a year (the catches observed each year are superimposed on the 5° sectors).
Table 4.27 Numbers of Taiwanese (province of China) longliners in operation in the Atlantic and percentage of effort exerted in the study area.
| YEAR | TONNAGE | TOTAL | EFFORT IN THE ZONE | ||
| 51–200 TX | 201–500 TX | +500 TX | |||
| 1966 | 0 | 0 | 0 | 0 | |
| 1967 | 5 | 5 | 2 | 12 | ? |
| 1968 | 31 | 49 | 1 | 81 | ? |
| 1969 | 26 | 88 | 5 | 119 | 39 |
| 1970 | 17 | 104 | 4 | 125 | 32 |
| 1971 | 9 | 95 | 4 | 108 | 40 |
| 1972 | 15 | 126 | 3 | 144 | 25 |
| 1973 | 23 | 141 | 2 | 166 | 15 |
| 1974 | 25 | 191 | 2 | 218 | 13 |
| 1975 | 20 | 141 | 4 | 165 | 16 |
| 1976 | 41 | 187 | 2 | 230 | 8 |
| 1977 | 45 | 186 | 3 | 234 | 13 |
| 1978 | 45 | 181 | 1 | 227 | 10 |
| 1979 | 35 | 158 | 1 | 194 | 7 |
| 1980 | 21 | 146 | 1 | 168 | 12 |
| 1981 | 29 | 161 | 0 | 190 | 15 |
| 1982 | 40 | 173 | 0 | 213 | 9 |
| 1983 | 13 | 86 | 0 | 99 | - |
Table 4.28 Numbers of Cuban longliners in operation in the Atlantic and percentage of effort exerted in the study area.
| YEAR | TONNAGE (TX) | TOTAL | %EFFORT IN THE ZONE | ||
| 51–200 | 201–500 | +501 | |||
| 1965 | 0 | 4 | 0 | 4 | ? |
| 1966 | 0 | 4 | 5 | 9 | ? |
| 1967 | 0 | 4 | 14 | 18 | ? |
| 1968 | 0 | 4 | 15 | 19 | ? |
| 1969 | 0 | 1 | 10 | 11 | ? |
| 1970 | 0 | 1 | 13 | 14 | ? |
| 1971 | 0 | 1 | 18 | 19 | ? |
| 1972 | 0 | 3 | 22 | 25 | ? |
| 1973 | 0 | 0 | 23 | 23 | 100 |
| 1974 | 0 | 0 | 23 | 23 | ? |
| 1975 | 0 | 0 | 23 | 23 | 77 |
| 1976 | 0 | 0 | 23 | 23 | 64 |
| 1977 | 0 | 4 | 20 | 24 | 74 |
| 1978 | 0 | 4 | 20 | 24 | 77 |
| 1979 | 0 | 4 | 20 | 24 | 96 |
| 1980 | 0 | 3 | 19 | 22 | 90 |
| 1981 | 2 | 3 | 18 | 23 | 64 |
| 1982 | 2 | 3 | 18 | 23 | 62 |
| 1983 | 9 | 0 | 18 | 27 | - |
The Taiwan longliners seem, during 1962–70, to have operated largely in the study zone (figure 4.19). In 1969 and 1970, 39% and 32% of longliner effort was exercised in this zone. Recently, the fishing zones have progressively decentralized toward the north and south as a result of a change in target species from yellowfin to albacore. Recently only a minor fraction of fishing effort (13% from 1972 – 82) is exercised in the study zone, principally in the north and south fringes (contrary to the Cuban and Korean longliners that principally exploit the central zone).
The best catch estimates by species of the Taiwanese longline fleet in the zone are given in tables 4.7 and 4.12. There one sees a specific composition characteristic of longliner catches in the zone with, however, a lower proportion of yellowfin than other fleets. One notes from 1975 to 1982 for all species, a strong decrease in total catch linked, on one hand, to the low abundance of stocks exploited by long line, and on the other, to the reduction in fishing effort in the zone.
The sizes caught by the Taiwanese fleet are known and published since 1975 thanks to a sampling system put in practice by ICCAT. The fish caught are always large sizes, typical of longliners. Figure 4.20 represents the sizes of yellowfin and bigeye caught by longliners in the sector.
The Taiwanese fleet catch rates are known since 1969; they will not be analyzed as the bulk of the fishing effort of this fleet is outside of the study zone.
The Congo has had three large purse seiners from 1978 to 1980. Although detailed reports have not been submitted to ICCAT on the activities of these boats, it is known from diverse sources that they have had very low activity and very low catches, only exceeding a thousand tonnes in 1981. The activities of this fleet can be assimilated into those of the French fleet for the fishing zones and species caught.
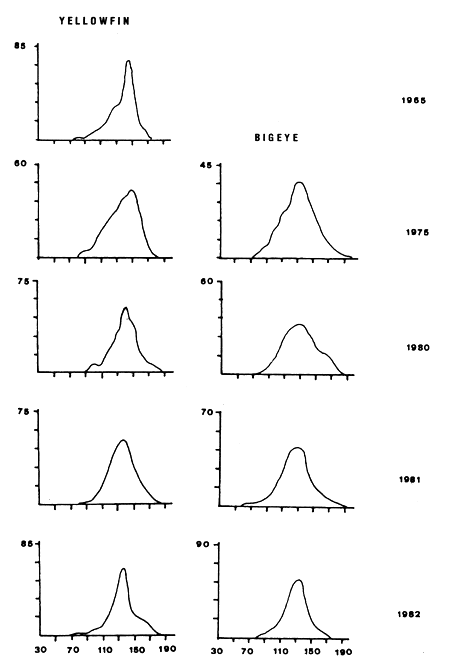
Figure 4.20 Examples of size-frequency distributions of yellowfin and bigeye caught in the region by longliners (1965: Japan, other years: Korea).
The Côte d'Ivoire tuna fleet is a fleet of purse seiners that developed in 1970 (table 4.2). The fishing statistics of this fleet are regularly submitted to ICCAT under the abbreviation FIS, where statistics the fleets of France, Côte d'Ivoire and Senegal are pooled. This statistical entity has been created in order to avoid double reporting of tuna boats unloading in foreign countries. The scientific analyses have shown that this entity, FIS, introduces uniformity in regards to boat characteristics, fishing zones, target species and sizes of caught tuna. The reader is referred to paragraph 4.5.8. for a more complete description of the Côte d'Ivoire fleet activities as presented in the context of the FIS fleet.
The Cuban tuna fleet operating in the study zone consists almost exclusively of longliners that began to exploit the sector in 1965. There are satisfactory fishing statistics for this fleet since 1973. From 1965 to 1972 only total catch estimations are available.
The Cuban longliners are of standerd design. The strength of the fleet by fishing year and tonnage is given in table 4.28. An important part of this fleet exercises its activity in the Gulf of Guinea as demonstrated by the proportion of fishing effort exercised in the sector (table 4.28): 78% of the effort of Cuban longliners has been expended in the Gulf of Guinea from 1973 – 1982. A Cuban purse seiner has also been active in the zone since 1973.
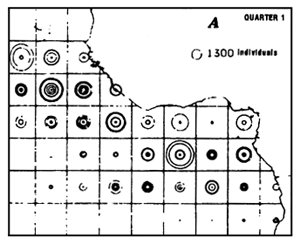
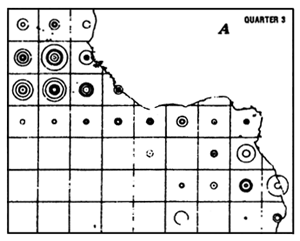
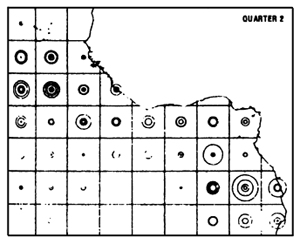
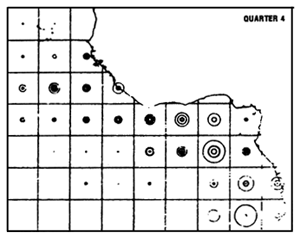
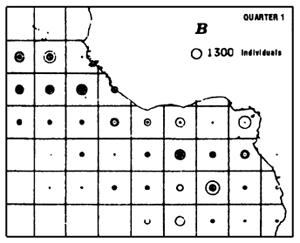
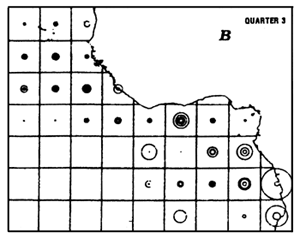
The Cuban longline fleet applies its fishing effort in the layer of deep tropical tuna concentrations, mainly yellowfin. The Cuban longliners are present all year in the sector and modify their fishing zones following a seasonal cycle presented in figure 4.21. The Cuban purse seiner also exploits the East Atlantic but there are no detailed statistics for this boat.
Catches by species of the Cuban fleet in the sector are given in tables 4.7. and 4.12. Yellowfin, the dominant species, represents around 50% of recent Cuban longline catches.
The Cuban fleets have practically never been the object of a continuous sampling. Very likely because of the relative uniformity of longline catches, the sizes caught are identical to those of Korea and Japan exploiting the same spatio-temporal stratum (paragraph 4.5.10 and 4.5.11), i.e. in general, large fish (figure 4.20).
Tables 4.29 and 4.30 and figures 4.28 and 4.30 give yellowfin and bigeye catch rates of Cuban longliners in the study area from 1975. Yellowfin catch rates (0.42 tonnes per 1,000 hooks, 1975 – 80) are high compared to those of other longline fleets. The bigeye catch rates are comparatively weak and are low during recent years. This is very probably linked to the fishing strategy of Cuban longliners that concentrate their fishing effort in strata of high yellowfin density, in contrast to Japanese and Korean fleets oriented totally or partially toward strata of high bigeye density.
France is historically the first country, just ahead of Japan and Spain, to have practiced an industrial exploitation of tropical tuna in the Gulf of Guinea. The first French tuna boats explored the north zones in 1952; more than 40 pole and line boats were already based in Dakar in 1956. This activity developed, with various changes in gear and extensions of fishing zone, until 1983.
 |  |
 |  |
 |  |
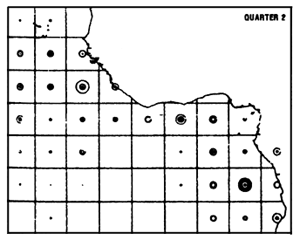 | 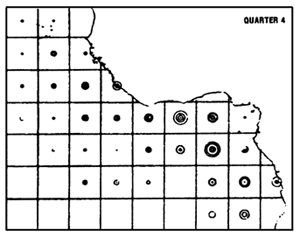 |
Figure 4.21 Quarterly catches of yellowfin (a) and bigeye (b) by the Cuban longline fleet, in number of individuals per 5° square, during the period 1975 to 1982. (The catches observed each year are superimposed on the 5° sectors).
Table 4.29 Yellowfin catch rates by different fleets in the study area.
| YEAR | BAITBOATS | SEINERS | LONGLINERS | |||||||
| F I S | TEMA | MEDIUM | LARGE | SPAIN | JAPAN | U S A | KOREA | CUBA | JAPAN | |
| (1) | (1) | FIS (2) | FIS (3) | (4) | (1) | (1) | (1) | (1) | (1) | |
| 1955 | * | - | - | - | - | - | - | - | - | - |
| 1956 | * | - | - | - | - | - | - | - | - | - |
| 1957 | * | - | - | - | - | - | - | - | - | 5.588 |
| 1958 | - | - | - | - | - | - | - | - | 6.853 | |
| 1959 | - | - | - | - | - | - | - | - | 5.325 | |
| 1960 | * | - | - | - | - | - | - | - | - | 4.385 |
| 1961 | * | - | - | - | - | - | - | - | - | 2.613 |
| 1962 | * | - | - | - | - | - | - | - | 1.670 | |
| 1963 | * | * | * | - | * | - | - | - | - | 1.280 |
| 1964 | * | * | * | - | * | 11.09 | - | - | - | 0.904 |
| 1965 | * | * | * | - | * | 2.85 | - | * | * | 0.786 |
| 1966 | * | * | * | - | * | 10.30 | - | * | * | 0.607 |
| 1967 | * | * | * | - | * | 5.50 | 7.8 | * | * | 1.116 |
| 1968 | * | * | * | - | * | 4.63 | 23.3 | * | * | 0.823 |
| 1969 | 1.52 | 1.00 | 3.78 | 7.50 | * | 4.99 | 10.9 | * | * | 0.417 |
| 1970 | 1.06 | 1.00 | 2.33 | 4.72 | * | 1.82 | 4.0 | * | * | 0.351 |
| 1971 | 1.20 | 1.50 | 2.39 | 3.25 | * | 2.68 | 2.7 | * | * | 0.148 |
| 1972 | 1.43 | 1.30 | 2.82 | 5.10 | * | 2.97 | 3.3 | * | * | 0.114 |
| 1973 | 1.20 | 1.34 | 2.48 | 5.61 | * | 3.68 | 2.2 | * | 0.021 | 0.107 |
| 1974 | 1.39 | 1.75 | 2.47 | 4.73 | * | 3.69 | 2.8 | 0.381 | * | 0.115 |
| 1975 | .88 | 1.12 | 2.24 | 5.47 | * | 3.91 | 5.6 | 0.287 | 0.300 | 0.114 |
| 1976 | 1.28 | 1.48 | 2.01 | 5.34 | * | - | 5.2 | 0.259 | 0.440 | 0.077 |
| 1977 | 1.25 | 0.83 | 2.08 | 5.77 | * | - | 4.4 | 0.312 | 0.537 | 0.010 |
| 1978 | 1.01 | 0.45 | 1.62 | 5.81 | 3.50 | - | 3.2 | 0.247 | 0.454 | 0.030 |
| 1979 | .85 | 0.86 | 1.65 | 4.94 | 4.49 | - | 3.9 | 0.195 | 0.213 | 0.017 |
| 1980 | .99 | 0.57 | 3.86 | 3.94 | 3.69 | - | 2.2 | 0.292 | 0.570 | 0.054 |
| 1981 | 1.20 | 0.93 | 1.93 | 3.37 | 5.08 | - | 2.6 | 0.210 | 1.353 | 0.055 |
| 1982 | 1.18 | 1.21 | 1.84 | 2.87 | 4.80 | - | 0.189 | 0.362 | 0.064 | |
| 1983 | 1.01 | 1.04 | 2.01 | 2.90 | 3.58 | * | - | |||
- No fishing effort
* Effort but no statistics
(1) CPUE in tonnes per non-standardized fishing day
(2) CPUE in tonnes per standardized fishing day, class 3 FIS
(3) CPUE in tonnes per standardized fishing day, class 5 FIS
(4) CPUE in tonnes per standardized fishing day, class 6 Spain
Statistically, French catches are confounded with those of Côte d'Ivoire and Senegal as a result of the uniformity of these three fleets. This statistical grouping, proposed by scientists and accepted by ICCAT, was designed to eliminate double declarations of catch by vessel nationality and country of landing, that were frequent before the creation of the FIS entity. These double declarations remain at present in the FAO statistics in which the national declarations are in general appreciably higher than those of ICCAT for the same fleets. The FIS fleet has always, since its origin, been the object of excellent regular statistics regarding fishing effort, catch by species and sizes caught.
The French fleet is traditionally stratified in 4 groups:
The change in number of vessels in each one of these groups is given by country in tables 4.4. and 4.5. Each one of these groups is heterogeneous, in particular that of large purse seiners which have been divided by size category. The carrying capacity is a factor which is easy to obtain and conveys well the size and performance of tuna boat. Table 4.32 gives the annual size of the FIS fleet of tuna boats by category of carrying capacity. The fishing methods employed by these diverse gears are described in paragraph 4.2.