![]()
![]()
![]()
8. OCEANIC FEATURES ASSOCIATED WITH THE SPECIES
The easterly trade winds drive the principal circulatory pattern in the upper waters of the Pacific (Figure 9), but the pattern is not symmetric with respect to the equator (Pickard, 1968). Of the westward flowing currents, the principal component of the SEC lies between 8°–10°S and 3° N, while the NEC is located between 8°–20° N. The eastward-flowing NECC is situated between these currents, and the generally weaker SECC, normally beneath the surface and under the SEC (IATTC, 1984; Philander, 1990), is also eastwardly directed. This major system of latitudinal flow extends approximately 12,000 km from the Gulf of Panama almost to the Philippines. Of the three major subsurface currents, the core of the Cromwell Current is located in the thermocline during normal, or non-El Niño episodes, and it extends westward from the Galapagos Islands for about 10,000 km. Under normal conditions the sea-surface temperature decreases from west to east, and the depth of the thermocline diminishes from about 150 m in the western Pacific to 40 m or less in the eastern Pacific (Philander, 1990). The distribution of larvae (Section 3), spawning activity (Section 5.2) and migration (Section 6.3) in relationship to these currents have been described earlier.
During El Niño episodes the southeasterly trade winds weaken in the eastern part of the South Pacific, and the tropical currents just described, including the California and Peru (Humboldt) Currents, change their usual positions and strengths (IATTC, 1984). In the eastern Pacific the sea surface rises in response to the decrease in the hydrospheric circulation rate, and coastal and equatorial temperatures also increase. As a result, the thermocline deepens and a flow of warmer surface waters extend over the normally upwelling regions off Ecuador and Peru (Miller and Laurs, 1975; Joseph and Miller, 1988). In addition to a weakening of the SEC, the SECC frequently emerges at the surface between 5°–10°S, and under particularly strong El Niño conditions, such as in the last quarter of 1982 and into 1983, a weakened Cromwell Current may be difficult to locate in transect data at the equator. Schaefer (1961) noted that during the El Niño of 1957–59 skipjack catches declined in the normally productive areas near the Gulf of Guayaquil, Ecuador, and the Costa Rica Dome (centred at 9°N–90°W), but increased substantially off Peru. Warming trends in sea-surface temperatures (SST) were thought to be responsible, but Forsbergh (1989) showed that the SSTs and catches per unit of effort (CPUEs) in the areas were uncorrelated. The intense fishery in the Gulf of Guayaquil lies in the thermal front between the cold, upwelling waters of the Peru Current and the warmer waters north of the equator. The SSTs in the front change rapidly with latitude and position, and the intensity of the front varies with the season and year. Strong upwelling of the Peru Current produces a strong front, and it was thought to induce the formation of concentrations of skipjack forage. However, from 1961 to 1984 the logarithm (log) of CPUE versus SST was significantly correlated only in the first and fourth quarters (Forsbergh, 1989). In the northern part of the Panama Bight the abundance of skipjack appears to be related to upwelling which occurs from January to April; a period of forage production is then followed by a peak in skipjack catch rates in April and July (Forsbergh, 1969).
In terms of vertical distribution, schools of skipjack have been detected at depths of 140 m (Kimura et al., 1952) and 120 m (Yamanaka et al., 1966) by means of echo sounding devices, and at 98–152 m in Hawaiian waters by submarine (Strasburg et al., 1968). Sonic tracking revealed that skipjack move between the surface and 263 m during the day, but remain within 75 m of the surface at night (Dizon et al., 1978). In general, the vertical distribution is limited by the depth profile of the temperature and oxygen concentration with minimum values of 18°C and 3.0–3.5 ml/l, respectively, needed for long-term survival (Forsbergh, 1980). Sharp (1978) considered the lower limits of 15°C and 2.5 ml/l oxygen more appropriate. The upper temperature limit decreases with increasing size from 30°C or more for small fish to as low as 20°C for large fish (Barkley et al., 1978). For these reasons young skipjack can tolerate the conditions in tropical surface waters, but the adult habitat is in the thermocline. As young fish grow they are forced to seek well-oxygenated waters associated with cooler, less stressful temperatures.
It is currently believed that the skipjack fishery in the EPO is supported principally by the immigration of recruits spawned earlier in the central Pacific and, possibly, in the western Pacific. The SST in this spawning area apparently has an effect on the catches in the EPO. Forsbergh (1989) found a positive correlation between the SST 18 months earlier and logCPUE for baitboats during the 1934–1960 period, and the logarithm of the catch rate of recruits (numbers per day) for purse seiners from 1961–1984. A wind-mixing index calculated as the cube of the wind speed 18 months earlier in the spawning area was also inversely correlated with logCPUE for purse seiners for the same period. The hypothesis supporting this negative relationship is that increased wind conditions can disrupt the stability of the mixed layer, thereby dispersing the food aggregations that support survival (Lasker, 1975; Owen, 1981a, 1981b). On the whole, though, attempts to relate the apparent abundance of skipjack with environmental conditions suggest that the relationship is complex and not obvious (Forsbergh, 1989). Some of the problems may be resolved if studies could be carried out on all population units that contribute to the fishery in the EPO rather than the portions which contribute only for part of their life span (IATTC, 1991).
9. INTERACTION WITH OTHER SPECIES
For purposes of potential management information; Orange et al. (1957) and Broadhead and Orange (1960) studied the frequency with which skipjack were caught together with yellowfin in mixed schools in the EPO. From baitboat data it appeared that about 51 percent of the yellowfin and 29 percent of the skipjack tonnages were caught in mixed schools, and for purse seiners the percentages were 6 and 16, respectively. These last figures are probably more representative of the fishery in the EPO today since it is now dominated by purse seiners. On average, Broadhead and Orange (1960) found that the sizes of skipjack from pure and mixed schools were similar. On the other hand, although yellowfin and skipjack in mixed schools were also alike, yellowfin in pure schools tended to be larger and more variable in size.
In the WPO, both skipjack and yellowfin are caught by purse seiners more frequently in mixed schools than is the case in the EPO. From all purse-seine data held by SPC, 37 percent of yellowfin and 47 percent of skipjack tonnages have been caught in mixed schools (SPC, unpubl. data). This is probably because of the greater emphasis placed on fishing schools associated with logs, or floating objects, and the virtual absence of dolphin-associated schools in the WPO.
The implication of “mixed” schools is that yellowfin and skipjack exist in composite aggregations. Yuen (1963) examined this concept by means of underwater observations and photography in a baitboat fishery. He found that the species maintained a significant degree of separation into schools or species groupings, and the random response of individuals from either group to the “chum”, or bait, created the illusion of complete mixing in the catch. While skipjack and yellowfin may therefore prefer to school by species, their co-occurrence is probably the result of a mutual attraction to an external stimulus, such as food.
10. GENERAL DESCRIPTION OF THE FISHERIES
10.1 Eastern Pacific
During the early part of the 1950s, the surface fishery for tunas in the eastern Pacific was conducted primarily by baitboats in coastal waters and near offshore islands. Following the conversion of most of the larger vessels to purse seiners in the later part of the decade and early 1960s, the fishery began to expand offshore. By 1968 the fleet had penetrated the eastern Pacific as far west as 115°W, and by 1974 tuna were being caught near 150°W (Calkins, 1975; Peterson and Bayliff, 1985). Together with this expansion, the number of baitboats declined from 204 to 36 during the 1950–1988 period, and their capacity decreased from about 36,300 to 2,800 mt. At the same time the number of purse seiners increased from about 68 to 182 together with a capacity increase from 7,200 to 121,800 mt. With the exception of the region surrounding French Polynesia, the fishery in the EPO occupies the area to the east of 150° W between the latitudes of 39°N and 35°S. Besides baitboats and purse seiners, smaller amounts of skipjack are also caught near the equator and south of it by coastal dayboat operations involving jigboats and bolicheras. By 1990 approximately 10 nations had been involved in the surface fishery for this species.
The skipjack fishery in the EPO is concentrated primarily in two areas. The most important fishery in the south is east of 100°W and near Central America, northern South America, Cocos Island-Brito Bank and the Galapagos Islands. The secondary, northern fishery is west of 100°W and is near Baja California, the Revillagigedo Islands and Clipperton Island. With rare exceptions, the cell of warm water off southern Mexico that divides the two fishing regions is devoid of commercial quantities of skipjack. In the northern area the largest seasonal catches are taken during June to October, with a peak in August. The fishery in the southern region lasts all year and peaks can occur late in the year, usually in the fourth quarter. Overall, the fishery for skipjack tends to take place closer to shore than for yellowfin, but sporadically in recent years, such as in 1981, 1983–84 and 1988–89, increasing amounts of catches have been made further offshore. Catches and relative abundance in the south are generally twice as large as in the north, and the quantity caught can vary considerably from year to year (Figure 10). During the late 1950s large catches of skipjack were made south of 5°S, and from the late 1950s to the early 1970s large amounts were taken close to shore off Ecuador and northern Peru. During the early 1970s, however, the centre of abundance of the southern group appeared to shift towards the waters farther off Colombia and Central America. Beginning in the early 1980s the centre seemed to move back to Colombia and Ecuador. Compared to the average annual catches during 1979–87 (Figure 7a), the most substantial catches in 1989 were made off Central America and northern South America. The size composition of skipjack samples collected in the EPO during 1984 through 1988 (Figure 11) demonstrate a relatively narrow range of intermediate-sized fish, and support the hypothesis that the fishery is sustained by immigration and temporary residence of fish from outside the EPO.
10.2 Western Pacific
The tuna fisheries of the WPO are extremely diverse and might be conveniently categorized into fisheries based in island countries, fisheries operated by foreign-based, distant-water fishing nations (DWFNs) and fisheries based in Southeast Asia, primarily the Philippines and eastern Indonesia. In many Pacific island countries, tuna are captured by artisanal fishermen for consumption and, where markets are accessible, for sale. Skipjack, and to a lesser extent juvenile yellowfin, are the main species taken, mostly from small boats by trolling and poling, using lures made from mother-of-pearl shell. These artisanal tuna fisheries are of most significance to the smaller island countries, where shortage of land limits both agricultural production and exploitation of inshore marine resources. Despite their social importance, artisanal tuna fisheries are relatively minor in terms of total catch. Although reliable statistics are not available, total tuna catches by artisanal fishermen from Pacific islands are estimated to be less than 10,000 mt annually (Doulman and Kearney, 1987).
Most of the domestic tuna fishery development in the Pacific Island countries has taken place with the assistance of foreign countries, most notably Japan, either in the form of joint venture arrangements or as aid packages. A domestic baitboat fishery in Papua New Guinea began in 1970 in joint venture with Japan, averaging nearly 30,000 mt annually between 1971 and 1981 (SPC, 1983) before unfavourable economic conditions resulted in its termination. The other major domestic tuna fishery in the region is based in the Solomon Islands. This fishery began in the early 1970s, again as a joint venture with Japanese interests, and currently consists of a fleet of small baitboats and several purse seiners. The total tuna catch from the fishery was approximately 30,000 mt in 1990, about 80 percent of which was skipjack (SPC, 1991). Smaller domestic tuna fisheries are currently based in Kiribati, Fiji, and French Polynesia (baitboat) and in Tonga and New Caledonia (longline).
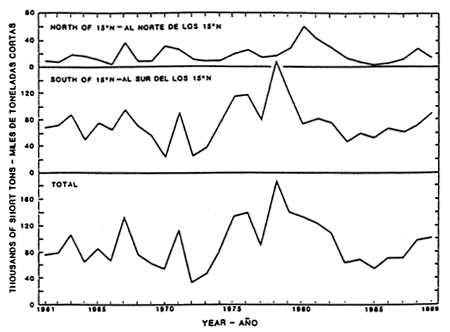
Figure 10. Estimated catches of skipjack in the EPO north and south of 15°N. (After IIATTC, 1991).
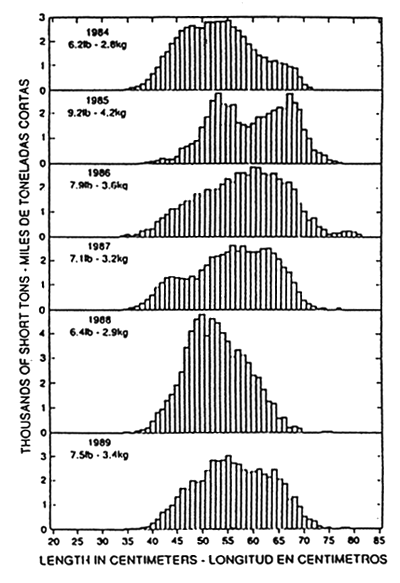
Figure 11. Estimated length composition of the skipjack catch by 1-cm intervals in the EPO. The values in the upper left corners of the panels are average weights. (After IATTC, 1991).
Distant-water, commercial tuna fishing in the WPO dates back to the early 1920s, when Japanese baitboat fleets began to establish themselves in Micronesia (Doulman, 1987). The commercial fishery for skipjack in Japanese home waters operated well before this time. During the early 1950s, Japan re-established its distant-water fishing capability, which had been severely depleted during World War II, with baitboat fishing in Micronesia and longlining throughout the tropical WPO. In the late 1970s, baitboat fishing began to decline and was replaced by purse seining, initially by Japan and the USA, and more recently by the Republic of Korea, Taiwan, Philippines, and Indonesia. The distant-water purse-seine fleet is estimated to have caught approximately 700,000 mt of tuna in 1990, of which 520,000 mt was skipjack (SPC, 1991). This compares with 76,000 mt of skipjack taken by the Japanese distant-water baitboat fleet.
In the far western area, fisheries for small skipjack, yellowfin, and other scombrids have been developing in the Philippines and eastern Indonesia since the early 1970s. Tuna are captured by poling, trolling, handlining, ringnetting, purse seining, and other methods, mostly in association with FADs. In 1990, domestic fisheries in the Philippines and eastern Indonesia are estimated to have caught approximately 165,000 mt of skipjack (SPC, 1991). The total skipjack catch in 1990 in the WPO, including eastern Indonesia and the Philippines, is therefore estimated to have been in excess of 780,000 mt (SPC, 1991).
These fisheries are concentrated in tropical waters at 10°N–10°S (Figure 7b), although seasonal skipjack fisheries exist in waters adjacent to Japan, southeastern Australia, and the North Island of New Zealand. Comprehensive size composition data are generally not available, although it is generally held that size tends to increase from the far west, where large numbers of juvenile skipjack are caught in association with FADs, to the east.
11. TRENDS IN FISHING EFFORT, CATCH, AND CATCH-PER-UNIT OF FISHING EFFORT
11.1 Eastern Pacific
The trends in the catches of skipjack in the EPO (Figure 10 and Table 5) demonstrate that events in the two major fishing regions do not necessarily parallel one another. Substantial differences occurred in 1964–65, 1970–71, 1975, and in 1978–80, but since then the trends have been essentially similar. Part of the differences can be attributed to the major shifts in the location of the fisheries mentioned in Section 10.1. However, it is also thought that the increased catches in one region and the decline in the other may be due to the influx of recruits from the central Pacific favouring different regions (IATTC, 1978). During the 1970s the fishery also began to concentrate on small skipjack and yellowfin associated with logs. This was particularly evident in the fishery south of 15°N where the catches in 1975, 1976, and 1978 reached new levels of 107.6, 107.2, and 153.0 × 10³ mt, respectively. The decline in catches prior to and during the severe El Niño of 1982–83 was also more pronounced in the southern fishery as the vulnerability of fish diminished. Following the recovery of the fishery that began in 1984, the catches in both regions have increased again to the average levels attained during the 1960s and early 1970s.
Historically, the IATTC has progressively modified the standard against which the effort expended in the fishery is gauged. Originally, the standardization was made to Class-4 (182–272 mt capacity) baitoats when this type of gear dominated the fishery during the 1950s. Following the rapid conversion of the fleet to purse seiners by the early 1960s, Class-3 (92–181 mt) seiners became the new standard that persisted until 1967. By 1974, as a result of increased vessel construction that began in the mid-1960s, the fleet capacity of Class-3 seiners fell to 3 percent, while that of the most productive group, Class-6 (> 363 mt), rose to 81 percent. By 1983, Class-6 seiners represented at least 90 percent of the fleet and they were adopted as the new standard. Currently, raw Class-6 effort is used as the measure of effort in determining the catch per day's fishing (CPDF) without taking into account the minor contribution of smaller vessels. In addition, adjustments introduced in 1971, to account for improvements in fleet efficiency of vessels below Class-6, were discontinued when this class became the new standard.
The IATTC staff utilizes the sums of the logged catches (C) and effort (E) to derive the CPDF, and formerly the standardized CPSDF, as an index of the apparent abundance of skipjack. It is recognized that there are at least two problems associated with this approach. First, an index calculated as ΣC/ΣE, rather than as the average C/E weighted by area, i.e., C/E, is biased if the effort is not distributed equally over the fishing grounds (Griffith, 1960; Calkins, 1961). However, the early studies of Calkins (1961) and Joseph and Calkins (1969) indicated that, although the values of ΣC/ΣE over time tended to be both larger and more variable than C/E, the trends were quite similar. For this reason the CPSDF and CPDF are used directly as simple indices of abundance without weighting (Figure 12). Another application of the unweighted and weighted indices involved the ratio of (ΣC/ΣE)/(C/E) as a concentration index (CI). Values greater than one supposedly indicate that the fishermen were able to concentrate their effort in areas with above-average densities of fish. During most of the 1960s, the CI values for skipjack were close to two and approximately twice as large as those of yellowfin (IATTC, 1968), thus indicating that skipjack were vulnerable more consistently in recognized areas than yellowfin. Despite the seemingly useful properties of CIs, however, the IATTC staff discontinued their use in 1969 because of the statistical ambiguity of ratios of ratios, and the difficulty in interpreting the meaningful effects on the fishery of indices greater or less than one.
The second problem concerning the index of abundance is that while the catches refer to skipjack alone, the effort represents that directed towards both yellowfin and skipjack. This situation arises because of the difficulty in obtaining a rational separation of effort in a fishery that essentially involves two species, yellowfin and skipjack, but is primarily directed towards yellowfin. To determine the relative apparent abundance in different years in such a situation, Joseph and Calkins (1969) first identified core regions of skipjack effort in the northern and southern fisheries in which the catches in 1° areas were at least 50 percent skipjack in successive years. These baseline regions were augmented with additional 1° areas of high catch specific to different years (i) before determining relative values of (C/E)i Similarly, and more recently, Forsbergh (1989) identified 22, 5° areas in which most of the skipjack were caught in the 1961–76 period before calculating the relative CPDFs. Some of the important conclusions that emerge from these studies and that of Calkins (1961) are that skipjack catches in successive years are highly variable (Table 5), sometimes differing by a factor of three, but the changes in catch do not appear to be related to effort in preceding years. In fact, and in contrast to yellowfin, a plot of CPDF versus days fishing (Figure 13) indicates that the CPDF is independent of effort. In this situation, considering that skipjack recruitment is derived from outside the EPO, the CPDF is probably indicative of apparent abundance in only the EPO, and is not useful for predicting future catch rates. For this reason the CPDF for skipjack may be more usefully interpreted as an economic indicator of fishing success. Caution is also urged in interpreting the CPDF values in Table 5 and Figure 12 because of two biases: the restricted, coastal operating range of baitboats during the 1960s, and the tendency of the fleet to concentrate on yellowfin in recent years.
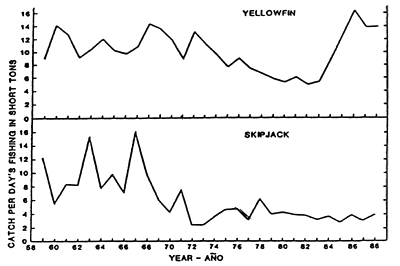
Figure 12. Catch per days fishing for yellowfin and skipjack in the EPO in Class-6 pure-seine units. The 1988 data are preliminary. (After IATTC, 1989).
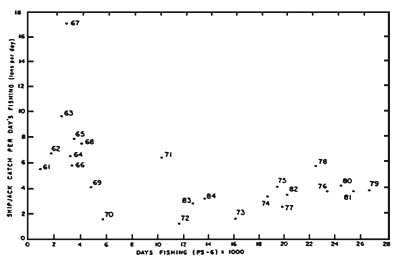
Figure 13. Plot of catch per days fishing (CPDF) and effort for skipjack in the EPO using data for all 5° areas. (After IATTC, 1985).
TABLE 5. Historic catches of skipjack in the EPO by the surface fleet, total effort, catch per days fishing (CPDF), and carrying capacity and number (No.) of vessels participating in the fishery. (Adapted from IATTC, 1991).
| Year | Catch, mt × 10-3 | Total effort* 10-3days | CPDFG@ (mt) | Number and carrying capacity | Total mt x 10-3 | |||||
| North of 15°N | South of 15°N | Total east of 150°W | Purse seiner | Baitboat | ||||||
| No. | mt x 10-3 | No. | mt x 10-3 | |||||||
| 1961 | 8.3 | 60.1 | 68.5 | 9.1 | 7.5 | 124 | 27.3 | 93 | 9.5 | 36.8 |
| 2 | 9.3 | 61.8 | 71.0 | 9.5 | 7.5 | 130 | 30.8 | 89 | 6.1 | 36.8 |
| 3 | 15.2 | 80.3 | 95.5 | 6.9 | 13.8 | 141 | 36.1 | 108 | 5.4 | 41.5 |
| 4 | 14.3 | 44.9 | 59.2 | 8.4 | 7.0 | 134 | 36.6 | 88 | 4.3 | 40.8 |
| 5 | 10.9 | 67.3 | 78.2 | 8.8 | 8.9 | 146 | 46.6 | 109 | 5.3 | 43.6 |
| 6 | 6.8 | 53.7 | 60.5 | 9.4 | 6.4 | 126 | 36.2 | 113 | 5.6 | 41.8 |
| 7 | 37.1 | 83.6 | 120.7 | 8.3 | 14.5 | 122 | 36.5 | 108 | 5.4 | 41.8 |
| 8 | 9.5 | 61.6 | 71.1 | 8.1 | 8.8 | 139 | 45.9 | 89 | 5.2 | 51.1 |
| 9 | 11.2 | 47.8 | 59.1 | 10.8 | 5.5 | 149 | 51.7 | 69 | 4.5 | 56.2 |
| 1970 | 28.0 | 28.0 | 56.1 | 14.6 | 3.8 | 162 | 61.2 | 49 | 3.9 | 65.1 |
| 1 | 22.5 | 82.2 | 104.7 | 15.4 | 6.8 | 185 | 80.6 | 102 | 5.1 | 85.6 |
| 2 | 9.1 | 24.3 | 33.3 | 15.2 | 2.2 | 206 | 102.0 | 108 | 6.1 | 108.0 |
| 3 | 7.5 | 36.4 | 44.0 | 20.3 | 2.2 | 216 | 145.4 | 106 | 6.3 | 125.9 |
| 4 | 7.9 | 70.9 | 78.8 | 24.3 | 3.2 | 230 | 133.0 | 111 | 7.1 | 140.4 |
| 5 | 16.3 | 107.5 | 123.8 | 29.5 | 4.2 | 249 | 148.6 | 102 | 6.7 | 155.3 |
| 6 | 19.0 | 107.2 | 126.2 | 29.2 | 4.3 | 250 | 160.1 | 99 | 6.4 | 166.6 |
| 7 | 11.0 | 75.3 | 86.4 | 29.9 | 2.9 | 250 | 162.2 | 79 | 4.9 | 167.1 |
| 8 | 16.7 | 153.0 | 169.8 | 30.2 | 5.6 | 262 | 164.0 | 68 | 4.5 | 168.6 |
| 9 | 23.7 | 108.3 | 132.0 | 36.2 | 3.6 | 268 | 166.3 | 45 | 3.6 | 170.3 |
| 1980 | 50.3 | 80.0 | 130.4 | 33.7 | 3.9 | 258 | 167.4 | 46 | 3.4 | 170.9 |
| 1 | 41.8 | 77.8 | 119.6 | 33.6 | 3.6 | 247 | 166.6 | 39 | 2.8 | 169.5 |
| 2 | 30.2 | 68.3 | 98.7 | 28.3 | 3.5 | 221 | 152.2 | 36 | 3.4 | 154.7 |
| 3 | 15.5 | 42.3 | 58.1 | 19.7 | 2.9 | 199 | 125.0 | 52 | 3.2 | 128.1 |
| 4 | 7.5 | 53.1 | 60.5 | 18.0 | 3.4 | 165 | 102.7 | 40 | 2.8 | 105.5 |
| 5 | 1.8 | 47.6 | 49.4 | 19.2 | 2.6 | 175 | 115.5 | 25 | 2.2 | 117.7 |
| 6 | 4.8 | 58.7 | 63.5 | 18.3 | 3.5 | 165 | 111.2 | 17 | 1.7 | 112.9 |
| 7 | 12.1 | 50.4 | 62.5 | 18.1 | 3.5 | 177 | 130.4 | 29 | 1.9 | 132.4 |
| 8 | 23.9 | 61.3 | 85.2 | 21.5 | 3.9 | 185 | 134.4 | 36 | 2.8 | 137.3 |
| 9 | #12.4 | 78.2 | 90.7 | - | - | 172 | 121.1 | 30 | 2.7 | 123.8 |
* Effort for all surface vessels in class -6 (>363 mt) purse-seine units
@ For Class-6 purse seiners
# All data for 1989 are preliminary
11.2 Western Pacific
The overall catch trend for skipjack in the WPO is shown in Figure 14. The catch has been increasing at a rapid and fairly constant rate since the early 1970s (SPC, 1991). A number of events have fueled this expansion. In the 1970s, the development of baitboat fisheries in Papua New Guinea and the Solomon Islands and the expansion of the Japanese distant-water, baitboat fishery led to the first large increases. In the 1980s, the development of large-scale purse seining in the WPO and the subsequent influx of vessels from several DWFNs resulted in further increases. In the 1990s, the policy of many canneries not to buy tuna caught in association with dolphins has resulted in the relocation of many purse seiners to the WPO, where problems of dolphin-associated tuna schools do not exist. This, along with tuna fishery development in Southeast Asia, has brought about further increases in the skipjack catch in the WPO. This trend is likely to continue for the next few years at least.
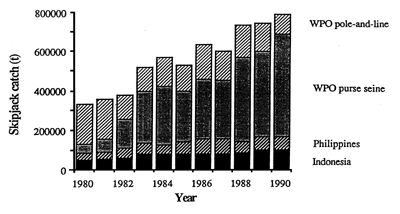
Figure 14. Catch trend for skipjack in the WPO. (After SPC, 1991).
The SPC routinely monitors total CPDF for both the baitboat and purse-seine fisheries for which it receives data. To date, abundance indices such as those described in the previous section for the EPO have not been routinely derived, although a preliminary study was reported in the SPC (1990). Here, indices were constructed using (C/E)j for Japanese purse seines, where the strata, j, were defined as areas of 2° of latitude by 5° of longitude within the overall area of 10°N–6°S, 130° – 165°E, and time periods of either one or three months. These indices, along with raw CPDF, (ΣC/ΣE), suggest similar, steadily-increasing trends in apparent abundance (Figure 15). This is also true of CPDF in the Japanese distant-water, baitboat fishery. Whether these trends are real, i.e. they reflect skipjack abundance, or result from increasing fleet efficacy or other factors, has not yet been determined. In either case, it appears that the abundance of skipjack in the WPO is substantially higher than in the EPO, based on the observation of CPDF levels in the WPO 3–4 times those in the EPO (Figures 12 and 15) (although the effects of yellowfin targeting may bias such comparisons to some extent).
As in the EPO, similar difficulties exist in determining effective effort on skipjack in a purse-seine fishery that also targets yellowfin. In contrast to the EPO, however, calculated concentration indices suggest that the distribution of effort of at least Japanese purse seiners is influenced more by the apparent abundance of skipjack than that of yellowfin (SPC, 1990).
12. POPULATION DYNAMICS
If the skipjack fishery in the EPO is open to both immigration and emigration, as is currently believed, then it is doubtful whether stock production modelling or cohort analysis can produce useful results. Forsbergh (1987) drew attention to this point when values of F, and consequently recruitment estimates, failed to converge after applying Pope's (1972) cohort analysis to quarterly catches and various starting values and attrition rates. On the other hand, by incorporating information on growth rates, a length-weight relationship and approximate attrition rates into yield-per-recruit (Y/R) analysis, some insight can be gained into the dynamics of the fishery. For example, the yield-per-recruit isopleths in Figure 16 were constructed using a linear growth rate of 24 cm/yr (Forsbergh, 1989) and Hennemuth's (1959) length-weight formula from Table 2. The instantaneous attrition rates M ′ = 1.5 (upper panel) and M ′ = 2.0 (lower panel), which include both natural mortality and emigration, correspond to current estimates of the annual attrition rates of 78 and 86 percent, respectively. The effort levels represent multiples of the 1986–87 average which is set equal to one. The importance of the attrition rate with respect to the Y/R is apparent in that an increase of M ′ from 1.5 to 2.0 reduces the Y/R by nearly half. At the lower value of M ′ and recent effort levels there is also a marginal improvement in the Y/R by delaying the size at first capture until 45 cm, but at the higher attrition rate the Y/R is nearly constant in the size range from 30–40 cm. In general, fishing effort considerably greater than or sizes of entry considerably less than has been the case so far would be required to overfish the stock in the EPO in the Y/R sense (IATTC, 1991). The reason is that losses to the total weight of a cohort due to M ′ exceed the gains to it by growth, even when the fish are less than 50 cm and growing rapidly. In summary, the model does not indicate the need for management of the skipjack fishery in the EPO at present levels of effort. However, it is apparent that at the higher attrition rate in Figure 16 increased effort eventually leads to a decline in the marginal return of Y/R. Conceivably, high levels of effort could reduce recruitment in subsequent years, but this seems unlikely from what is known of the spawning behaviour and population structure.
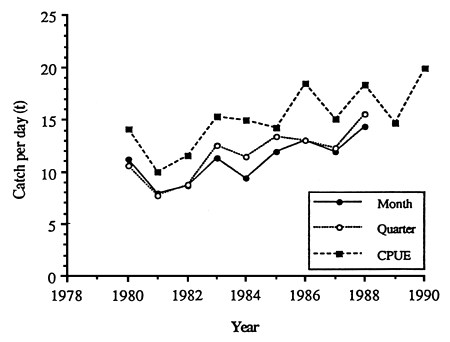
Figure 15. Various indicies of skipjack apparent abundance based on CPDF in the Japanese purse-seine fishery. “CPUE” refers to unadjusted CPDF, “Month” refers to average CPDF stratified by month and 2° latitude by 5° longitude rectranglar areas, and “Quarter” refers to average CPDF stratified by quarter and 2° latitude by 5° longitude recatangular areas. (After SPC, 1990).
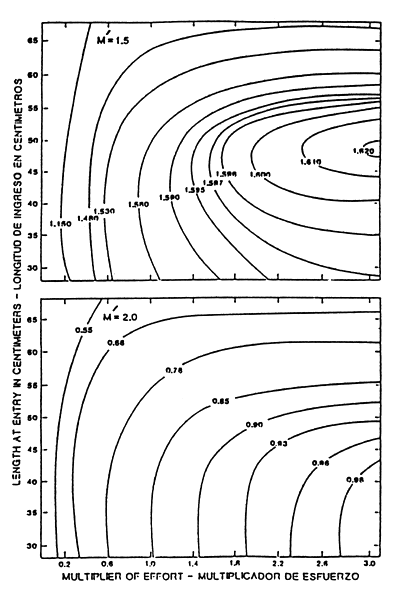
Figure 16. Yields (lbs) per recruit for skipjack with multiple levels of fishing effort in 1986–1987 (=1), length at entry into the fishery, and the sum of natural mortality and emigration (M ′ ). (Adapted from IATTC, 1991).
In the WPO, comparable modelling of skipjack dynamics has not been carried out, due primarily to the lack of representative size composition and total catch and effort data, although this situation is gradually being rectified. Most studies relating to population dynamics and stock assessment have been based on the SSAP tagging data. The SPC produced a series of reports during the early 1980s that described the dynamics of skipjack stocks in the Exclusive Economic Zones (EEZs) of all its South Pacific member countries. In all, twenty such reports were produced along with a more general report dealing with the aggregate data set (Kleiber et al., 1983; 1987). In the latter, total standing stock of skipjack in the WPO was estimated at 3 × 10⁶ mt, with a total throughput of 6.2 × 10⁶ mt per year. The overall harvest ratio (proportion of total attrition due to fishing mortality) was estimated at 0.04, while harvest ratios for seven subareas for which catch and effort data were available ranged from 0.02 to 0.46; only one exceeded 0.17. Kleiber et al. (1987) concluded that “…low harvest ratios over most of the study area during the period tags were at large imply a potential for increased skipjack catches in many subareas and in the whole study area.” At that time the total skipjack catch in the WPO was approximately 230,000 mt per yr.
13. INTERACTIONS
During the 1950s and early 1960s, baitboats and purse seiners frequently competed for tuna resources in nearshore waters in the EPO. However, purse seiners make up over 97 percent of the current fleet capacity (Table 5), and gear competition for skipjack in particular is virtually nonexistent in the EPO. Similarly, purse seiners now account for most of the catching capacity in the WPO; in 1990, purse seiners caught 66 percent of the estimated total skipjack catch of 785,000 mt (SPC, 1991). However, the possibility of interaction between purse-seine and baitboat fisheries is of concern in countries like the Solomon Islands and Fiji, where domestic fisheries have existed for some time. In the case of the Solomon Islands, purse-seine fishing has increased in recent years, and the SPC has been collaborating with the Solomon Islands Government in a tagging experiment designed to estimate the magnitude of the purse-seine/baitboat interaction. The results of the study suggest that the effect of purse-seine catches on baitboat CPUE at recent levels of catch (baitboat ≈ 25,000 mt per year, purse seine ≈ 6,000 mt per year) is slight (SPC, 1992).
Although gear interactions are largely minor, interactions among geographical areas, particularly EEZs, are of concern in some areas. In the WPO, the main area of operation of the purse-seine and baitboat fisheries is composed primarily of the largely contiguous EEZs of Philippines, Indonesia, Palau, Federated States of Micronesia, Papua New Guinea, the Solomon Islands, Nauru, Kiribati, and the Marshall Islands. The degree of interaction among areas such as these will be determined by the size of the areas, the distances between them, skipjack movement rates, the natural mortality rate, and the intensity of the fisheries (SPC, 1988). As noted in Section 6.4, there has been some controversy regarding movement rates of skipjack and their possible effects on spatially-separated fisheries. However, some specific analyses have been carried out. Kleiber et al. (1984), using SSAP tagging data, calculated a series of interaction coefficients based on the proportions of total throughput in receiver EEZs derived from immigration from donor EEZs. These results are summarized in Table 6. Most of the coefficients are low, indicating that under conditions prevailing when the SSAP data were gathered, there was generally little potential for fishery interaction. Not surprisingly, most cases of significant exchange occurred between adjacent EEZs. In particular, the results suggested that 37 percent of throughput in the Marshall Islands EEZ at the time of tagging resulted from immigration from Federated States of Micronesia. Relatively high interaction coefficients were also observed for Northern Mariana Islands ⇄ Federated States of Micronesia and to a lesser extent Palau → Federated States of Micronesia and Papua New Guinea ⇄ Solomon Islands, indicating some potential for fishery interaction between those countries. The only case of a relatively high interaction coefficient for widely separated areas was New Zealand → Fiji; however, this may have been an artifact of the timing of tag releases into the highly seasonal New Zealand Fishery (Argue and Kearney, 1983).
TABLE 6. Coefficients of interaction between fisheries operating in various countries and territories in the WPO. Receiver countries are listed at the top of the table and doner countries down the left margin. (After Kleiber et al., 1984).
| To –>> | Papua New Guinea (PNG) | Solomon Islands (SOL) | Palau (PAL) | Federated States of Micronesia (FSM) | Marshall Islands (MAS) | Northern Mariana Islands (MAR) | Fiji (FIJ) | New Zealand (ZEA) | Western Samoa (WES) | French Polynesia (SOC) |
| PNG | - | 2.6 | 0.8 | 1.4 | 0.5 | - | - | - | - | - |
| SOL 1977 | 1.1 | - | - | - | - | - | - | - | - | - |
| SOL 1980 | 3.7 | - | - | - | - | - | - | - | - | - |
| PAL 1978 | - | - | - | 8.6 | 2.2 | - | - | - | - | - |
| PAL 1980 | 1.6 | 0.4 | - | 3.5 | 1.3 | 0.7 | - | - | - | - |
| FSM | 0.7 | 0.9 | - | - | 37.0 | 10.8 | - | - | - | - |
| MAS | - | - | - | - | - | - | - | - | - | - |
| MAR | - | - | - | 17.4 | - | - | - | - | - | - |
| FIJ 1978 | - | - | - | - | - | - | - | 0.6 | - | - |
| ZEA | - | - | - | - | - | - | 6.5 | - | 2.1 | 3.6 |
| KIR(ibati) | - | - | - | >0.1 | 0.1 | - | - | - | - | - |
This relatively simple representation of interaction does not explicitly specify the controlling factors noted above. Sibert (1984) derived a more rigorous method to estimate interaction between two countries and applied the method to Papua New Guinea and the Solomon Islands, both of which had substantial baitboat fisheries for skipjack at the time of the tagging project. Exchange rates between the two EEZs, losses from natural mortality and movement to other areas, the proportions that remained resident and lived and the proportions that were caught locally on a monthly basis were estimated. The Solomon Islands' stock was found to be relatively stable with a low rate of natural mortality and emigration (resulting in high survival) and low rate of movement to Papau New Guinea. The Papua New Guinea stock was found to be more dynamic with a higher rate of natural mortality and emigration (lower survival), but with a low rate of movement to the Solomon Islands. Sibert (1984) estimated from these results that an increase in the catch in either EEZ of 1,000 mt would result in a decrease in the steady-state catch of the other of only 1–3 mt.
Incomplete catch and effort data availability has, until now, hindered a more thorough analysis of skipjack movement dynamics, and its interpretation with respect to interaction, in the WPO. This situation is now being rectified through a new, collaborative project under the auspices of the FAO Expert Consultation on Interactions of Pacific Ocean Tuna Fisheries.
14. ACKNOWLEDGEMENTS
We would particularly like to thank Bill Bayliff, Kurt Schaefer, and Pat Tomlinson for generously sharing their insights on many interesting and controversial points in the manuscript. Tony Lewis and Albert Caton also provided valuable comments.
15. REFERENCES CITED
Aikawa, H. 1937. Notes on the shoal of bonito along the Pacific coast of Japan. Bull.Jap.Soc.Sci.Fish., 6(1):13–21. [Engl. transl. in W.G. Van Campen, Spec.Sci. Rep.U.S.Fish Wild.Serv. (Fish.), 83:32–50]
Argue, A.W., and R.E. Kearney. 1983. An assessment of the skipjack and baitfish resources of New Zealand. Final Ctry.Rep.Skipjack Surv.Assess.Programme, S.Pac.Comm., (8):47 p.
Argue, A.W., F. Conand, and D. Wyman. 1983. Spatial and temporal distributions of juvenile tunas from stomachs of tunas caught by pole-and-line gear in the central and western Pacific Ocean. Tech.Rep.Tuna Billfish Assess.Programme, S.Pac.Comm., (9):47 p.
Bard, F.X. 1986. Analyse des taux de décroissance numérique des listaos marqués en Atlantique est. In Proceedings of the ICCAT Conference on the International Skipjack Year Program, edited by P.E.K. Symons, P.M. Miyake, and G.T. Sakagawa. Madrid, Spain, ICCAT:348–62.
Bard, F.X., and L. Antoine. 1986. Croissance du listao dans l'Atlantique. In Proceedings of the ICCAT Conference on the International Skipjack year Program, edited by P.E.K. Symons, P.M. Miyake, and G.T. Sakagawa. Madrid, Spain, ICCAT:301–08.
Barkley, R.A., W.H. Neill, and R.M. Gooding. 1978. Skipjack tuna, Katsuwonus pelamis, habitat based on temperature and oxygen requirements. Fish.Bull.U.S.Fish. Wildl.Serv. 76(3):653–62.
Barrett, I., and A.R. Connor. 1962. Blood lactate in yellowfin tuna, Neothunnus macropterus, and skipjack, Katsuwonus pelamis, following capture and tagging. Bull.I-ATTC, 6(6):233–80.
Batts, B.S. 1972a. Age and growth of skipjack tuna, Katsuwonus pelamis (Linnaeus), in North Carolina waters. Chesapeake Sci., 13(4):237–44.
Batts, B.S. 1972b. Sexual maturity, fecundity, and sex ratios of the skipjack tuna, Katsuwonus pelamis (Linnaeus), in North Carolina waters. Trans.Am.Fish.Soc., 101(4):626–37.
Bayliff, W.H. 1971. Estimates of the rates of mortality of yellowfin tuna in the eastern Pacific Ocean derived from tagging experiments. Bull.I-ATTC, 15(4):379–436.
Bayliff, W.H. 1977. Estimates of the rates of mortality of skipjack tuna in the eastern Pacific Ocean derived from tagging experiments. Internal Rep.I-ATTC, (10):59 p.
Bayliff, W.H. 1984. Migrations of yellowfin and skipjack tuna released in the central portion of the eastern Pacific Ocean, as determined by tagging investigations. Internal Rep.I-ATTC, (18):107 p.
Bayliff, W.H. 1988. Growth of skipjack, Katsuwonus pelamis, and yellowfin, Thunnus albacares, tunas in the eastern Pacific Ocean, as estimated from tagging data. Bull.I-ATTC, 19(4):311–85.
Bayliff, W.H., and L.M. Mobrand. 1972. Estimates of the rates of shedding of dart tags from yellowfin tuna. Bull.I-ATTC, 15(5):441–62.
von Bertalanffy, L. 1938. A quantitative theory of organic growth. Hum.Biol., 10:181–213.
Broadhead, G.C., and C.J. Orange. 1960. Species and size relationships within schools of yellowfin and skipjack tuna, as indicated by catches in the eastern tropical Pacific Ocean. Bull.I-ATTC, 4(7):449–92.
Broadhead, G.C., and I. Barrett. 1964. Some factors affecting the distribution and apparent abundance of yellowfin and skipjack tuna in the eastern Pacific Ocean. Bull.I-ATTC, 8(8):417–73.
Brock, V.E. 1949. A preliminary report on Parathunnus sibi in Hawaiian waters and a key to the tunas and tuna-like fishes of Hawaii. Pac.Sci., 3(3):271–77.
Brock, V.E. 1954. Some aspects of the biology of the aku, Katsuwonus pelamis, in the Hawaiian Islands. Pac.Sci., 8(1):94–104.
Brouard, F.,R. Grandperrin and E. Cillaurren. 1984. Croissance des juenes thons jaunes (Thunnus albacares) et de bonites (Katsuwonus pelamis) dans de Pacifique tropical occidental. Notes Doc.d'Oceangr. ORSTOM Port-Vila, (10):23 p.
Buñag, D.M. 1956. Spawning habits of some Philippine tuna based on diameter measurements of the ovarian ova. J.Philipp.Fish., 4(2):145–77.
Cayré, P. 1979. Determination de l'age de listao, Katsuwonus pelamis, debarqués à Dakar; Note préliminaire. Collect.Vol.Sci.Pap.ICCAT, 8:196–200.
Cayré, P., A. Fonteneau, and M.H. Santa-Rita Veira. 1986. Analyse des données de marquages et recaptures de listao (Katsuwonus pelamis) réalisés par le Sénégal et la République du Cap-Vert. In Proceedings of the ICCAT Conference on the International Skipjack Year Program, edited by P.E.K. Symons, P.M. Miyake, and G.T. Sakagawa. Madrid, Spain, ICCAT:309–16.
Calkins, T.P. 1961. Measures of population and concentration of fishing effort for yellowfin and skipjack tuna in the eastern Pacific Ocean, 1951–1959. Bull.I-ATTC, 6(3):71–152.
Calkins, T.P. 1975. Geographical distribution of yellowfin and skipjack tuna catches in the eastern Pacific Ocean and total catch statistics, 1971–1974. Bull.I-ATTC, 17(1):1–116.
Chatwin, B.M. 1959. The relationships between length and weight of yellowfin tuna (Neothunnus macropterus) and skipjack tuna (Katsuwonus pelamis) from the eastern tropical Pacific Ocean. Bull.I-ATTC, 3(7):307–52.
Chi, K.-S., and R.-T. Yang. 1973. Age and growth of skipjack tuna in the waters around the southern part of Taiwan. [Summ. in Chin.]. Nat. Taiwan Univ.Sci.Rep.Acta Oceanogr. Taiwanica, 3:199–221.
Chur, V.N., V.B. Grudinin, and V.L. Zharov. 1980. Data on length-age composition and gonad maturity stages of skipjack (Katsuwonus pelamis) of the eastern tropical Atlantic. Collect.Vol.Sci.Pap.ICCAT, 9:245–54.
Chur, V.N., and V.L. Zharov. 1983. Determination of age and growth of the skipjack tuna, Katsuwonus pelamis (Scombridae), from the southern part of the Gulf of Guinea. J.Ichthyol., 23(3):53–67.
Clement, I.T. 1976. Distribution and abundance of skipjack, 1975–76. Occas.Publ. Fish.Res.Div.New Zealand Minist.Agri.Fish., 11:36–9.
Clement, I.T. 1978. School fish sightings around New Zealand, 1976–77. Occas.Publ. Fish.Res.Div.New Zealand Minist.Agri.Fish., 15:35–42.
Collette, B.B., and C.E. Nauen. 1983. FAO species catalogue. Vol. 2. Scombrids of the world. An annotated and illustrated catalogue of tunas, mackerels, bonitos and related species known to date. FAO Fish.Synop., (125)Vol.2:137 p.
Collette, B.B., T. Potthoff, W.J. Richards, S. Ueyanagi, J.L. Russo, and Y. Nishikawa. 1984. Scombroidei: development and relationships. In Ontogony and Systematics of Fishes, edited by H.G. Moser, et al., Spec.Publ.Am.Soc.Ichthyol.Herpetol., 1:591–620.
Dizon, A.E., R.E. Brill, and H.S.H. Yuen. 1978. Correlations between environment, physiology, and activity and the effects of thermoregulation in skipjack tuna. In The physiological ecology of tunas, edited by G.D. Sharp and A.E. Dizon. New York, Academic Press, pp.233–59.
Doulman, D.J. 1987. Distant-water fleet operations and regional fisheries cooperation. In The development of the tuna industry in the Pacific islands region: an analysis of options, edited by D.J. Doulman. Honolulu, Hawaii, East-West Center Press, pp. 33–52.
Doulman, D.J., and R.E. Kearney. 1987. Domestic tuna fisheries. In The development of the tuna industry in the Pacific islands region: an analysis of options, edited by D.J. Doulman. Honolulu, Hawaii, East-West Center Press, pp. 3–32.
Endler, J.A. 1977. Geographic variation, speciation and clines. New Jersey, Princeton University Press, 246 p.
Evans, L.C., A.D. Uy, and D.D. Tandog. 1978. The abundance, biology and distribution of tuna (Family Thunnidae) in Camiguin and nearby waters. Bur.Fish.Aquat.Resour.Phillip., 55 p.
Fink, B.D. 1965. Estimations, from tagging experiments, of mortality rates and other parameters respecting yellowfin and skipjack tuna. Bull.I-ATTC, 10(1):3–82.
Fink, B.D., and W.H. Bayliff. 1970. Migrations of yellowfin and skipjack tuna in the eastern Pacific Ocean as determined by tagging experiments, 1952–1964. Bull.I-ATTC, 15(1):1–227.
Fonteneau, A. 1986. Etat des stocks de listao de l'Atlantique par analyse des cohorts, analyse de production par recrue et par le modèle global. In Proceedings of the ICCAT Conference on the International Skipjack Year Program, edited by P.E.K. Symons, P.M. Miyake, and G.T. Sakagawa. Madrid, Spain, ICCAT:208–33.
Forsbergh, E.D. 1969. On the climatology, oceanography and fisheries of the Panama Bight. Bull.I-ATTC, 14(2):45–385.
Forsbergh, E.D. 1980. Synopsis of biological data on the skipjack tuna, Katsuwonus pelamis, (Linnaeus, 1758), in the Pacific Ocean. Spec.Rep.I-ATTC, (2):295–360.
Forsbergh, E.D. 1987. Rates of attrition, cohort analysis, and stock production models for skipjack tuna, Katsuwonus pelamis, in the eastern Pacific Ocean. Internal Rep.I-ATTC, (20):37 p.
Forsbergh, E.D. 1988. A review of the question of subpopulations of skipjack tuna, Katsuwonus pelamis, in the Pacific Ocean, and of possible migration routes. Internal Rep.I-ATTC, (21):15 p.
Forsbergh, E.D. 1989. The influence of some environmental variables on the apparent abundance of skipjack tuna, Katsuwonus pelamis, in the eastern Pacific Ocean. Bull.I-ATTC, 19(6):433–569.
Fujino, K. 1970a. Immunological and biochemical genetics of tunas. Trans.Am.Fish. Soc., 99(1):152–78.
Fujino, K. 1970b. Skipjack tuna subpopulation identified by genetic characteristics in the western Pacific. In The Kuroshio: a symposium on the Japan Current, edited by J.C. Marr. Honolulu, Hawaii, East-West Center Press, pp.385–93.
Fujino, K. 1972. Range of the skipjack tuna subpopulation in the western Pacific Ocean. In The Kuroshio II: proceedings of the second CSK symposium, edited by K. Suguwara. Tokyo, Saikon Pub. Co., Ltd., pp. 373–84.
Fujino, K. 1976. Subpopulation identification of skipjack tuna specimens from the southwestern Pacific Ocean. Bull.Jap.Soc.Sci.Fish., 42(11): 1229–35.
Fujino, K., K. Sasaki, and S. Okumura. 1981. Genetic diversity of skipjack tuna in the Atlantic, Indian and Pacific Oceans. Bull.Jap.Soc.Sci.Fish., 47(2):215–22.
Gillett, R.D., and R.E. Kearney. 1983. An assessment of the skipjack and baitfish resources of French Polynesia. Final Ctry.Rep.Skipjack Surv.Assess.Programme, S.Pac.Comm., (7):81 p.
Griffiths, R.C. 1960. A study of measures of population density and of concentration of fishing effort in the fishery for yellowfin tuna, Neothunnus macropterus, in the eastern tropical Pacific Ocean, from 1951 to 1956. Bull.I-ATTC, 4(3):39–98.
Habib, G. 1978. Skipjack biology and the 1976–77 purse-seine fishery. In Proceedings of the pelagic fisheries conference, July 1977, edited by G.V. Habib and P.E. Roberts Occas.Publ.Fish.Res.Div.New Zealand Minist.Agri.Fish., 15:17–26.
Hampton, J. 1986. Effect of tagging on the condition of southern bluefin tuna, Thunnus maccoyii (Castlenau). Aust.J.Mar.Freshwat.Res., 37(6):699–705.
Harada, T., K. Mizuno, O. Murata, S. Miyashita, and H. Furutani. 1971. On the artificial fertilization and rearing of larvae in yellowfin tuna. Bull.Fac.Agri.Kinki Univ., (4):145–51.
Hennemuth, R.C. 1959. Additional information on the length-weight relationship of skipjack tuna from the eastern tropical Pacific Ocean. Bull.I-ATTC, 4(2):25–37.
Higgins, B.E. 1967. The distribution of juveniles of four species of tunas in the Pacific Ocean. Proc.Indo-Pac.Fish.Coun., 12(2):79–99.
Hilborn, R., and J.R. Sibert. 1988. Is international management of tuna necessary? Mar. Policy, 12(1):31–9.
Hu, F., and R.-T. Yang. 1972. A preliminary study on sexual maturity and fecundity of skipjack tuna. J.Fish.Soc.Taiwan, 1:88–98.
Hunter, J.R., B.J. Macewicz, and J.R. Sibert. 1986. The spawning frequency of skipjack tuna, Katsuwonus pelamis, from the south Pacific. Fish.Bull.NOAA-NMFS, 84(4):895–903.
Inter-American Tropical Tuna Commission. 1968. Annual report of the Inter-American Tropical Tuna Commission, 1967. Annu.Rep.I-ATTC, (1967):143 p.
Inter-American Tropical Tuna Commission. 1978. Annual report of the Inter-American Tropical Tuna Commission, 1977. Annu.Rep.I-ATTC, (1977):155 p.
Inter-American Tropical Tuna Commission. 1979. Annual report of the Inter-American Tropical Tuna Commission, 1978. Annu.Rep.I-ATTC, (1978):163 p.
Inter-American Tropical Tuna Commission. 1981. Annual report of the Inter-American Tropical Tuna Commission, 1980. Annu.Rep.I-ATTC, (1980):234 p.
Inter-American Tropical Tuna Commission. 1982. Annual report of the Inter-American Tropical Tuna Commission, 1981. Annu.Rep.I-ATTC, (1981):303 p.
Inter-American Tropical Tuna Commission. 1983. Annual report of the Inter-American Tropical Tuna Commission, 1982. Annu.Rep.I-ATTC, (1982):294 p.
Inter-American Tropical Tuna Commission. 1984. Annual report of the Inter-American Tropical Tuna Commission, 1983. Annu.Rep.I-ATTC, (1983):272 p.
Inter-American Tropical Tuna Commission. 1987a. Annual report of the Inter-American Tropical Tuna Commission, 1986. Annu.Rep.I-ATTC, (1986):264 p.
Inter-American Tropical Tuna Commission. 1987b. Quarterly report of the Inter-American Tropical Tuna Commission, 1987. Annu.Rep.I-ATTC, (1987) 4:4–6.
Inter-American Tropical Tuna Commission. 1989. Annual report of the Inter-American Tropical Tuna Commission, 1988. Annu.Rep.I-ATTC, (1988):288 p.
Inter-American Tropical Tuna Commission. 1991. Annual report of the Inter-American Tropical Tuna Commission, 1989. Annu.Rep.I-ATTC, (1989):270 p.
Joseph, J. 1963. The fecundity of yellowfin tuna (Thunnus albacares) and skipjack (Katsuwonus pelamis) from the eastern Pacific Ocean. Bull.I-ATTC, 7(4):255–92.
Joseph, J., and T.P. Calkins. 1969. Population dynamics of the skipjack tuna (Katsuwonus pelamis) of the eastern Pacific Ocean. Bull.I-ATTC, 13(1):1–273.
Joseph, J., and F.R. Miller. 1988. El Niño and the surface fishery for tunas in the eastern Pacific. In Proceedings of the Tuna Fisheries Research Conference, Jap.Fish.Agency Far Seas Fish.Res.Lab. Maguro Gyogyo Kyogikai Gijiroku Suisancho-Enyo Suisan Kenkyusho:199–207.
Josse, E., J.C. Le Guen, R. Kearney, A. Lewis, A. Smith, L. Marec and P.K. Tomlinson. 1979. Growth of skipjack. Occas.Pap.S.Pac.Comm., (11):83 p.
Kawasaki, T. 1952. On the populations of the skipjack, Katsuwonus pelamis (Linnaeus), migrating to the north-eastern sea area along the Pacific coast of Japan. Bull.Tohoku Reg.Fish.Res.Lab., (1):1–14.
Kimura, K., M. Iwashita, and T. Hattori. 1952. Image of skipjack and tuna recorded on echo sounding machine. Bull.Tohoku Reg.Fish.Res.Lab., (1):15–9.
Klawe, W.L. 1963. Observations on the spawning of four species of tuna, Neothunnus macropterus, Katsuwonus pelamis, Auxis thazard, and Euthynnus lineatus, in the eastern Pacific Ocean, based on the distribution of their larvae and juveniles. Bull.I-ATTC, 6(9):447–540.
Kleiber, P., A.W. Argue, and R.E. Kearney. 1983. Assessment of skipjack (Katsuwonus pelamis) resources in the central and western Pacific by estimating standing stock and components of population turnover from tagging data. Tech.Rep.Tuna Billfish Assess.Programme, S.Pac.Comm., (8):38 p.
Kleiber, P., A.W. Argue, J.R. Sibert, and L.S. Hammond. 1984. A parameter for estimating potential interaction between fisheries for skipjack tuna (Katsuwonus pelamis) in the western Pacific. Tech.Rep.Tuna Billfish Assess.Programme S.Pac.Comm., (12):11 p.
Kleiber, P., A.W. Argue, and R.E. Kearney. 1987. Assessment of Pacific skipjack tuna (Katsuwonus pelamis) resources by estimating standing stock and components of population turnover from tagging data. Can.J.Fish.Aquat.Sci., 44(6):1122–34.
Lasker, R. 1975. Field criteria for survival of anchovy between inshore chlorophyl maximum layers and successful first feeding. Fish.Bull.NOAA-NMFS, 73(3):453–62.
Laurs, R.M., R. Nishimoto, and J.A. Wetherall. 1985. Frequency of increment formation on sagittae of north Pacific albacore (Thunnus alalunga). Can.J.Fish.Aquat.Sci., 42(9):1552–55.
Leis, J.M., T. Trnski, M. Harmelin-Vivien, J.-P. Renon, V. Dufour, M.K. El Moudni, and R. Gazlin. 1991. High concentrations of tuna larvae (Pisces: Scombridae) in near-reef waters of French Polynesia (Society and Tuamotu Islands). Bull.Mar.Sci., 48:150–8.
Lenarz, W.H. 1974. Length-weight relations for five eastern tropical Atlantic scombrids. Fish.Bull.NOAA-NMFS, 72(3):848–51.
Lewis, A.D. 1981. Population genetics, ecology and systematics of Indo-Australian scombrid fishes, with particular reference to skipjack tuna (Katsuwonus pelamis). Ph.D. Thesis. Australian National University.
Lindberg, G.U. 1971. Fishes of the world. A key to families and a checklist. New York, John Wiley and Sons, 545 p.
Marcille, J., and B. Stequert. 1976. Etude préliminaire de la croissance du listao (Katsuwonus pelamis) dans l'ouest de l'Océan Indien tropical. Cah. ORSTOM(Ser.Oceanogr.) 14(2):139–51.
Marr, J.C. 1948. Observations on the spawning of oceanic skipjack (Katsuwonus pelamis) and yellowfin tuna (Neothunnus macropterus) in the northern Marshall Islands. Fish.Bull.U.S.Fish. WildL.Serv., 51(44):201–206.
Matsumoto, W.M. 1975. Distribution, relative abundance, and movement of skipjack tuna, Katsuwonus pelamis, in the Pacific Ocean based on Japanese tuna longline catches, 1964–67. NOAA Tech.Rep.NMFS(Spec.Sci.Rep.-Fish.Ser.), (695):30 p.
Matsumoto, W.M., R.A. Skillman and A.E. Dizon. 1984. Synopsis of biological data on skipjack tuna, Katsuwonus pelamis. NOAA Tech.Rep.NMFS Circ., (451):92 p.
Miller F.R., and R.M. Laurs. 1975. The El Niño of 1972–1973 in the eastern tropical Pacific Ocean. Bull.I-ATTC, 16(5):403–48.
Mori, K. 1972. Geographical distribution and relative apparent abundance of some scombrid fishes based on the occurrences in the stomachs of apex predators caught on tuna longline-I. Juvenile and young of skipjack tuna (Katsuwonus pelamis). Bull.Far Seas Fish.Res.Lab., (6):111–57.
Mullen, A.J. 1989. Mobility of tuna. Mar.Policy, 13(1):77–8.
Naganuma, A. 1979. On spawning activities of skipjack tuna in the western Pacific Ocean. Bull.Tohoku Reg.Fish.Res.Lab., (40):1–13.
Nakamura, E.L., and J.H. Uchiyama. 1966. Length-weight relations of Pacific tunas. In Proceedings of the Governor's Conference on Central Pacific Fishery Resources, edited by T.A. Manar, 28 February – 12 March 1966, Honolulu and Hilo, Hawaii, pp. 197–201.
Nishikawa, Y., M. Honma, S. Ueyanagi, and S. Kikawa. 1985. Average distribution of larvae of oceanic species of scombroid fishes., 1956–1981. S Ser.Far Seas Fish. Res.Lab., (12):99 p.
Orange, C.J. 1961. Spawning of yellowfin and skipjack in the eastern tropical Pacific, as inferred from studies of gonad development. Bull.I-ATTC, 5(6):459–526.
Orange, C.J., M.B. Schaefer, and F.M. Larmie. 1957. Schooling habits of yellowfin tuna (Neothunnus macropterus) and skipjack (Katsuwonus pelamis) in the eastern Pacific Ocean as indicated by purse seine catch records, 1946–1955. Bull.I-ATTC, 2(3):83–126.
Owen, R.W. 1981a. Microscale plankton patchiness in the larval anchovy environment. Rapp.P.-V.Reun.CIEM, 178:364–8.
Owen, R.W. 1981b. Microscale patchiness of small plankton on the Cimbote Shelf, Peru. Vol.extr.Inst.Mar.Per., Bol., (ICANE): 274–9.
Peterson, C.L., and W.H. Bayliff. 1985. Organization, functions, and achievements of the Inter-American Tropical Tuna Commission. Spec.Rep.I-ATTC, (5):56 p.
Philander, S.G. 1990. El Niño, La Niña, and the Southern Oscillation. Ser.Internat. Geophys., Academic Press, Vol.46:293 p.
Pianet, R. 1974. Relations poids-longueur des listaos (Katsuwonus pelamis) pêches dans le secteur de Pointe-Noire. Collect.Vol.Sci.Pap.ICCAT, 9:275–81.
Pickard, G.L. 1968. Descriptive physical oceanography. London, Permagon Press, 200 p.
Polacheck, T. 1990. Another perspective on the need for international skipjack and yellowfin tuna management. Mar.Policy, 14(6):526–9.
Pope, J.G. 1972. An investigation of the accuracy of virtual population analysis using cohort analysis. Res.Bull.Int.Comm.Northwest Atl.Fish., 9:65–74.
Radtke, R.L. 1983. Otolith formation and increment deposition in laboratory-reared skipjack tuna, Euthynnus pelamis, larvae. In Proceedings of the Workshop on Age Determination of Oceanic Pelagic Fishes: Tunas, Billfishes, and Sharks, edited by E.D. Prince, and L.M. Pulos. NOAA Tech.Rep.NMFS 8:99–103.
Raju, G. 1964a. Studies on the spawning of the oceanic skipjack Katsuwonus pelamis (Linnaeus) in Minicoy waters. In Proceedings of the Symposium on Scombrid Fishes. Symp.Ser.Mar.Biol.Assoc.India, 1:744–68.
Raju, G. 1964b. Fecundity of the oceanic skipjack Katsuwonus pelamis (Linnaeus) of Minicoy. In Proceedings of the Symposium on Scombrid Fishes. Symp.Ser.Mar.Biol.Assoc.India 1:725–32.
Richards, W.J., and G.R. Dove. 1971. Internal development of young tunas in the genera Katsuwonus, Euthynnus, Auxis, and Thunnus (Pisces, Scombridae). Copeia 1971:72–8.
Richards, W.J., and D.C. Simmons. 1971. Distribution of tuna larvae (Pisces, Scombridae) in the northwestern Gulf of Guinea and off Sierra Leone. Fish.Bull.NOAANMFS, 69(3):555–68.
Richardson, B.J. 1978. Skipjack tuna stock identification. Occas.Publ.Fish.Res. Div.New Zealand Minist.Agri.Fish. (15):63–4.
Richardson, B.J. 1983. Distribution of protein variation in skipjack tuna (Katsuwonus pelamis) from the central and south-western Pacific. Aust.J.Mar.Freshwat.Res., 34(2):231–51.
Richardson, B.J., and G. Habib. 1987. A genetic study of the origins and structuring of the skipjack tuna population exploited by the New Zealand fishery. New Zealand J.Mar.Freshwat.Res., 21(1):109–16.
Robins, J.P. 1952. Further observations on the distribution of striped tuna, Katsuwonus pelamis L., in eastern Australian waters, and its relation to surface temperature. Aust.J.Mar.Freshwat.Res., 3(2):101–10.
Robson, D.S., and D.G. Chapman. 1961. Catch curves and mortality rates. Trans.Am. Fish.Soc., 90(2):181–9.
Ronquillo, I.A. 1963. A contribution to the biology of Philippine tunas. FAO Fish. Rep., 6(3):1683–752.
Rothschild, B.J. 1963. Skipjack ecology. In Progress in 1961–62, edited by W.G. Van Campen, Circ.U.S.Fish.Wildl.Serv., 163:35 p.
Rothschild, B.J. 1965. Hypothesis on the origin of exploited skipjack tuna (Katsuwonus pelamis) in the eastern and central Pacific Ocean. Spec.Sci.Rep.U.S.Fish Wild.Serv. (Fish.), (512):20 p.
Rothschild, B.J. 1967. Estimates of growth of skipjack tuna (Katsuwonus pelamis) in the Hawaiian Islands. Proc.Indo-Pac.Fish.Coun., 12(2):100–11.
Seckel, G.R. 1972. Hawaiian-caught skipjack tuna and their physical environment. Fish.Bull.NOAA-NMFS, 72(3):763–87.
Shabotiniets, E.I. 1968. Opreedelenie vozraste tuntsov Indiiskogo Okeana (Age determination of Indian Ocean tunas). Trudy VNIRO, 64; Trudy AzcherNIRO, 28:374–376 [Engl.transl. by W.L. Klawe, I-ATTC:5 p.].
Schaefer, K.M. 1987. Reproductive biology of black skipjack, Euthynnus lineatus, an eastern Pacific tuna. Bull.I-ATTC, 19(2):169–260.
Schaefer, M.B. 1961. Report on the investigations of the Inter-American Tropical Tuna Commission for the year 1960. Annu.Rep.I-ATTC, (1960):40–183.
Schaefer, M.B. 1963. Report on the investigations of the Inter-American Tropical Tuna Commission for the year 1962. Annu.Rep.I-ATTC, (1962):35–149.
Schaefer, M.B., and C.J. Orange. 1956. Studies on the sexual development and spawning of yellowfin tuna (Neothunnus macropterus) and skipjack (Katsuwonus pelamis) in three areas of the eastern Pacific Ocean, by examination of gonads. Bull.I-ATTC, 1(6):281–349.
Schaefer, M.B., B.M. Chatwin, and G.C. Broadhead. 1961. Tagging and recovery of tropical tunas, 1955–1959. Bull.I-ATTC, 5(5):341–455.
Sharp, G.D. 1978. Behavioral and physiological properties of tuna and their effects on vulnerability to fishing gear. In The physiological ecology of tunas, edited by G.D. Sharp and A.E. Dizon. New York, Academic Press, pp. 397–449.
Sibert, J.R. 1984. A two-fishery tag attrition model for the analysis of mortality, recruitment and fishery interaction. Tech.Rep.Tuna Billfish Assess. Programme, S.Pac.Comm., (13):27 p.
Sibert, J.R., R.E. Kearney, and T.A. Lawson. 1983. Variation in growth increments of tagged skipjack (Katsuwonus pelamis). Tech.Rep.Tuna Billfish Assess.Programme, S.Pac.Comm., (10):22 p.
Simmons, D.C. 1969. Maturity and spawning of skipjack tuna (Katsuwonus pelamis) in the Atlantic Ocean, with comments on nematode infestation of the ovaries. Spec.Sci.Rep.U.S.Fish Wildl.Serv. (Fish.), (580):17 p.
South Pacific Commission. 1980. Review of preliminary results from genetic analysis of skipjack blood samples collected by the Skipjack and Assessment Programme. Tech.Rep.Tuna Billfish Assess.Programme, S.Pac.Comm., (1):22 p.
South Pacific Commission. 1981a. Report of the second Skipjack Survey and Assessment Programme workshop to review results from genetic analysis of skipjack blood samples. Tech.Rep.Tuna Billfish Assess.Programme, S.Pac.Comm., (6):39 p.
South Pacific Commission. 1981b. Skipjack migration, mortality and fishery interactions. Paper presented at the 13th Regional Technical Meeting on Fisheries, S. Pac. Comm., 24–28 August 1981, W.P.9:35 p.
South Pacific Commission. 1983. An assessment of the tuna and billfish resources of Papua New Guinea. Final Ctry.Rep.Skipjack Surv.Assess.Programme, S.Pac.Comm., Number 12.
South Pacific Commission. 1988. Interaction among South Pacific skipjack fisheries. Paper presented at the 20th Regional Technical Meeting on Fisheries, S.Pac.Comm., 1–5 August 1988, Noumea, New Caledonia, I.P.4.
South Pacific commission. 1990. Collaborative study between SPC and Japan National Research Institute for Far Seas Fisheries: General Report. Paper presented at the Third Standing Committee Meeting on Tuna and Billfish, S.Pac.Comm., Noumea, New Caledonia, W.P.9.
South Pacific Commission. 1991. Status of tuna fisheries in the SPC area during 1990, with annual catches since 1952. Paper presented at the Fourth Standing Committee Meeting on Tuna and Billfish, S.Pac.Comm., 17–19 June 1991, Port Vila, W.P.3.
South Pacific Commission. 1992. Solomon Islands country report 1992. Ctry.Rep.Tuna Billfish Assess.Programme, S.Pac.Comm., (5):81 p.
Sosa-Nishizaki, O., M. Shimizu, and Y. Nose. 1989. The potential use of second dorsal fin rays of skipjack tuna Katsuwonus pelamis as an aging character. Nippon Suisan Gakkaishi, 55(9):1559–64.
Stequert, B. 1976. Etude de la maturité sexualle, de la ponte et de la fécondité du listao (Katsuwonus pelamis) de la côté nord-ouest de Madagascar. Cah.ORSTOM(Sér.Océanogr.), 14:227–47.
Strasburg, D.W. 1960. Estimates of larval tuna abundance in the central Pacific. Fish.Bull.U.S.Fish Wildl.Serv., (167):231–55.
Strasburg, D.W., E.C. Jones, and R.T.B. Iversen. 1968. Use of a small submarine for biological and oceanographic research. J.Cons. CIEM, 31(3):410–26.
Suzuki, Z., P.K. Tomlinson and M. Honma. 1978. Population structure of Pacific yellowfin tuna. Bull.I-ATTC, 17(5):273–441.
Tester, A.L., and E.L. Nakamura. 1957. Catch rate, size, and sex of tunas and other pelagic fishes taken by trolling off Oahu, Hawaii, 1951–55. Spec.Sci.Rep.U.S.Fish Wildl.Serv. (Fish.), (250):25 p.
Toole, J.M., E. Zou and R.C. Millard. 1988. On the circulation of the upper layers in the western equatorial Pacific Ocean. Deep-Sea Res., 35(7A):1451–82.
Uchiyama, J.H., and P. Struhsaker. 1981. Age and growth of skipjack tuna, Katsuwonus pelamis, and yellowfin tuna, Thunnus albacares, as indicated by daily growth increments of sagittae. Fish.Bull.NOAA-NMFS, 79(1):151–62.
Ueyanagi, S. 1969. Observations on the distribution of tuna larvae in the Indo-Pacific Ocean with emphasis on the delineation of the spawning areas of albacore, Thunnus alalunga.Bull.Far Seas Fish.Res.Lab., (2):177–256.
Ueyanagi, S., K. Mori, and Y. Nishikawa. 1969. Research on distribution of larvae. Ser.Far Seas Fish.Res.Lab., 1:12–7.
Ueyanagi, S., K. Mori, Y. Nishikawa, and A. Suda. 1973. Report on experiments on the development of tuna culturing techiques (April, 1970–March, 1973). S Ser.Far Seas Fish.Res.Lab., 8:165 p.
de Vlaming, V.L. 1982. On the use of the gonosomatic index. Comp.Biochem.Physiol., 73A (1):31–9.
Vooren, C.M. 1976. Biological data on skipjack in New Zealand waters, 1973–76. In Proceedings of the Skipjack Tuna Conference, July 1976. Occas.Publ.Fish.Res.Div.New Zealand Minist.Agri.Fish., 11:12–6.
Wade, C.B. 1950. Observations on the spawning of Philippine tuna. Fish.Bull.U.S.Fish Wildl.Serv., 51(55):409–23.
Wild, A., 1986. Growth of Yellowfin tuna, Thunnus albacares, in the eastern Pacific Ocean based on otolith increments. Bull.I-ATTC, 18(6):423–82.
Wild, A., and T.J. Foreman. 1980. The relationship between otolith increments and time for yellowfin and skipjack tunas marked with tetracycline. Bull.I-ATTC, 17(7):507–60.
Williams, F. 1970. Sea surface temperature and the distribution and apparent abundance of skipjack (Katsuwonus pelamis) in the eastern Pacific Ocean, 1951–1968. Bull.I-ATTC, 15(2):229–81.
Williams, F. 1972. Consideration of three proposed models of the migration of young skipjack tuna (Katsuwonus pelamis) into the eastern Pacific Ocean. Fish.Bull.NOAANMFS, 70(3):741–62.
Wyrtki, K. 1965. Surface currents of the eastern tropical Pacific Ocean. Bull.I-ATTC, 9(5):269–304.
Wyrtki, K. 1967. Circulation and water masses in the eastern equatorial Pacific Ocean. J.Int.Oceanol.Limnol., 1(2):117–47.
Wyrtki, K., E. Firing, D. Halpern, R. Knox, G.J. McNally, W.C. Patzert, E.D. Stroup, B.A. Taft, and R. Williams. 1981. The Hawaii to Tahiti shuttle experiment. Science 211(4477):22–8.
Yabe, H. 1954. A study on spawning of skipjack in the Satsunan Sea area. In General view of fishery science, Tokyo. Jap.Assoc.Adv.Sci.: 182–199 [Engl. transl. by G. Y. Beard, 1959: 9p].
Yamanaka, H., Y. Kurohiji, and J. Morita. 1966. General results of the investigation in the south western Pacific Ocean by the fish-finder. Rep.Nankai Reg.Fish.Res.Lab., (24):115–27.
Yamanaka, K.L. 1990. Age, growth and spawning of yellowfin tuna in the southern Philippines. Indo-Pac.Tuna Dev.Mgt.Programme, IPTP/90/WP/21:87 p.
Yao, M. 1981. Growth of skipjack tuna in the western Pacific Ocean. Bull.Tohoku Reg.Fish.Res.Lab., (43):71–82.
Yoshida, H.O. 1960. Marquesas area fishery and environmental data, January –March 1959. Spec.Sci.Rep.U.S.Fish Wildl.Serv.(Fish.), (348):37 p.
Yoshida, H.O. 1966. Skipjack tuna spawning in the Marquesas Islands and Tuamotu Archipelago. Fish.Bull.U.S.Fish Wildl.Serv., 65(2):479–88.
Yoshida, H.O. 1971. The early life history of skipjack tuna, Katsuwonus pelamis, in the Pacific Ocean. Fish.Bull.NOAA-NMFS, 69(3):545–54.
Yuen, H.S.H. 1963. Schooling behavior within aggregations composed of yellowfin and skipjack tuna. FAO Fish.Rep., 6(3):1419–29.
![]()
![]()
![]()