Decline in output continued
Global production of bovine hides and skins fell in 1993 for the second consecutive year. The 2 percent decline followed lower output of beef in major producing countries. The greatest number of hides were still produced in countries of the former USSR but output there decreased by 2 percent in 1993 reflecting a contraction of the herd. In the EC, a decline in the size of the herd reduced the numbers slaughtered and hide supplies continued to shrink in 1993. In the United States output was expected to rise 1.5 percent in 1993 reflecting a cyclical increase in slaughtering coupled with improved prospects in the domestic tanning industry. This will consolidate its top position as measured by weight of output. In Australia, slaughter and hide supplies fell in 1993 as herd rebuilding continued encouraged by higher beef prices. Brazil remained the leading producer among Latin American countries despite the economic recession which curtailed domestic demand for leather products. As a consequence, production of bovine hides expanded by only 3.7 percent in 1993 compared with the previous year's rise of 6.7 percent. In Mexico hide output in 1993 expanded slightly following a rise of 3 percent in 1992. Production of bovine hides contracted in Africa as cattle herds had been diminished by severe drought in 1992.
Global production of sheep and lambskins fell slightly in 1993 according to preliminary data. Countries of the former USSR provided most skins despite a decline in output in 1993 reflecting the recent reduction in flock size. Similarly, Australian sheep numbers and skin production shrank considerably in 1992-93 as a result of depressed wool prices and adverse weather conditions. In New Zealand, fewer skins were produced as sheep and lamb slaughter decreased and flock rebuilding continued. The EC and China provided more sheepskins in 1993 from enlarged flocks but this did not offset the declines elsewhere.
Global goatskin production was maintained in 1993 as the steady rise in China was offset by a decline in Africa. There goat numbers were reduced by the severe drought of 1992.
Trade in 1993 fell with reduced demand
Global exports of bovine hides and skins did not recover in 1993 from the decline in the previous year. This reflected depressed demand in the major hide importing countries. However, exports from the United States, the world's largest exporter, rose slightly in 1993. This was despite the continued sluggish economies in major markets in Europe and Asia. However, the United States' share in global bovine hide shipments has fallen to about 27 percent from 33 percent in 1990 reflecting increased domestic demand by its tanning industry. The growth in exports from countries of the former USSR continued in 1993 but more slowly than in previous years. In contrast, exports from the EC fell following a reduction in output and the retention of good quality hides for domestic use. In Oceania lower levels of production constrained exports to their reduced level of 1992. The only developing country to increase exports was Brazil. Previously a net importer it became a net exporter in 1993 as economic recession reduced domestic demand for leather products and domestic tanning activities.
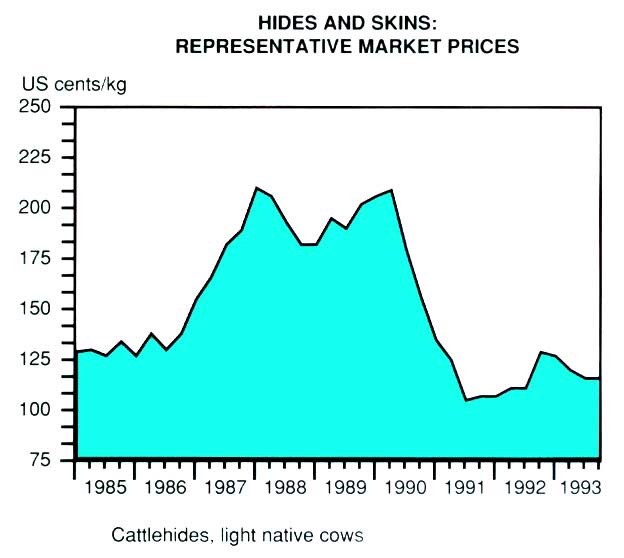
Hides and skins: Representative market prices
Imports of bovine hides and skins in 1992 and 1993 were constrained by depressed demand for leather and leather products. The tanning activities in some importing Asian and Pacific countries continued to expand but imports rose more slowly than in previous years. The Republic of Korea continued to be the world's largest importer of raw hides at a level similar to that of 1992. China's imports rose as lower labour costs continued to stimulate investment in the leather and leather products sector. By contrast, imports by Taiwan Province and Thailand declined due to rising costs and reduced availability of labour. The leather sector in Italy, the world's second largest importer of bovine hides, continued to be affected by severe constraints on environmental grounds and rising labour costs in leather manufacturing. However, imports recovered slightly in 1993 bolstered by an expansion in the domestic footwear industry. In Japan, imports declined in 1992 due to the combined effects of increased wages and a contraction in domestic demand for leather goods. A further fall was expected in 1993. Imports of eastern European countries decreased in 1993 as the tanning sector faced reduced demand for leather.
Global exports of sheep and lambskins decreased by 5 percent in 1992 mainly due to a reduction in shipments from Oceania and, to a lesser extent, from the countries of the former USSR. The decline, which started in 1990, continued in 1993 but more slowly, according to preliminary data. This reflected reduced demand for double-face sheep skins and sheep leather manufactures in the main markets, notably France and Italy.
The volume of goat skins traded continued to decline in 1993. Supplies for export were diminished by expansion of tanning in the major producing countries of China, Ethiopia and Nigeria.
Prices depressed in 1992, some recovery in 1993
Chicago prices of light native cowhides continued to fall in 1992 reflecting depressed demand for leather and leather products in major consuming countries. However, prices tended to rise towards the end of 1992 and in 1993 stimulated by decreased supplies of hides and skins and modest recovery of tanning activities in the Asia and the Pacific region.
The global value of exports of raw hides and skins increased by 1.5 percent in 1992 to about $4 200 million and was probably the same in 1993. Foreign exchange earnings by the developing countries continued to decline. In 1992 exports of the developing countries accounted for 11 percent of the global value of trade in raw hides and skins. Their share was estimated to have fallen further in 1993 as a result of growing domestic utilization of raw hides and skins. This was assisted by measures to divert raw materials to their tanning industries. Developed countries had most of the trade and earnings by the United States accounted for 30 percent of the world total.
Earnings from exports of leather and leather products by the major developing country exporters declined by about 3.8 percent to a little over $12 500 million in 1992. This was the first decline for ten years. The Far Eastern countries accounted for most of the export receipts as in previous years. Receipts by established exporters, such as the Republic of Korea, Taiwan province and Hong Kong, fell as they faced increased competition from low-wage manufacturers particularly those in China and Indonesia. Latin America's receipts increased, mainly due to the improved quality of leather products exported by Brazil, the largest exporter.
Stagnant demand but reduced supplies in 1994
Demand for leather and leather products and hence for hides and skins, was unlikely to expand given the low rate of economic growth in major consuming countries. However, some revival in the fashion for leather jackets in western Europe and North America might boost demand for leather garments. The leather manufacturing and tanning industries in western Europe continue to be constrained by relatively high labour costs and increasingly severe environmental regulations. Those in eastern Europe are affected by the loss of major export markets. Rising labour costs and the necessity to provide for effluent treatment in some established hide-importing developing countries in the Far East have also eroded margins in leather product manufacture and reduced their competitiveness. By contrast, import requirements were likely to expand in newer exporters of leather goods with relatively low production costs, such as China and Indonesia.
A further decline in global production of bovine hides and skins was expected in 1994. This would reflect lower numbers of cattle, largely in countries of the former USSR. In Australia, increased prices for the beef have stimulated herd rebuilding. As a result, slaughtering and hide output are expected to contract. By contrast, hide production was likely to increase in the United States. sustained by higher consumption of beef. No substantial changes were expected in Latin America. Bovine meat production there is likely to fall as farmers retain livestock as a hedge against inflation.
World output of sheep skins was expected to decline in 1994 in line with a contraction in sheep meat production. In Australia sheep numbers and skin output were expected to fall in 1994 as result of depressed wool prices and prolonged dry conditions during 1993. In New Zealand, supplies of sheep skins would again be held down as breeding ewes were expected to be retained for flock rebuilding. Production in eastern Europe and countries of the former USSR might fall further as restructuring of their agricultural sector continues. Output of sheep skins in the EC was expected to expand slightly.
The prospects of a decline in production and of some growth in demand for high quality leather products would tend to raise prices in 1994. However, a substantial recovery in prices would partly depend on a revival of income growth in the major markets.
Production
| 1988-90 Average | 1991 | 1992 | |
| '000 tonnes | |||
| World total | |||
| Cattlehides/calfskins | 5 189 | 5 218 | 5 151 |
| Sheepskins | 380 | 393 | 393 |
| Goatskins | 169 | 181 | 185 |
| Developing countries | |||
| Cattlehides/calfskins | 2 082 | 2 148 | 2208 |
| Sheepskins | 150 | 156 | 157 |
| Goatskins | 157 | 170 | 174 |
| Developed countries1 | |||
| Cattlehides/calfskins | 3 107 | 3 071 | 2 943 |
| Sheepskins | 231 | 238 | 236 |
| Goatskins | 12 | 11 | 11 |
| Million pieces | |||
| World total | |||
| Cattlehides/calfskins | 281 | 283 | 282 |
| Sheepskins | 482 | 501 | 501 |
| Goatskins | 233 | 250 | 255 |
| Developing countries | |||
| Cattlehides/calfskins | 139 | 143 | 148 |
| Sheepskins | 241 | 253 | 255 |
| Goatskins | 217 | 234 | 239 |
| Developed countries1 | |||
| Cattlehides/calfskins | 143 | 140 | 134 |
| Sheepskins | 241 | 248 | 246 |
| Goatskins | 16 | 16 | 16 |
1 For Australia and New Zealand, data are for the split year ending on 30 June of the year shown.
Exports1
| 1988-90 Average | 1991 | 1992 | |
| '000 tonnes | |||
| World total | |||
| Cattlehides/calfskins | 1 931 | 1 903 | 1 890 |
| Sheepskins | 169 | 157 | 148 |
| Goatskins | 27 | 24 | 22 |
| Developing countries | |||
| Cattlehides/calfskins | 208 | 209 | 212 |
| Sheepskins | 40 | 38 | 38 |
| Goatskins | 21 | 18 | 16 |
| Developed countries2 | |||
| Cattlehides/calfskins | 1 723 | 1 695 | 1 679 |
| Sheepskins | 130 | 119 | 110 |
| Goatskins | 5 | 6 | 6 |
1 Cattlehides and calfskins on a wet salted basis
except for a few countries where the type of curing was not
stated.
Sheepskins: for major exporting and importing countries - dry,
dewooled equivalent; for other countries where the wool content
could not be established - product weight.
Goatskins: chiefly on a dry basis.
2 For Australia and New Zealand. data are for the
split year ending on 30 June of the year shown.
Imports1
| 1988-90 Average | 1991 | 1992 | |
| '000 tonnes | |||
| World total | |||
| Cattlehides/calfskins | 1 990 | 1 965 | 1 947 |
| Sheepskins | 175 | 165 | 153 |
| Goatskins | 31 | 24 | 23 |
| Developing countries | |||
| Cattlehides/calfskins | 697 | 829 | 803 |
| Sheepskins | 47 | 66 | 66 |
| Goatskins | 7 | 8 | 10 |
| Developed countries2 | |||
| Cattlehides/calfskins | 1 293 | 1 135 | 1 144 |
| Sheepskins | 128 | 98 | 88 |
| Goatskins | 24 | 16 | 14 |
1 Cattlehides and calfskins: on a wet salted basis
except for a few countries where the type of curing was not
stated.
Sheepskins: for major exporting and importing countries - dry,
dewooled equivalent; for other countries, where the wool content
could not be established - product weight.
Goatskins: chiefly on a dry basis.
2 For Australia and New Zealand, data are for the
split year ending on 30 June of the year shown.
Value of exports
| 1988-90 Average | 1991 | 1992 | ||
| Million $ | ||||
| World total | 5078 | 4103 | 4163 | |
| Cattlehides/calfskins | 3 959 | 3 301 | 3 362 | |
| United States | 1 501 | 1 167 | 1 169 | |
| France | 357 | 282 | 321 | |
| Australia | 248 | 234 | 169 | |
| Sheepskins | 996 | 699 | 705 | |
| New Zealand | 251 | 173 | 150 | |
| Australia | 187 | 85 | 99 | |
| United Kingdom | 141 | 93 | 98 | |
| Goatskins | 123 | 103 | 95 | |
| China | 37 | 36 | 31 | |
| Greece | 8 | 3 | 6 | |
| Developing countries | 512 | 479 | 461 | |
| Cattlehides/calfskins | 246 | 257 | 251 | |
| Sheepskins | 173 | 141 | 137 | |
| Goatskins | 93 | 81 | 73 | |
| Developed countries1 | 4566 | 3624 | 3702 | |
| Cattlehides/calfskins | 3 713 | 3044 | 3 111 | |
| Sheepskins | 823 | 559 | 568 | |
| Goatskins | 30 | 22 | 23 | |
1 For Australia and New Zealand, data are for the split year ending on 30 June of the year shown.
Prices
| 1989-90 Average | 1991 | 1992 | 1993 | |
| US cents/kg | ||||
| Cattlehides1 | 191 | 117 | 112 | 120 |
| Calfskins2 | 331 | 223 | 299 | 220 |
| $ per dozen | ||||
| Sheepskins3 | 86 | 68 | 70 | 93 |
1 Light native cows, Chicago.
2 Calfskins (square trimmed) 12-20 kg, Italy.
3 Lamb skins, North Island, New Zealand.
Value of some product exports1
| 1988-90 Average | 1991 | 1992 | |||||
| Million $ | |||||||
| ROUGH-TANNED AND FINISHED LEATHER | |||||||
| Latin America | |||||||
| Argentina | 388 | 544 | 451 | ||||
| Brazil | 297 | 305 | 350 | ||||
| Colombia | 27 | 30 | 28 | ||||
| Uruguay | 113 | 127 | 110 | ||||
| Venezuela | 7 | 3 | 2 | ||||
| Africa | |||||||
| Ethiopia2 | 25 | 25 | 20 | ||||
| Kenya | 44 | 45 | 40 | ||||
| Nigeria2 | 62 | 85 | 80 | ||||
| Far East | |||||||
| Bangladesh3 | 151 | 138 | 140 | ||||
| India | 445 | 296 | 298 | ||||
| Indonesia | 59 | 38 | 54 | ||||
| Pakistan3 | 275 | 275 | 241 | ||||
| Thailand | 65 | 102 | 135 | ||||
| Total of the above | 1 960 | 2013 | 1 949 | ||||
| LEATHER FOOTWEAR AND OTHER LEATHER MANUFACTURES | |||||||
| Latin America | |||||||
| Argentina | 111 | 157 | 62 | ||||
| Brazil | 1 172 | 1 167 | 1 300 | ||||
| Colombia | 86 | 135 | 140 | ||||
| Uruguay | 71 | 75 | 56 | ||||
| Venezuela | 12 | 7 | 5 | ||||
| Africa | |||||||
| Morocco | 112 | 123 | 120 | ||||
| Near East | |||||||
| Turkey | 575 | 621 | 499 | ||||
| Far East | |||||||
| China4 | 1 478 | 1 820 | 1 800 | ||||
| Taiwan Province | 1 182 | 1 129 | 845 | ||||
| Hong Kong | 340 | 253 | 180 | ||||
| India | 814 | 1 015 | 1 127 | ||||
| Indonesia | 98 | 413 | 865 | ||||
| Korea, Republic of | 4434 | 4240 | 3331 | ||||
| Pakistan3 | 177 | 306 | 350 | ||||
| Thailand | 409 | 733 | 793 | ||||
| Total of the above | 9 891 | 11 065 | 10628 | ||||
1 Value of exports of leather and leather products
from selected developing countries.
2 Imports into the EC only.
3 Ending 30 June of the year shown.
4 Leather footwear only.