Substantial fall in output in 1993/94
Global wine production was expected to decrease by 8 percent to 265 million hectolitres in 1993/94. This was due mainly to a fall in EC output. There output would be under 160 million hectolitres, table wine output failing by 14 million hectolitres and quality wine by 8 million hectolitres. There would be reductions in each EC country other than Greece. In the United States, production was expected to continue to recover slowly, following phylloxera damage, but faces contraction in domestic consumption and strong competition from imports. Further recovery in production was reported in eastern Europe and in the countries of the former USSR. In the developing countries Output was expected to be maintained while Argentina and Chile restructured their industries to expand quality wine production.
Output was up sharply in 1992/93
The 1992/93 vintage increased by 11 percent to a level above that of the preceding year. A major contribution came from France, where almost ideal growing conditions allowed the vintage to recover to some 63 million hectolitres, 54 percent greater than the previous frost-damaged harvest. Recovery elsewhere in the EC was smaller but the Italian harvest was up 5 percent to match that of 1988/89. Over 63 million hectolitres were produced in Italy, including 12 million hectolitres of quality wine, despite the spread of fungal disease in some areas resulting from excess humidity. Over the past decade, the production of quality wine by the EC has increased, both absolutely and as a proportion of total output. The proportion of quality wine in total EC output was 18 percent in 1980/81; by 1992/93 it had increased to 36 percent, a proportion also expected for 1993/94.
Slow recovery continued in the United States where a number of phylloxera damaged vines still had to be replaced. The recovery of the previous year was maintained in countries of the former USSR. In some of these countries there had been a sharp reduction in the area planted following the anti-alcohol campaign, started in 1985. Progress in replacement has been slow, constrained by economic sluggishness and by shortage of foreign exchange, which prevented the replacement of some equipment. In eastern Europe, the Hungarian wine sector faced severe problems following economic transition there and in its major export markets. In addition, the area planted to vines had contracted and it is expected that further losses will occur. The vintage fell 15 percent, to 4 million hectolitres, reflecting the area reduction and, though output in Hungary will vary annually, it is probable that it will remain below 5 million hectolitres in the short term. By contrast, Romanian production increased by 56 percent in 1992/93. The impetus for this came from agricultural liberalization helped by favourable weather. In Australia production increased slightly with mixed weather conditions that reduced the volume in some areas but was generally positive for quality.
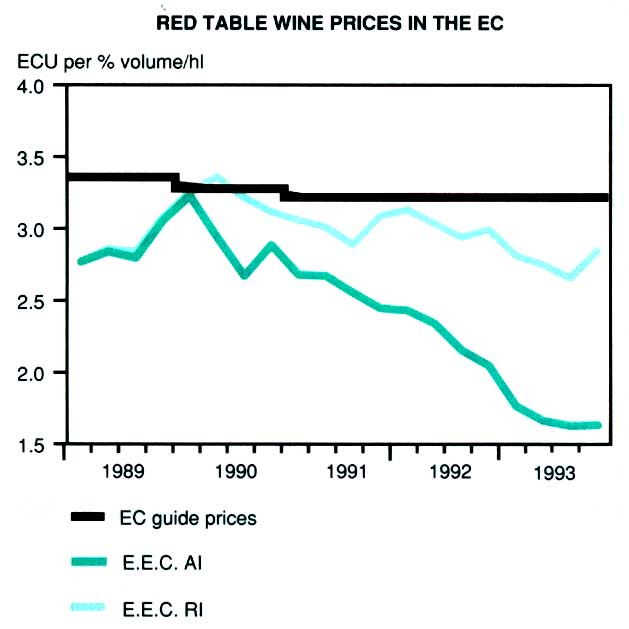
Red table wine prices in the EC
Production in the developing countries increased by 5 percent in 1992/93 to exceed 30 million hectolitres. Almost half was produced by Argentina where recovery in volume has begun following conversion of many vineyards to production of quality wine, mainly for export. The Chilean vintage also increased from the previous frost-damaged output and was of excellent quality. Considerable conversion of vineyards has taken place aimed at boosting exports but temporarily halting increases in volume.
Exports rose 3 percent in 1992
Wine exports rose by 3 percent to 46 million hectolitres in 1992. Over 83 percent of exports were made by members of the EC. mainly selling to other members. Nevertheless, wine was an important export for countries outside the EC with their exports earnings averaging $2 400 million a year from 1988 to 1992. Exports of quality wine have increased substantially since the early 1980s, when they averaged 37 percent of the total, to 46 percent during the five seasons ending in September 1993. Further, in 1992/93, the proportion of quality wine in exports to countries outside the EC was 59 percent.
Exports by Eastern Europe were about half the average of 1988-90 despite comparatively little variation in aggregate production during that time. In earlier years this trade had been between countries in the region, often as counter trade or on a long term contractual basis. The movement away from barter trade and the scarcity of foreign currency has severely restricted these exports. Furthermore, alternative markets, especially those in western Europe, have been difficult to enter. The situation has been exacerbated by the increased excise duties in several established markets aimed at reducing both expenditure of foreign exchange and consumption of wine and other alcoholic beverages.
Exports by the United States remained well above one million hectolitres in 1992 and more than 50 percent above the average for 1988-90. Though still a net importer, the United States wine industry has suffered from declining consumption and a large stock overhang. As a result, exports have been promoted strongly and have displaced France as Canada's largest supplier. Exports by the developing countries were slightly higher than in the previous year but the only major gains were by Argentina and Chile. Both countries have promoted exports strongly and have concentrated on the production and sale of quality wines.
The value of exports in 1992 increased by 9 percent, to almost $9 000 million. The unit value of exports also increased to $1.98 per litre. With prices of table wine in the EC, which guide prices elsewhere, showing little change. or declining somewhat, the increase in unit value reflects, besides currency movements, the increased proportion of quality wine. Concentration on quality production helped Argentina to lift the unit value of its exports from $0.65 per litre in 1991 to $0.78 per litre in 1992 and in Chile to rise from $1.30 per litre to $1.61 per litre. There were also increases for France and Italy.
Imports largely maintained in 1992
The developing countries imported an additional 0.4 million hectolitres, largely as a result of large increases in the import of Portuguese wine by Angola and Mozambique. By contrast, imports by the developed countries fell by 0.8 million hectolitres. The main loss was in eastern Europe, where imports were halved to 0.8 million hectolitres, and in the countries of the former USSR. Imports by the EC, mainly internal trade, were similar to 1991. By contrast, there was an increase of 0.4 million hectolitres in imports by the United States, reflecting additional exports from France, Italy and Chile.
Moderate expansion of trade in 1993
Preliminary indications were for an increase of 3 to 4 percent in exports by the EC and an increase of 10 percent in exports by the United States. On the other hand, imports by the United States from the EC fell by 9 percent during the first half of the year. The strengthening of the US dollar implies that global export receipts expressed in that currency will decline, however, receipts in exporters' currencies should rise reflecting rising volumes, steady prices in national currencies and a continued tendency to export more quality wine.
Price outlook mixed for 1993/94
Following the estimated reduction in EC output its excess over consumption should fall, for table wine from 34 million hectolitres in 1992/93 to 20 million hectolitres in 1993/94 and for quality wine from 16 to 8 million hectolitres. Though stocks will cushion the fall, EC prices of quality wine would tend to rise and non-EC exporters of quality wine could gain from this rise. However, price increases would be constrained by the downward trend in consumption, which has been falling in the EC since 1987/88, and by the underlying potential for increased production. Some countries have attempted to limit production with mixed results, and a continuation of sizeable annual surpluses remains probable. Moreover, prices of table wine remain depressed with EC representative prices in the early part of the 1993/94 season substantially lower than 12 months earlier.
Production1
| 1988-90 Average | 1991 | 1992 | 1993 | ||
| Million hectolitres | |||||
| World total | 278.8 | 258.8 | 287.9 | 265.0 | |
| Developing countries | 30.8 | 28.9 | 30.4 | ... | |
| Argentina | 16.3 | 14.4 | 15.0 | ... | |
| Brazil | 3.0 | 3.6 | 3.7 | ... | |
| Chile | 3.7 | 2.9 | 3.2 | ... | |
| Algeria | 0.5 | 0.5 | 0.5 | ... | |
| Morocco | 0.4 | 0.4 | 0.4 | ... | |
| Tunisia | 0.2 | 0.4 | 0.4 | ... | |
| Developed countries | 248.0 | 229.9 | 257.4 | 234.6 | |
| United States | 16.5 | 15.1 | 15.6 | 15.8 | |
| EC | 174.1 | 156.4 | 184.4 | 159.5 | |
| France | 60.4 | 41.1 | 63.4 | 53.8 | |
| Germany | 11.3 | 10.2 | 13.5 | 10.5 | |
| Greece | 4.3 | 4.0 | 4.0 | 4.1 | |
| Italy | 59.1 | 60.1 | 63.3 | 60.0 | |
| Portugal | 7.6 | 9.8 | 7.6 | 4.5 | |
| Spain | 31.4 | 31.2 | 32.3 | 26.5 | |
| Eastern Europe | 14.3 | 13.7 | 14.9 | 15.8 | |
| Hungary | 4.6 | 4.6 | 3.9 | 4.4 | |
| Romania | 5.3 | 4.8 | 7.5 | 8.0 | |
| Former USSR | 17.6 | 18.0 | 18.0 | 19.0 | |
| Oceania | 5.0 | 5.0 | 5.2 | ... | |
| Australia | 4.5 | 4.6 | 4.7 | ... | |
1 For the Northern Hemisphere, crop year October/September starting in the year shown. For the Southern Hemisphere harvest, in the following year.
Exports
| 1988-90 Average | 1991 | 1992 | ||
| Million hectolitres | ||||
| World total | 46.5 | 44.2 | 45.5 | |
| Developing countries | 1.8 | 1.8 | 1.9 | |
| Argentina | 0.4 | 0.3 | 0.4 | |
| Chile | 0.3 | 0.6 | 0.7 | |
| Algeria | 0.5 | 0.1 | 0.1 | |
| Developed countries | 44.7 | 42.3 | 43.5 | |
| United States | 0.8 | 1.1 | 1.3 | |
| EC | 37.5 | 37.4 | 38.0 | |
| France | 13.0 | 12.3 | 11.6 | |
| Italy | 14.0 | 13.2 | 12.5 | |
| Germany | 2.9 | 2.5 | 3.0 | |
| Portugal | 1.6 | 1.7 | 2.5 | |
| Spain | 4.8 | 6.7 | 7.4 | |
| Eastern Europe | 4.3 | 1.8 | 2.2 | |
| Former USSR | 0.5 | 0.2 | 0.2 | |
Imports
| 1988-90 Average | 1991 | 1992 | ||
| Million hectolitres | ||||
| World total | 45.4 | 45.1 | 44.6 | |
| Developing countries | 2.4 | 2.4 | 2.8 | |
| Developed countries | 43.1 | 42.6 | 41.8 | |
| United States | 2.8 | 2.3 | 2.7 | |
| EC | 28.7 | 31.2 | 31.2 | |
| France | 5.3 | 5.5 | 5.9 | |
| Germany | 9.4 | 11.5 | 10.8 | |
| United Kingdom | 6.8 | 6.7 | 6.9 | |
| Eastern Europe | 3.3 | 1.6 | 0.8 | |
| Former USSR | 1.8 | 1.2 | 1.0 | |
Value of exports
| 1988-90 Average | 1991 | 1992 | ||
| Million $ | ||||
| World total | 7535 | 8272 | 8998 | |
| Developing countries | 121 | 184 | 230 | |
| Argentina | 18 | 23 | 34 | |
| Chile | 27 | 84 | 119 | |
| Algeria | 22 | 20 | 12 | |
| Developed countries | 7414 | 8088 | 8768 | |
| United States | 106 | 146 | 171 | |
| EC | 6 687 | 7469 | 8030 | |
| France | 3806 | 4 124 | 4295 | |
| Italy | 1 326 | 1 575 | 1 613 | |
| Germany | 458 | 448 | 531 | |
| Portugal | 373 | 424 | 495 | |
| Spain | 565 | 728 | 894 | |
| Western Europe | 363 | 150 | 192 | |
| Former USSR | 100 | 56 | 44 | |
Export unit value
| 1988-90 Average | 1991 | 1992 | ||
| $/litre | ||||
| World total | 1.63 | 1.87 | 1.98 | |
| Developing countries | 0.68 | 0.99 | 1.18 | |
| Algeria | 0.55 | 1.96 | 2.00 | |
| Argentina | 0.53 | 0.65 | 0.78 | |
| Chile | 1.23 | 1.30 | 1.61 | |
| Developed countries | 1.66 | 1.91 | 2.01 | |
| United States | 1.31 | 1.32 | 1.35 | |
| France | 2.94 | 3.34 | 3.70 | |
| Germany | 1.60 | 1.78 | 1.76 | |
| Italy | 0.95 | 1.19 | 1.29 | |
| Spain | 1.17 | 1.08 | 1.12 | |
Prices1
| 1988-90 Average | 1991 | 1992 | |
| National currencies | |||
| France | francs/degree hectolitre | ||
| Red table wine, 10 degrees, farmgate, Béziers | 20.87 | 24.18 | 22.21 |
| Italy | lire/degree hectolitre | ||
| White table wine, 9/11 degrees, average producer prices from the most important Italian markets | 4864 | 5239 | 4407 |
| Spain | pesetas/degree hectolitre | ||
| White common wine | 286 | 273 | 290 |
1 Seasonal year (September/August) starting in the year shown.