![]()
![]()
![]()
The shrimp hatchery business is also developing. Martosubroto and Wibisono (1989) reported that, up to 1989, 113 hatchery companies have been recorded. In the last two years, hundreds of backyard hatchery units have also been developed. Unfortunately, this rapid development has not been instantly followed by adequate domestic feed supply. So far, 90 % of the larval feed required is still imported.
ON-FARM FEED FORMULATION AND MANUFACTURING
Currently the majority of fish farmers applying intensive technology prefer to use commercial feeds rather than to make their own feed. This is because the former are considered more practical, whereas making on-farm feeds requires a lot of time and the purchase of ingredients is relatively difficult.
Some freshwater fish farmers, however, still prepare feed for themselves. The feed is made by means of simple equipment, such as manual meat mincers. They use easily available local raw materials, such as rice bran, cassava leaves, soybean cake, etc. These on-farm feeds are usually used for common carp, gourami and red tilapia.
Fish farmers in Indonesia formulate their feeds using raw materials which are readily available and meet the nutrient requirements. Formulated feeds made by researchers are better than those made by farmers, because they use feed additives. For research purposes purified diets are often used.
ON-FARM FEEDING STRATEGIES
Farmers operating traditional ponds usually rely on natural food and household waste products. Sometimes the farmers themselves make simple artificial feeds, such as mixtures of fine rice bran and soybean cake. Commercial feeds given in intensive freshwater aquaculture are fed at about 3 % of biomass per day. For common carp and red tilapia, feed is broadcast over the surface of the water.
Commercial feeds are applied to both intensive and semi-intensive tiger shrimp culture. At present, feeding regimes in semi-intensive culture are almost the same as those in intensive ones, except for feeding frequency (Table 12). The different characteristics of intensive and semi-intensive culture are shown in Table 13.
| Period of rearing (day) | Intensive | Semi-intensive | ||||
|---|---|---|---|---|---|---|
| Size (g) | Feed dosage (%) | Frequency (/day) | Size (g) | Feed dosage (%) | Frequency (/day) | |
| 1-7 | 0.008 | 100 | 2 | 0.008 | 75 | 2 |
| 8-14 | 0.05 | 25 | 3 | 0.05 | 25 | 2 |
| 15-21 | 0.4 | 15 | 3 | 0.5 | 14 | 2 |
| 22-28 | 1.1 | 10 | 4 | 1.3 | 9 | 3 |
| 29-35 | 2.1 | 9 | 4 | 2.4 | 8 | 3 |
| 36-42 | 3.5 | 8 | 4 | 3.8 | 7 | 3 |
| 43-49 | 5.5 | 6 | 5 | 5.9 | 6 | 3 |
| 50-56 | 7.2 | 5 | 5 | 7.7 | 5 | 4 |
| 57-63 | 9.0 | 4 | 5 | 9.5 | 4 | 4 |
| 64-70 | 11.5 | 4 | 5 | 12.0 | 4 | 4 |
| 71-77 | 14.5 | 3.5 | 6 | 15.0 | 3.5 | 4 |
| 78-84 | 17.0 | 3.5 | 6 | 18.0 | 3.5 | 5 |
| 85-91 | 20.0 | 3.5 | 6 | 21.0 | 3.0 | 5 |
| 92-98 | 22.5 | 3.0 | 6-7 | 23.5 | 3.0 | 5 |
| 99-105 | 25.0 | 3.0 | 6-7 | 27.0 | 3.0 | 5 |
| 106-112 | 27.5 | 3.0 | 6-7 | 29.5 | 2.5 | 5 |
| 113-120 | 30.5 | 2.5 | 6-7 | 32.5 | 2.5 | 5 |
| 120< | 33.5 | 2.5 | 6-7 | 34.5 | 2.5 | 5 |
| Characteristics | Intensive | Semi-intensive | Notes |
|---|---|---|---|
| Size of pond (m²) | 5,000-8,000 | 5,000-10,000 | applied before stocking according to the density of the natural food |
| Stocking density (pc/m²) | 30-35 | 10-13 | |
| Fertilization | once in 5-7 days | once in 5-7 days | |
| Water depth (cm) | 120-160 | 80-110 | %placed in feeding trays |
| Water exchange (%/day) | 30-40 | 10-15 | |
| Paddlewheel aerators (pc) | 4-8 | none | |
| Feeding control (%) | 1-2.5 | 1-2 | |
| Feed conversion rate (FCR) | 1.6-2:1 | 1.1-1.3:1 |
MAJOR INSTITUTIONS INVOLVED IN AQUAFEED RESEARCH AND DEVELOPMENT
Several institutions are involved in fish and shrimp feed research and development. Besides those controlled by the Directorate General of Fisheries, other institutions work in this field, such as the Indonesian Science Institution and some universities (Annex 3).
CURRENT NATIONAL REGULATIONS
The following Indonesian government policies apply to the feed industry:
A decree of the Minister of Industry No. 37/M/SK/3/1992 which refers to the establishment of Indonesian standards for the shrimp feed industry. The principle of this decree covers quality standards (Table 14), sampling methods, formulation, and labeling. Standards for labeling include the trade mark, the nature of the feed, net weight, ingredients and nutritive content.
| Formulation criteria | Unit | Starter1 | Starter2 | Grower1 | Grower2 | Finisher | |||||
|---|---|---|---|---|---|---|---|---|---|---|---|
| min | max | min | max | min | max | min | max | min | max | ||
| Moisture | % | 12 | 12 | 12 | 12 | 12 | |||||
| Crude protein(Nx6.25) | % | 39 | 38 | 37 | 36 | 35 | |||||
| Crude lipid | % | 4 | 4 | 4 | 4 | 4 | |||||
| Crude fibre | % | 3 | 3 | 3 | 3 | 3 | |||||
| Ash | 17 | 17 | 17 | 17 | 17 | ||||||
| Water stability** | % | 90 | 90 | 85 | 85 | 85 | |||||
| Free nitrogen | % | 0.15 | 0.15 | 0.15 | 0.15 | 0.15 | |||||
| Microbial contamination | |||||||||||
| total bact.count: | col/g | 7.5x10³ | 7.5x10³ | 7.5x10³ | 7.5x10³ | 7.5x10³ | |||||
| fungi: | col/g | 50 | 50 | 50 | 50 | 50 | |||||
| salmonella: | neg. | 25 g | 25 g | 25 g | 25 g | 25 g | |||||
| Antibiotics | |||||||||||
| oxytetracycline: | n.s. | n.s. | n.s. | n.s. | n.s. | ||||||
*
col = colonies;
n.s. = not significant;
neg. = negative in
**
% remaining after 2 hours in water
A circular letter of the Minister of Agriculture to all governors, dated 4 October 1973, states that the fish meal supply can be obtained from fisheries waste products, and was issued to reinforce efforts to increase village processing industries.
Presidential Decree No. 85, 1982 regulates the use of the shrimp by-catch which has to be rendered to the Fisheries State Enterprise for utilization according to the public interest.
CURRENT PROBLEMS AND CONSTRAINTS
Efforts to develop the aquafeed industry have encountered several constraints, as noted below.
Lack of raw materials
One of the constraints in the aquafeed industry is the supply of raw materials. Up to now, the primary raw materials for shrimp feed, i.e. fish meal and soybean meal, are still mostly imported. Local raw materials are inadequate to meet the need, and their quality is sometimes inconsistent. In addition, their price is still relatively high. Actually, Indonesia has the potential to provide adequate amounts of fish meal. However, due to the high price of trash fish in some regions, the price of fish meal is also high. Trash fish prices in Indonesia range from US$ 0.13-0.51/kg. Assuming that 1 kg of trash fish can be processed into 0.25 kg of fish meal, the raw material cost of the fish meal would be US$ 0.51-2.06/kg. Assuming that the feed formula requires 20% of fish meal, this would contribute up to US$ 0.41/kg of feed produced.
Lack of research and development funding
While fish generally consume feed quickly, shrimp eat their feed slowly. Shrimp feed should therefore have a higher water stability than fish feed. Manufacturing feed with good water stability requires certain conditions, such as fine feed particles, high pressure and temperature, as well as moisture during feed processing. Factories should be provided with equipment suitable for producing good quality feed to meet the requirements. As a consequence, high levels of investment are required for equipment. Table 15 shows the requirements of shrimp and fish feed in terms of texture and water stability.
With the promising development of fish and shrimp hatcheries, research and development on artificial larval feeds is urgently required. Physical and chemical criteria for larval feeds differ from grow-out feeds. Thus, in turn, different information, techniques and equipment are also required. So far, there is a lack of facilities for larval feed development. Research funds are always scarce.
| Nature of feed | Texture | Water stability |
|---|---|---|
| Fish | fairly refined (0.6mm) | low (15-20minutes) |
| Shrimp | refined (0.4mm) | high (<3 hours) |
Source: Djajasewaka and Sumpeno (1986)
Lack of larval feed manufacturing
Up to now the aquafeed industry in Indonesia has focused on producing grow-out feeds. The hatchery industry, particularly that for tiger shrimp hatcheries, requires good quality larval feeds, even though demand is less than for grow-out feeds in terms of quantity.
At present, all the larval feeds used in Indonesia are imported from Taiwan, Japan and Europe. Without competition from the local feed industry, the price of imported larval feeds will be inflated. While the price of grow-out feeds is around US$ 1.29/kg, the average price of larval feed is US$ 70/kg, fifty-two times as much.
TRENDS IN AQUAFEED MANUFACTURING AND USE
Opportunities to develop the fish and shrimp feed industry are technically determined by the rate of development of aquaculture itself. A significant non-technical factor is the negotiation common between feed producers and fish farmers or fisheries entrepreneurs to settle the price of feed. The price of feed should be proportional to the feed quality and its ability to raise productivity.
Diversification of feed products
Diversification of cultured species will affect the availability of feed. In the last two years, red tilapia has become a local as well as export commodity. Besides that, the government is trying to increase the number of species cultured in freshwater, brackishwater and marine farms (including seabass and groupers). It is thus crucial to develop feeds for every species of fish or shrimp reared. At present, artificial feeds for red tilapia, milkfish, catfish and shrimp are produced. New species will require new feed formulations.
Possibilities for farm-made feed manufacturing
A cursory study shows that feed companies are now capable of responding quickly to the needs of fish farmers and entrepreneurs. Once the culture of a certain species is introduced, most of the feed companies make feeds for it available. Their response does not only concern production, but also the provision of services to customers. Good cooperation between fish farmers and feed producers will stimulate increased production.
Provided that cooperation between feed producers and consumers is improved and that feed prices becomes proportional to quality, all fish farmers are expected to become dependent upon the feed industry. To some extent, this will bias the larger-scale farmers against producing their own feed.
Projected growth of aquafeed manufacturing and use
The fish and shrimp feed industry has great potential for expansion, which is closely related to the development of fish and shrimp culture itself. The growth of fish culture shows a promising annual increase; in the case of pond and cage culture, production is increasing at around 12% and 44% respectively (Anon. 1990).
Further increases in production are likely, particularly in shrimp culture. This is supported by intensification, the rate of which is around 10% per year, and by the expansion of the area under shrimp farming. Accordingly, the requirement for feed will also increase. However, the increase in the amount of feed required will not exactly correspond to the scale of intensification, since the latter also includes semi-intensive systems. So far the FCR in intensive pond culture is about 1.6:1, while in semi-intensive pond culture it is 2.0:1. The average production in intensive ponds is about 5 t/ha/yr. In semi-intensive ponds, it is around 1.2 t/ha/yr. The potential for the use of aquafeeds for shrimp culture, as estimated by Hardjolukito in 1989, is shown in Table 16 and Figures 1 and 2.
The development of aquafeeds for other species also has good potential, due to the increase in the number of species cultured in both brackish and freshwater. As noted before, according to fisheries statistics for 1990, the production of freshwater aquaculture in cages is increasing rapidly, by 44.3% per year. This trend is likely to continue. Finally, common carp and red tilapia will require higher quality feed than that currently available.
| 1987 | 1988 | 1989 | 1990 | 1991 | |
|---|---|---|---|---|---|
| Pond area (ha) | |||||
| - total area | 249,000 | 257,466 | 266,220 | 275,271 | 284,631 |
| - intensive | 3,886 | 4,275 | 4,702 | 5,172 | 5,690 |
| - semi-intensive | 33.964 | 37,360 | 41,097 | 45,206 | 49,727 |
| - extensive | 211,150 | 215,831 | 220,421 | 224,893 | 229,214 |
| Production (t) | |||||
| - total production | 121,591 | 128,820 | 136,604 | 144,993 | 154,042 |
| - intensive | 19,430 | 21,373 | 23,510 | 25,861 | 28,448 |
| - semi intensive | 38,816 | 42,698 | 46,968 | 51,664 | 56,830 |
| - extensive | 63,345 | 64,749 | 66,126 | 67,468 | 68,764 |
| Feed requirement (t) | |||||
| - total requirement | 71,847 | 79,032 | 86,935 | 95,628 | 105,191 |
| - intensive | 33,031 | 36,334 | 39,968 | 43,964 | 48,361 |
| - semi-intensive | 38,816 | 42,698 | 46,967 | 51,664 | 56,830 |
| - extensive | 0 | 0 | 0 | 0 | 0 |
| 1992 | 1993 | 1994 | 1995 | |
|---|---|---|---|---|
| Pond area (ha) | ||||
| - total area | 294,308 | 304,315 | 314,661 | 325,360 |
| - intensive | 6,259 | 6,884 | 7,573 | 8,330 |
| - semi-intensive | 54,699 | 60,170 | 66,186 | 72,805 |
| - extensive | 233,350 | 237,261 | 240,902 | 244,225 |
| Production (t) | ||||
| - total production | 163,811 | 174,365 | 185,776 | 198,123 |
| - intensive | 31,292 | 34,422 | 37,864 | 41,650 |
| - semi intensive | 62,514 | 68,765 | 75,641 | 83,206 |
| - extensive | 70,005 | 71,178 | 72,271 | 73,267 |
| Feed requirement (t) | ||||
| - total requirement | 115,711 | 127,281 | 140,010 | 154,010 |
| - intensive | 53,197 | 58,516 | 64,368 | 70,805 |
| - semi-intensive | 62,514 | 68,765 | 75,642 | 83,205 |
| - extensive | 0 | 0 | 0 | 0 |
Assumptions:
Intensive ponds-private investment progamme, 5 t/ha/yr, 1.6:1 FCR
Semi-intensive ponds-intensification progamme, 1.2t/ha/yr, 1.0:1 FCR
Extensive ponds-0.03 t/ha/yr
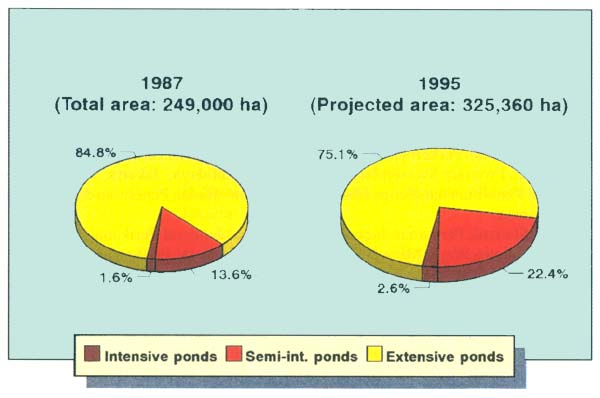
Figure 1. Share of shrimp culture systems in Indonesia in 1987 and projection for 1995
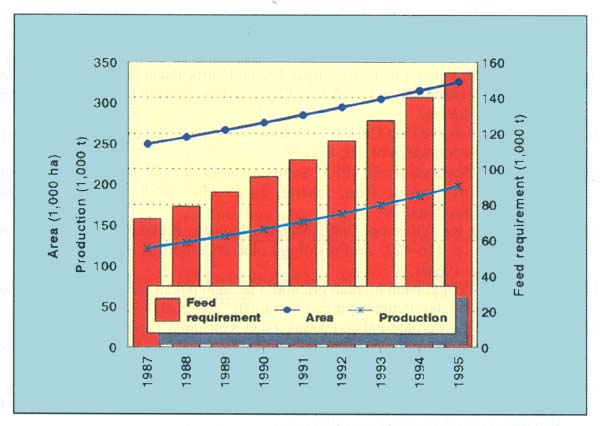
Figure 2. Projected shrimp farm area, production and feed requirement in Indonesia
LIST OF REFERENCES
Anon. 1985 a. Kemungkinan Pengalokasian Sebagian Sumberdaya Hayati Perikanan Untuk Bahan Baku Tepung Ikan. Rapat Teknis Tepung Ikan, Jakarta, 28-29 May 1985. Badan Penelitian dan Pengembangan Pertanian.
Anon. 1985 b. Permasalahan Produksi dan Konsumsi Tepung Ikan. Rapat Teknis Tepung Ikan, Jakarta, 28-29 May 1985. Badan Penelitian dan Pengembangan Pertanian.
Anon. 1989. Status dan Perkembangan Industri Pakan, p. 1-20. In Temu Karya llmiah Penelitian Menuju Program Swasembada Pakan Ikan Budidaya. Jakarta, 30-31 August 1989. Pusat Penelitian dan Pengembangan Perikanan. Badan Penelitian dan Pengembangan Pertanian.
Anon. 1990. Statistik Perikanan Indonesia. Direktoral Jenderal Perikanan. 74 p.
Anon. 1992. Buletin Warta Mina No. 68. Direktorat Jenderal Perikanan, Jakarta. 43 p. Ariyani, F. 1989. Pemanfaatan Limbang Udang Sebagai Komponen Pakan Udang, p. 96-106. In Temu Karya Ilmiah Menuju Swasembada Pakan Ikan Budidaya. Jakarta, 30-31 August 1989. Pusat Penelitian dan Pengembangan Perikanan. Badan Penelitian dan Pengembangan Pertanian.
Bastari, T. 1989. Status dan Proyeksi Bahan Baku Pakan Ikan. Temu Karya Ilmiah, p. 6-10. In Penelitian Menuju Swasembada Pakan Ikan Budidaya. Jakarta, 30-31 August 1989. Pusat Penelitian dan Pengembangan Perikanan. Badan Penelitian dan Pengembangan Pertanian.
Djajasewaka, H. and S. Ningrum. 1985. Kualitas dan Kuantitas Tepung Ikan dalam Ransum Ikan. Rapat Teknik Tepung Ikan. Jakarta, 28-29 May 1985, Badan Penelitian dan Pengembangan Pertanian.
Djajasewaka, H. and P. Sumpeno. 1986. Peranan Pakan Dalam Budidaya Ikan dan Udang, Seminar Hari Pangan Sedunia ke VI. Jakarta, 16 October 1986.
Hardjolukito, S. 1989 a. Prospek Pengembangan Pabrik Pakan Udang Dalam Persangan Dengan Pakan Impor Pada Situasi Pasaaran Udang yang menurun, p. 88-94. In Prosiding Lokakarya Industri Budidaya Udang. Balai Budidaya Air Payau Jepara.
Hardjolukito, S. 1989 b. Potensi Pengem bangan Usaha Pabrik Pakan Udang dan Peranan Pola TIR dalam distribusinya. Lokakarya Efisiensi Penggunaan Pakan Udang. Direktorat Jenderal Perikanan.
Jangkaru, Z. 1981. Intensive Fish Culture in Indonesia. Indonesian Agricultural Reasarch and Development Journal, Vol. III, 4:95-98.
Martosubroto, P. and N. dan Nurzali. 1985. Sumberdaya Perikanan dan Industri Tepung Ikan. Rapat Teknis Tepung Ikan, Jakarta, 28-29 May 1985. Badan Penelitian dan Pengembangan Pertanian.
Martosubroto, P. and R. Wibisono. 1989. Menuju Industri Budidaya Udang Berwawasan Lingkungan, p. 116-122. In Prosiding Lokakarya Industri Budidaya Udang. Balai Budidaya Air Payau.
Mathius, I.W. 1992. Penggunaan hijauan glicinidia sebagai pakan pengganti hijauan lomtoro. Jurn. Penelitian dan Pengembangan Pertanian, Vol. X, 1:1-7.
Poespodiharno, S. 1985. Peronasalahan Produksi dan Konsumsi Tepung Ikan. Rapat Technis Tepong Ikan. Jakarta, 28-29 May, 1985. Pusat Penelitan dan Pengenbangan Perikanan. Badan Penelitian dan Pengenbangan Pertanian.
Poernomo, A. 1985. Persyaratan Pakan Untuk Budidaya Pantai. Rapat Teknis Tepung Ikan. Jakarta, 28-29 May 1985. Pusat Penelitian dan Penembangan Perikanan. Badan Penelitian dan Pengembangan Pertanian.
Wahyono, U. 1989. Status Produksi Udang Indonesia. Lokakarya Industri Udang. Jepara, 25- 28 September 1989.
| Name of Company | Office address | Factory location | Capacity (t/yr) |
|---|---|---|---|
| Arumbai Arika Teknik | Jl. Karet No. 147 (atas) Surabaya | Anbon, Malukn | 120 |
| Abuhasdha & Co. | Jl. Kyai Caringin No. 148 Jakarta | Ternate, Maluku | 5,040 |
| Ariyo Sentosa Wahana | Jl. Ratulangi No. 132 Ujung Pandang | Ujung Pandang | 6,000 |
| Binstra Trading Co. | Jl. Bangka No. 4/I Mampang Prapatan Jakarta Selatan | Kodya Padang | 3,300 |
| Bali Kota Baru Fish Meal Mfg. Co. | Jl. Gunung Sahari No. 29 Jakarta | Kuala karang Kalimantan Barat | 12,000 |
| Banda Sea Tuna Fisheries | Jl. Mangga Besar Raya No. 68A, Jakarta | Ternate, Maluku | |
| Bina Kemakmuran Jaya | Jl. K.H. Hasyim Ashari No 28A, Jakarta | Kendari, Sulawesi | 2,000 |
| Sinar Mahakam Company | Jl. Dr. Tehupriry SK 42/33 Ambon, Maluku | Maluku | 360 |
| Merdeka Jaya | Jl. Kesehatan No. 27 Jakarta | Jayapura, Irian Jaya | 5,500 |
| CV. Bumi Indo | Jl. Tirta Suam No. 1 Mojokerto, Jawa Timur | Mojokerto, Jawa Timur | 12,000 |
| CV. Duta Samudera Jaya | Jl. Imam Bonjol No. 94 Denpasar | Badung, Bali | 3,000 |
| CV. Inkud (Bali) | Jl. Letjen. S. Parman Kav. 80, Jakarta | Badung, Bali | 7,800 |
| Sumber Tuna Cakalang | Jl. Cideng Barat No. 16 Jakarta | Lembar, Sulawesi Tenggara | 120 |
| Pelagis Samudera Lestari | Jl. Ps. Minggu Raya 99A-B Jakarta | Pelabuhan Perikanan Jakarta | |
| Sami Rahayu Bali | Jl. Gatotkaca No. 170 Bali | Pengambengan Negara Bali | 3,840 |
| Cakalang Pitu | Jl. Jenderal Sudirman 57 Jakarta | Periran Sulteng dan | 86 |
| Bali Raya | Jl. Benoa Sanggaran Denpasar | Badung, Bali | 10,000 |
| Samudera Rejeki Murni | Jl. Bungur Besar Raya No. 39 Jakarta | Tanjung Leidong, Tanjung Balai, Asahan Sumatera Utara | 3000 |
| Third World Fisheries | Jl. Amanagappa No. 3 Ujung Padang | Maros, sulawesi Selatan | |
| Pasific Fish Meal | 900 | ||
| Slamet Jadi | 1,800 | ||
| Hasil Laut Sibolga | 396 | ||
| Altantic Utama Fishery Industry | 2,500 | ||
| Halpindo | 1,800 | ||
| Praban Sari Pasific | 1,200 | ||
| Tri Bakti I | 900 | ||
| Tri Bakti II | 334 | ||
| Muncar | 900 | ||
| Indo bali | Tegal Badeng, Negara, Bali | 1,500 | |
| Bali Maya Permai | Tegal Badeng, Negara, Bali | 3,600 | |
| Bali Indan | Balambangan Negara | 3,600 | |
| Sarana Nelayan | teluk Bagan, Samarinda | 720 | |
| deho Canning Co. | Jl. dr. Sutomo 11 | 60 | |
| Suri Irian Jaya | Sorong, Irian Jaya | 300 | |
| Bangka Pioneer | Kp. Merawang Kendo Baturasa, Bangka | 600 | |
| Central Jawa Cold Storage | Jl. Citandui, | 1,800 | |
| Fish Mando Fishery | Kamp. Muncar-Baturasa | 7,500 | |
| Bangka Pioneer Industry | Kp. Merawang Kendo Baturasa, Bangka | 7,920 | |
| Prabawa Sari Pasific | Desa Penipahan, Kec. Kubu Bengkalis Riau | 2,400 | |
| Indonesia Fishing | Muncar, Jatima | 10,000 | |
| UD. Santosa | Muncar, Jatim | 5,000 | |
| Blambangan Raya | Muncar, Jatim | ||
| UD. Sumber Jala | Muncar, Jatim | ||
| Mega Muncar | Muncar, jatim | ||
| NV. Mucar | Muncar, Jatim | ||
| Enggeng Metem Camp | Samarinda,Kaltim | ||
| Daya Guna Samudera | Dobo, P. Aru | ||
| Maya Muncar | Muncar, Jatim | 5,000 | |
| Total | 134,896 |
| Name of company (Shrimp feed brand) | Installed capacity (t/yr) | Actual production (t/yr) | ||
|---|---|---|---|---|
| Head office address | Company address | |||
| 1. NORTH SUMATERA | ||||
| PT. Mabar Feedmill (Mabar Feed) | ||||
| Jl. Rumah Potong Hewan 44 | Jl. Belawan Km 9, Medan | 18,000 | 6,000 | |
| Desa Mabar, Medan | Tel.: (62-61) 29-759 | |||
| Tel.: (62-61) 612-244, | 24-920 | |||
| 612-252, 612-451 | Tlx.: 51967 MABAR IA | |||
| Fax.: (62-61) 512-233 | ||||
| Tlx.: 51967 MABAR IA | ||||
| PT. Charoen Pokphand Indonesia | (CP Bintang, Irawan, Novo) | |||
| Jl. Medan Tanjung Morawa | Jl. Medan Tanjung Morawa | |||
| Km 8.5, Medan | Km 8.5, Medan | |||
| P.O.Box 306/MDN | P.O.Box 306/MDN | |||
| Tel.: (62-61) 27-724/27-790 | Tel.: (62-61) 27-724/27-790 | |||
| Fax. : (62-61) 28-999 | Fax. : (62-61) 28-999 | |||
| Tlx. : 51729 POKPHAND MDN | Tlx. : 51729 POKPHAND MDN | |||
| 2. WEST JAVA | ||||
| PT. Winayaharjautami (Aquafeed) | ||||
| Blok Caringin 9, Cigondewah | Blok Caringin 9, Cigondewah | 12,000 | 1,000 | |
| Bandung | Bandung | |||
| Tel. : (62-22) 631-066 | Tel. : (62-22) 631-066 | |||
| 634-929 | 634-929 | |||
| Fax. : (62-22) 611-694 | Fax. : (62-22) 611-694 | |||
| 634-898 | 634-898 | |||
| Pega Pakan Sejati (Pega Pakan) | ||||
| Jl. Kebon Kacang Raya 1 | Jl. Industri II Blok J, | 7,200 | 1,000 | |
| Jakarta | No.5, Kawasan Industri | |||
| Tel. : (62-21) 321-208 | Jatake, Tangerang | |||
| 335-677, 336-772 | ||||
| Fax. : (62-21) 513-041 | ||||
| Tlx. : 62338 PEGA IA | ||||
| PT. Nugraha Mitra Jaya (Raja Udang) | ||||
| Jl. P Jayakarta 121/11 | Jl. Batuceper Dalam I | 1,000 | 750 | |
| Jakarta | Tangerang, Jabar | |||
| Tel. : (62-21) 639-8366 | ||||
| 659-539 | ||||
| PT. President Feed Indonesia (President Feed) | ||||
| Wisma Argo Manunggal Lt 9 | JI.Raya Pengas Dengklok | 25,000 | 4,000 | |
| Jl. Galot Subrolo Kav. 22 | Km 2-3, Desa Tunggak Jati | |||
| Jakarta | Karawang | |||
| Tel.:(62-21)514-314 | Tel.(62-267)81-088,81-103 | |||
| Fax.:(62-21)514-857 | Fax.: (62-267)81-089 | |||
| Tlx. : 514317FUMIRA IA | ||||
| PT. Bestari Indo Prima (Bestari) | ||||
| Gedung Galva Lantai V | JI. Raya Pasar Kemis Km 4,1 | 36,000 | ||
| Jl. Hayam Wuruk 27 | Kp. Gelam Ds. Kutajaya | |||
| Jakarta 10120 | Tangerang | |||
| Tel. : (62-21)385-4994 | Tel.: (62-82)132-238 | |||
| Fax.: (62-21)380-4908 | ||||
| 380-5886 | ||||
| Tlx.: 42764 GT IA | ||||
| PT. Shinta Prima Feedmill (Percobaan) | ||||
| Jl. Sulaiman 25, Slipi, | Desa Narogong, Cilengsi | 7,500 | ||
| Jakarta Barat | Bogor, Jabar | |||
| Tel.: (62-21)548-0959 | ||||
| 548-0372,548-1379 | ||||
| Tlx.: 45941 MECOSIA | ||||
| Cable: SHINTAFEED, Jakarta | ||||
| PT. Central Pangan Lestari (Bintang,Irawan, CP) | ||||
| Jl. Parangtritis Raya 1 | JI. Raya Krawang-Cikampek | |||
| Jakarta 14430 | Km 17, Desa Purwasari | |||
| Tel.: (62-21)686-537/39. | Cikampek | |||
| Fax.: (62-21)686-538 | P.O.Box46/CKP | |||
| Pabrik Pakan Udang TIR (TIR Feed) | ||||
| Gdg. Hanurata Graha Lt. 6 | Proyek TIR, Karawang | 2,000 | 500 | |
| Jl.Kchon Sirih 67-69 | ||||
| Jakarta | ||||
| Tel..: (62-21)305-3243 | ||||
| PT. Grobest Indomakmur (Chuen Shin) | ||||
| Jl- Daan Mogot 119B/6 | JI. Industru VI/6 | 28,800 | 6,000 | |
| Jakarta | Kawasan Industri | |||
| Tel.: (62-21)560-3732 | Jataka, Tangerang | |||
| 566-5922/25 | Jabar | |||
| PT. Kartika Americia Aquasys (Kartika) | ||||
| JI.Sadar l.No. 1-5 | JI. Mundu Pesisir 32 | 10,800 | ||
| Jakarta 10130 | Km 4,2, Cirenbon | |||
| Tel.: (62-21)380-3464 | Tel.: (62-231) 27-433 | |||
| 380-3494 | 27-466 | |||
| Fax.: (62-21)380-3536 | Fax.: (62-231) 26-137 | |||
| 380-7199 | ||||
| PT. Duta Persada Union (Dupper-U) | ||||
| Jl. Raya Banten Komplek Sapta | JI. Rya Banten Kompiek Sapte | 4,800 | 1,000 | |
| Marga 147, Serang, Banten | Marga 147. Serang, Banten | |||
| Tel. : (62-254) 81-422 | Tel. : (62-254) 81-422 | |||
| PT. Bina Pemuda Industri Krawang | ||||
| Jl. A. Yani/Bypass 17 | Krawang, Jabar | |||
| Krawang | ||||
| PT. Inter Niaga Makmur (Super Pelet) | ||||
| Jl. Raya Kemayoran | Kuningan, Jabar | |||
| Gempol 81, Kemayoran | ||||
| Jakarta | ||||
| PT. Hanaqua Feedmill Indonesia (Hanaqua) | ||||
| Delta Building Blok C-12 | JI. Ds.Curug Kulon | 21,000 | ||
| Jl. Suryopranoto 1-9 | Tabgerang | |||
| Jakarta | ||||
| Tel. : (62-21) 854-0402 | ||||
| PT. Mitra Manggalindo | ||||
| Jl. Cengkeh 8B-10 | Miara Baru Ujung Blk,N | |||
| Jadarta | Kav, 3-4., Penjaringan | |||
| Tel. : (62-21) 690-1577 | Jakarta Utara | |||
| PT. Cargill Indonesia (Cargill) | ||||
| P.O.Box 129/Kby-B | Ds. Tanjung Udik | 12,000 | ||
| Kebayoran Baru, Jakarta | Gunung Putri, Bogor | |||
| PT, Panggung Interprises | ||||
| Jl. Jembatan Tiga Barat | Tanjung Pasir, Tangerang | 9,600 | ||
| Blok E/12 | ||||
| Muara Karang, Pluit | ||||
| Jakarta | ||||
| Tel.: (62-21)668-1021 | ||||
| Fax.: (62-21)660-2689 | ||||
| Tlx.: 41266 NATEK IA | ||||
| PT. Metro Inti Sejahtera | ||||
| Kampung Pondok Ungu | Kampung Pondok Ungu | 6,000 | ||
| Kelurahan Medan Satria | Kelurahan Medan Satria | |||
| Bekasi Km 29 | Bekasi Km 29 | |||
| PT. Nagarona Langkah Maju (Nagarona) | ||||
| J1.0rpa23A | ||||
| Jakarta | ||||
| Tel.: (62-21)675-906 | ||||
| 676-761 | ||||
| 3. CENTRAL JAVA | ||||
| PT. Pulau Madu (Tiger Brand) | ||||
| Jl. Brigjen Sudiarto 198/443 | Kabluk, Semarang | |||
| Semarang | ||||
| Tel. : (62-24) 27-759 | ||||
| PT. Ika Putra Feedmill | ||||
| Jl. KHM. Mansyur 87 | ||||
| Pekalongan, Semarang | ||||
| 4. EAST JAVA | ||||
| PT. Bamaindo Foodstuff (Bama) | ||||
| Andhika Plaza Building | JI.Raya Gedangan | 15,000 | 4,000 | |
| Blok B 1-2 | Desa Tebel | |||
| Jl. Simpang Dukuh 38-40 | Sidoarjo | |||
| Surabaya | Tel.(62-3129)41-467,41-968 | |||
| PT. Central Proteina Prima (Bintang, Irawan, CP) | ||||
| Jl. Parangtritis Raya 1 | Jl. Dupak Rukun | 48,000 | 2,500 | |
| Jakarta | Tromol Pos 5018, Surabaya | |||
| Tel. : (62-21)686-537/39 | Tel.: (62-31)21-973/5 | |||
| PT. Wirifa Sakti (Galina) | ||||
| Jl. Rungkut Industri | Jl. Rungkut Industri | 1,200 | 100 | |
| III/48B | III/48B | |||
| Surabaya | Surabaya | |||
| PT. Matahari Sakti (Feng Li) | ||||
| Jl. Margo Mulyo Industri I | JI. Margo Mulyo Industri | 7,500 | 1,500 | |
| Kav.A 10-13 | Kav.A 10-13 | |||
| Tandes Commersial Estate | Tandes Commersial Estate | |||
| Surabaya | Surabaya | |||
| Tel.: (62-31)333-983 | Tel.: (62-31)333-983 | |||
| 334-014 | 334-014 | |||
| Fax.: (62-31)510-733 | Fax.: (62-31)510-733 | |||
| PT. Windu Fairly Int. (Fairly) | ||||
| Andhika Plaza Building | Desa Kedungrejo | 9,000 | 6,000 | |
| Blok B 13 | P.O. Box 6 Muncar | |||
| Jl. Simpang Dukuh 39-40 | Banyuwangi | |||
| P.O.Box 76, Surabaya | Tel.: (62-333)21-184 | |||
| Tel.: (62-31)511-662 | Fax.: (62-333)21-184 | |||
| Fax.: (62-31)514-112 | ||||
| PT. Golden Greatwall Ind. (Ta Chen) | ||||
| Ds. Cangkir, Driyorejo | Ds. Cangkir, Driorejo; | 12,000 | 5,400 | |
| Gresik Km 21.5. Jatim | Gresik Km 21.5, Jatim | |||
| Tel.: (62-31)833-3569 | Tel.: (62-31)833-3569 | |||
| 833-3579 | 833-3579 | |||
| PT. Karka Nutri Industri (Karka) | ||||
| Jl. Raya Darmo 23-25 | JI.Raya Pembangunan Km31 | 48,000 | 12,600 | |
| Surabaya | Tanggul Angin Sidoarjo | |||
| Tel.: (62-31)571-371 | Jatim | |||
| 576-538 | ||||
| Fax. : (62-31)572-318 | ||||
| Tlx. : 32155-33107 | ||||
| PT. Matandi Makmur | ||||
| Sugih Waras, Jenuk, Tuban | Sugih Waras, Jenuk, Tuban | |||
| Jatim Jatim | ||||
| PT. Suri Tani Pemuka (Comfeed) | ||||
| Jl. Basuki Rahmat 129 | JI. Raya Biduran Km 3.5 | 19,000 | 8,000 | |
| Po. Box 197, Surabaya | Sidoarjo | |||
| Tel. : (62-31) 43-395 | Tel.: (62-3129)21-961/64 | |||
| 5. SOUTH SUMATERA | ||||
| PT. Prayasa Mina Tirta | ||||
| Jl. Majapahit 34/2 | P. Bangka, Sumatra | 2,000 | ||
| Jakarta | ||||
| PT. Bangka Pioneer | ||||
| Jl. Kapt. A. Surahman 37-39 | ||||
| Pangkal Pinang | ||||
| Tel. : 22-256 | ||||
| 6. LAMPUNG | ||||
| PT. Jaka Utama Kraftfutter (Viterna) | ||||
| JL. Hayam Wuruk 47 | JI. Raya Kalianda Km 12 | |||
| Jadarta Pusat | Serengsem, Bandar Lampung | |||
| Tel.: 588-2085 | Tel.: 31-181/82 | |||
| 548-2085 | ||||
| 7. JAKARTA | ||||
| BinaSwadaya (Prori) | ||||
| Koperasi Pegawai Negri | JI. Gunung Sahari III/7 | |||
| Dinas Perikanan DKIJ | Jakarta Pusat | |||
| Jakarta | Tel.: 420-4402 | |||
| 8. SOUTH SULAWESI | ||||
| PT. Bukaka (Bukaka 66) | ||||
| Jl. HOS Cokroaminoto | ||||
| Ujung Pandang | ||||
| Institution | Activities | Area of study | Address | |
|---|---|---|---|---|
| Research | Development | |||
| Indonesian Science Institution | X | freshwater and brackishwater | ||
| Universities | X | freshwater and brackishwater | ||
| Freshwater Aquaculture Development Center | X | freshwater aquaculture | Ji.Selabintana 17 Sukabumi | |
| Brackishwater Aquaculture Development Center | X | brackishwater aquaculture | Jl. Pemandian Kartini P.O.Box 1 Jepara | |
| Marine Culture Development Center | X | marine aquaculture | P.O.Box 74 Teluk Betung Bandar Lampung | |
| Freshwater Fisheries Research Center | X | freshwater aquaculture | JI.Sempur No.1 P.O.Box 51 Bogor | |
| Coastal Aquaculture Research Center | X | brackishwater aquaculture | Alliri Tengah Village Maros | |
National Prawn Fry Production and Research Centre Kampung Pulau Sayak, 08500 Kota Kuala Muda, Kedah, Malaysia
UTAMA, C.M. 1993. Aquafeeds and feeding strategies in Malaysia, p.282-296. In M.B. New, A.G.J. Tacon and I. Csavas (eds.) Farm-made aquafeeds. Proceedings of the FAO/ AADCP Regional Expert Consultation on Farm-Made Aquafeeds, 14-18 December 1992, Bangkok, Thailand, FAO-RAPA/AADCP, Bangkok, Thailand, 434 p.
INTRODUCTION
The aquaculture industry in Malaysia is basically categorized into freshwater and brackishwater culture. Freshwater culture sites consist of freshwater ponds, freshwater cages and ex-mining pools. On the other hand, brackishwater culture includes brackishwater ponds, brackishwater cages, cockle, mussel and oyster culture (Figure 1). The area of fresh water and brackishwater aquaculture in 1990 is shown in Table 1.
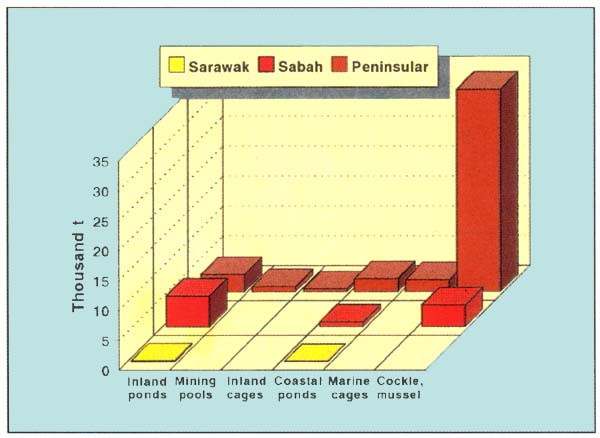
Figure 1. Estimated aquaculture production in Malaysia in 1990
| Region | ponds (ha) | Freshwater ex mining pools (ha) | cages (m²) | Brackishwater | |
|---|---|---|---|---|---|
| ponds (ha) | cages (m²) | ||||
| Peninsular Malaysia | 3,015 | 641 | 21,413 | 1,120 | 242,971 |
| Sarawak* | 211 | 0 | 0 | 0 | 0 |
| Sabah | 1,023 | 0 | 0 | 432 | 0 |
| Total | 4,249 | 641 | 21,413 | 1,552 | 242,971 |
* ponds constructed in 1990
Source: Department of Fisheries, Malaysia (1991).
Total aquaculture production in Malaysia was about 52,300 t in 1990 (Anon. 1991). Cockle production, at 37,514 t, accounts for 71 %, freshwater fish culture production, estimated at 9,690 t, accounts for 19% and brackishwater/ marine finfish and shrimp culture production, estimated at 5,100 t, accounts for 10% of total annual aquaculture production. The production, broken down by culture systems and by species, is shown in Tables 2 and 3, respectively, and illustrated in Figure 2.
| Region | Freshwater | Brackishwater | ||||
|---|---|---|---|---|---|---|
| ponds | ex mining pools | cages | ponds | cages | cockle & mussel | |
| Peninsular Malaysia | 2,900 | 905 | 516 | 2,195 | 2,055 | 33,874 |
| Sarawak | 169 | 0 | 0 | 50 | 0 | 0 |
| Sabah | 5,200 | 0 | 0 | 800 | 0 | 3,640 |
| Total | 8,269 | 905 | 516 | 3,045 | 2,055 | 37,514 |
Source: Deparartment of fisheries, Malaysia (1991).
| Species | Production |
|---|---|
| Local carp | 1,846 |
| Chinese and common carp | 3,154 |
| Freshwater prawns | 137 |
| Tilapia | 1,144 |
| Catfish | 198 |
| Sand gobi | 419 |
| Miscellaneous* | 2,792 |
| Inland sub-total | 9,690 |
| Seabass | 1,953 |
| Grouper | 144 |
| Mangrove snapper | 421 |
| Banana shrimp | 156 |
| Black tiger shrimp | 2,184 |
| Mud crab | 190 |
| Miscellaneous** | 52 |
| Coastal sub-total | 5,100 |
| Grand total | 14,790 |
* includes snakehead, river catfish and gouramy
** includes snapper, rabbitfish and horse mackerel
Source: Department of Fisheries, Malaysia (1991)
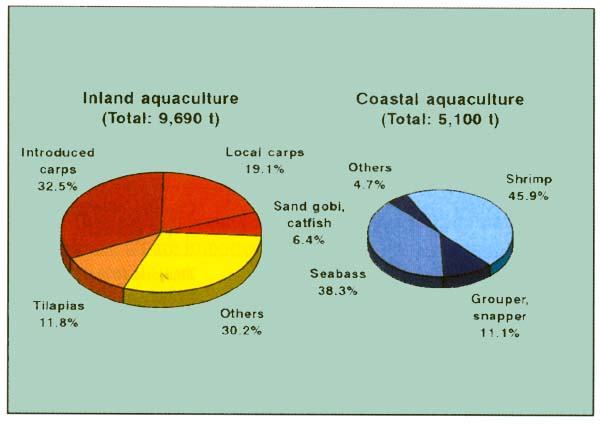
Figure 2. Cultured finfish and crustacean production in Malaysia by major species groups in 1990
It is recognized that formulated feeds are required to increase the productivity of cultured species. In Malaysia, utilization of formulated feed is common in the culture of marine shrimp, freshwater prawns, tilapia and catfish. Based on trials conducted in farmers' ponds, the cost of feed for culturing freshwater prawns ranged from 50% to 75% of operational costs (Yaakob 1991). From the information gathered from tiger shrimp farms in the northern region the cost of feed is estimated at around 50% to 60% of the production cost. In the case of tilapia culture in cages in the central region, the feed cost is more than 40% of the production cost.
AVAILABILITY OF FEED INGREDIENTS
When aquafeeds were first produced, they consisted of ingredients commonly used in animal feeds. Some of these ingredients were not suitable for the production of aquafeeds or were poorly digested by the cultured species. Since aquaculture species are more sensitive to the quality of ingredients and have higher nutritional requirements, most of the locally produced ingredients are not suitable for aquafeed production.
Most local feed mills, with their long experience in animal feed production, can source ingredients globally. However, for the sake of freshness, local or regional supplies are preferred. The main feed ingredients imported into Malaysia in 1990 are shown in Table 4, while the proximate composition of some of the available feed ingredients is shown in Table 5.
| Ingredient | Quantity (t) | Country of origin (% of total) |
|---|---|---|
| Fish meal | 23,627 | Thailand (67), Chile (9) |
| Invertebrate meal | 483 | Indonesia (51), Thailand (15) |
| Meat meal | 604 | France (47), New Zealand (37) |
| Soybean meal | 137,300 | China (88) |
| Corn | 112,000 | Thailand (46), China (22) |
| Wheat pollard/bran | 102,200 | - |
| Rice bran | 15,000 | Indonesia (71) |
| Corn bran | 6,500 | Argentina (80) |
| Groundnut meal | 46,100 | India (70), China (23) |
Source: Statistic Department of Malaysia (1991)
| Ingredients | No. of samples analyzed | Moisture (%) | Crude protein | Crude fat | Ash |
|---|---|---|---|---|---|
| (% of dry matter) | |||||
| Fish meal (Malaysian) | 4 | 9.9 | 57.6 | 7.5 | 32.0 |
| Fish meal (Thai) | 1 | 13.0 | 64.8 | 8.3 | 28.7 |
| Fish meal (Peruvian) | 1 | 12.7 | 70.7 | 8.5 | 16.8 |
| Fish meal (home-made) | 3 | 6.2 | 64.3 | 6.3 | 27.0 |
| Shrimp head meal | 1 | 8.3 | 29.1 | 3.3 | 58.0 |
| Shrimp meal | 2 | 13.6 | 70.1 | 4.1 | 24.7 |
| Meat and bone meal | 1 | 9.8 | 62.4 | 12.8 | 21.8 |
| Anchovy head meal | 3 | 12.5 | 59.6 | 8.3 | 34.7 |
| Squid head meal | 3 | 10.2 | 78.3 | 10.0 | 8.4 |
| Paste-shrimp meal | 2 | 8.5 | 67.4 | 4.7 | 21.6 |
| Soybean meal | 4 | 10.2 | 46.1 | 2.5 | 6.6 |
| Corn meal | 2 | 12.6 | 9.0 | 7.5 | 1.9 |
| Wheat pollard | 1 | 10.4 | 15.5 | 4.1 | 5.5 |
| Rice bran | 2 | 10.1 | 15.4 | 17.9 | 8.5 |
| Baker's yeast | 1 | 9.1 | 44.0 | 1.4 | 5.0 |
| Brewer's yeast | 1 | 5.1 | 59.4 | 1.1 | 8.3 |
Source: NAPFRE's Laboratory.
About 311,000t of trash fish was available in the country in 1990. Trash fish was used for feeding cultured finfish and crustaceans (like mud crab) and for manufacturing fish meal.
AQUAFEED MANUFACTURING INDUSTRY
Shrimp
More than a dozen brands of formulated larval feeds are available in the market, but almost all are imported. However, they are generally being used to supplement natural food.
Almost all marine shrimp farmers use dry formulated feeds for the growout phase. Only three out of the more than 10 brands of shrimp feeds available are produced locally. Most imported brands are from Taiwan and Thailand. At least 50% of farmers indicate a preference for imported feeds. One of the reasons given is the higher probability of inconsistent quality in local feeds, especially when the demand is high, while imported feeds are only slightly more expensive.
In freshwater prawn culture, only the large farms use dry commercial feeds while the smaller ones still depend on supplementary feeds (such as chicken entrails) in their grow-out phase. The main reason is that this type of feed is only processed by feed mills if farmers order a considerable quantity; it is not a stock item.
Finfish
At present, the rearing of finfish larvae totally relies on live food (such as rotifers, brine shrimp and cladocerans) depending on whether they are marine or freshwater species. Nursery and grow-out phases are fed with trash fish in the case of marine species. For freshwater species, dry formulated feeds are available but they are only widely used in tilapia and catfish culture, due to economic reasons.
General
The proximate composition of some of the aquafeeds available in the country is shown in Table 6.
| Species/stage Feed brand | Moisture (%) | Crude protein | Crude fat | Ash |
|---|---|---|---|---|
| (% of dry matter) | ||||
| Penaeus monodon-larvae | ||||
| Nippai B.P | 3.8 | 50.4 | 42.3 | 5.4 |
| Nippai A.S | 7.8 | 65.8 | 5.4 | 16.4 |
| Topal | 5.6 | 48.0 | 13.2 | 5.4 |
| Yeaster BMC | 2.5 | 49.0 | 31.1 | 5.5 |
| Yeaster TP-1 | 6.4 | 61.9 | 9.1 | 15.2 |
| Shrimp-gen | 1.0 | 35.7 | 26.4 | 9.5 |
| Frippak CAR #1 | 2.2 | 50.0 | 17.3 | 19.8 |
| Frippak CD #2 | 7.0 | 51.1 | 18.5 | 20.7 |
| Kyowa-Hakko A-250 | 5.0 | 52.6 | 24.7 | 11.1 |
| Higashimaru #0 | 8.7 | 53.7 | 5.2 | 18.3 |
| President HP #1 | 5.0 | 47.7 | 26.8 | 8.1 |
| Bio-science#0 | 7.0 | 49.4 | 4.0 | 21.5 |
| Hatchfry Encapsulon | 6.8 | 51.7 | 15.4 | 12.1 |
| Gold Coin | 4.5 | 42.0 | 15.2 | 16.1 |
| Shar Mio Pao | 6.1 | 42.6 | 5.5 | 28.1 |
| Gin Shar Miu | 8.0 | 41.6 | 2.5 | 33.3 |
| ZM | 4.3 | 50.9 | 8.6 | 8.7 |
| EPAC | 3.7 | 48.9 | 14.5 | 5.0 |
| Penaeus monodon-postlarvae | ||||
| Gold Coin | 9.8 | 41.8 | 5.0 | 13.6 |
| Nippai | 9.4 | 60.9 | 9.7 | 18.3 |
| Lucky Star | 10.4 | 46.8 | 7.9 | 15.4 |
| President | 13.9 | 45.1 | 7.3 | 22.3 |
| Chuen Chin | 7.8 | 40.3 | 5.5 | 19.3 |
| Higashimaru | 9.4 | 45.0 | 5.7 | 15.0 |
| CP | 7.7 | 43.8 | 7.4 | 13.4 |
| Penaeus monodon-grower | ||||
| Gim Hin | 8.3 | 44.4 | 7.8 | 13.3 |
| Gold Coin | 11.6 | 43.1 | 7.6 | 15.1 |
| Fuw-Sow | 9.8 | 43.1 | 9.7 | 12.2 |
| Lucky star | 11.3 | 41.1 | 5.0 | 12.7 |
| VIP | 9.4 | 48.7 | 9.5 | 18.9 |
| Victory | 10.5 | 42.0 | 8.5 | 16.0 |
| Marine Feed #5 | 10.7 | 44.2 | 9.4 | 15.5 |
| Leong Huat | 8.9 | 43.6 | 6.1 | 13.6 |
| Macrobrachium rosenbergii-larvae | ||||
| ACAL | 7.1 | 48.9 | 30.8 | 12.4 |
| SUTIMAL | 12.6 | 55.6 | 9.2 | 18.8 |
| Macrobrachium rosenbergii-grower | ||||
| Gold Coin | 8.2 | 35.6 | 4.7 | 12.8 |
| Tilapia - grower | ||||
| Gold Coin | 8.4 | 20.1 | 2.1 | 6.9 |
| DSM | 7.1 | 24.3 | 4.2 | 7.6 |
| Joy Fish | 6.7 | 23.5 | 1.6 | 6.3 |
Source: NAPFRE's Laboratory
ON-FARM FEED FORMULATION AND MANUFACTURING
At present freshwater fish culture is in a transitional phase where farmers are shifting from the traditional extensive culture systems, dependent on pond fertilization alone, to semi-intensive systems requiring supplementary feeding and some intensive culture systems requiring complete feeds (Figure 3). General observations indicate that the majority of the farmers practice semi-intensive culture. Among the commonly utilized supplementary feeds are chicken viscera, Napier grass, culled eggs, rice bran, bread crusts, noodle waste, soybean waste and the like (Figure 4). Farms which have developed on a commercial scale normally use factory-made feeds.
Figure 3. Cage culture of tilapia in an abandoned tin mining pit in Selangor, Malaysia
Figure 4. Soybean processing waste used as supplementary feed in Selangor, Malaysia
Currently marine shrimp culture, with initial stocking densities of at least 10/m², depends on factory-made aquafeeds. For finfish culture, trash fish is still the main feed.
Formulation and manufacturing of farm-made feeds is primarily carried out by government farms and research institutions. Typical formulae of farm-made feeds used for fresh water fish and marine shrimp are shown in Tables 7 and 8, respectively.
| Ingredients | % |
|---|---|
| Fish meal | 20.0 |
| Soybean meal | 29.2 |
| Copra cake | 19.8 |
| Maize | 2.0 |
| Rice bran | 27.5 |
| Vitamin mix | 0.5 |
| Mineral mix | 1.0 |
| Total | 100.0 |
Source: Pathmasothy (1989)
| Ingredients | % |
|---|---|
| White fish meal | 40.0 |
| Shrimp head meal | 15.0 |
| Soybean meal | 20.0 |
| Corn gluten | 5.0 |
| Wheat flour | 10.0 |
| Fish oil | 1.0 |
| Starch | 2.0 |
| Basfin | 0.3 |
| Vitamin and mineral mix | 6.7 |
| Total | 100.0 |
Source: Department of Fisheries, Malaysia (1990).
ON-FARM FEEDING STRATEGIES
Feed management is the most critical factor in determining the profitability of fish and shrimp farms, because of the high related input costs. The feeding behavior of cultured species dictates the feeding strategy. In freshwater fish culture floating feed is commonly used, especially for the culture of catfish and tilapia. Fish are fed to satiation at each feeding time, usually more than twice a day. When sinking pellets are used for feeding, the fish are normally fed two or three times a day at rates of 6% of body weight in the first month reducing to 2% in the last month of culture.
Marine shrimp are fed several times per day with a major portion of the daily feed allotment given at night. It is common practice to feed more to young juveniles than to adults. The feeding rate used is normally between 3-10% of body weight. However, the actual amount of feed given is judged by the appetite of shrimp. The main problem encountered in feed estimation is to assess survival rate which is difficult due to the benthic, cannibalistic and evasive nature of shrimp. However, farmers can estimate survival rate according to growth stage or by means of regular sampling at several spots in the pond. The unpredictability of survival underlines the need to monitor feed by consumption rather than to feed a calculated amount. Feed consumption is normally monitored by the use of feeding trays. Generally, six to eight feeding trays are used per hectare with a minimum of four trays per pond regardless of pond size. Approximately 1 -4% of the total feed provided per meal is given on feeding trays. Feed consumption on the feeding trays is monitored one or two hours after feeding, depending on the age of shrimp.
In the cage culture of marine fish, the fish are normally fed to satiation twice a day for seabass and once a day for groupers. The trash fish used is either chopped, or ground with a mincer.
MAJOR INSTITUTIONS INVOLVED IN AQUAFEED RESEARCH AND DEVELOPMENT
Research and development of aquafeeds is one of the responsibilities of the Department of Fisheries. The Department acknowledged the importance of formulated feeds when it established the feed section of the Fisheries Research Institute (FRI) in Penang in 1976. Since the establishment of the research branch of the Brackishwater Aquaculture Research Centre (BARC) in Johor in 1979, the feed section has been expanded to cover pond growout feeds for marine fish and shrimp. When the National Prawn Fry Production and Research Centre (NAPFRE) in Kedah was established in 1987, its feed section concentrated on larval and postlarval feeds for shrimp and other crustaceans (Figures 5 and 6). Research on freshwater fish feeds began in 1975 at the Freshwater Fish Research Centre (FFRC) in Malacca. Several universities also carry out aquafeed research, including the Universiti Pertanian Malaysia. The mailing addresses of the above institutes are given in Annex 1.
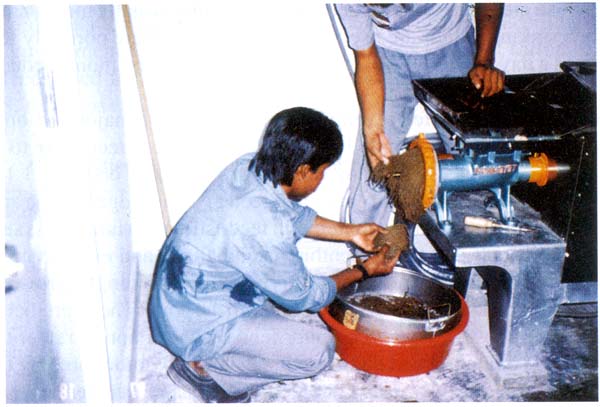
Figure 5. Preparation of farm-made feed at the National Prawn Fry Production and Research Centre (Kedah, Malaysia)
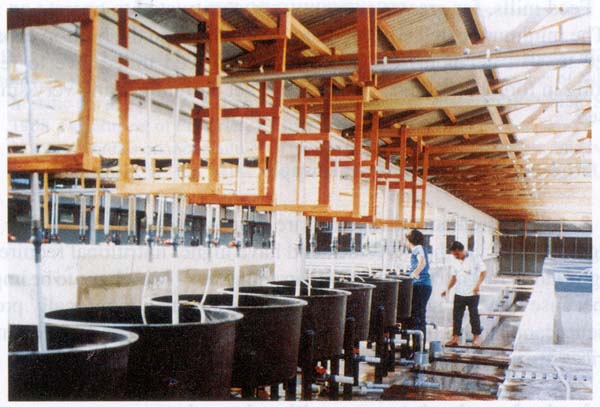
Figure 6. Feeding trials in indoor tanks at the National Prawn Fry Production and Research Centre (Kedah, Malaysia)
CURRENT NATIONAL REGULATIONS
There are no set standards or regulations imposed on local aquafeed mills. Their feeds are basically formulated on biological and economic considerations. There is, however, some concern regarding the use of certain antibiotics in aquafeeds. A 13% government tax is imposed on imported feeds to encourage the development of local aquafeeds. However, local feed mills also have to pay taxes on imported feed ingredients.
CURRENT PROBLEMS AND CONSTRAINTS
Small and dispersed markets
Total annual production of freshwater fish was around 9,700 t in 1990. Based on experience in the production of freshwater fish, the apparent feed conversion (AFCR) is estimated at 2.5. Thus 24,300 t of feed would be sufficient to feed all the cultured freshwater fish in the country, assuming that all fish were given formulated feeds alone. Pond experiments have shown that, in the case of black tiger shrimp and seabass, an AFCR of 2.5 can also be obtained with local feeds. Therefore another 12,800 t of feed would be sufficient to produce the 1990 production (5,100 t) of brackishwater/marine finfish and shrimp. The total feed for aquaculture species calculated in this arbitary way would amount to 37,100 t/yr, or 119 t/day (for 312 working day per year).
Feed mills, for greater economy, are constructed to operate on a large scale. The minimum batch size for many mills is 2 t and the built-in capacity is often 20 to 40 t per hour. Consequently, local feed mills have to resort to competing in foreign markets, the local market currently being very small and dispersed.
High quality raw material supply
Since cultured aquatic species are more sensitive to the quality of raw feed ingredients than other livestock and have higher nutritional requirements, only high quality raw materials are used in aquafeeds. Most have to be imported, either because they are not available locally or the quality of locally produced ingredients cannot meet the standards. Due to this great dependence on imports, feed prices are subject to the global supply and demand of ingredients.
Lack of precise data on nutritional requirements
Although approximate specifications for aquafeeds are available, precise data on the nutritional requirements of several cultured species are still lacking. This is reflected by the difference in performance of feeds with apparently the same nutritional specifications.
TRENDS IN AQUAFEED MANUFACTURING AND USE
There is considerable potential for aquaculture development in Malaysia, especially for marine shrimp farming. Such development, together with the trend towards increasing intensities of various culture systems, would lead to a greater demand for commercial feeds. The future for the feed milling industry is hence bright and there is considerable room for expansion.
LIST OF REFERENCES
Anon. 1991. Annual Fisheries Statistics 1990. Department of Fisheries, Malaysia. 172 p. Pathmasothy, S. 1989. The culture of all-male, all-female and mixed-sex batches of Nile tilapia in static pond, 9 p. In A.A. Jothy (ed.) Proceedings of Fisheries Research Seminar, 1988. Department of Fisheries, Kuala Lumpur.
Yaakob, A. 1991. Studies on monoculture of freshwater prawn: effectiveness and viability. Paper presented at the IRPA Seminar (Socio-economic Sector), UUM, Kedah, Malaysia.
Annex 1. Addresses of Malaysian institutions involved in aquafeed research
Fisheries Research Institute
11800 Glugor Penang
Brackishwater Aquaculture Research Centre
Fisheries Department of Malaysia 81550 Gelang Patah Johor
Freshwater Fish Research Centre
Fisheries Department of Malaysia Batu Berendam 75350 Melaka
National Prawn Fry Production and Research Centre
Kg. Pulau Sayak, 08500 Kota Kuala Muda Kedah
Universiti Pertanian Malaysia
Faculty of Fisheries and Marine Science Department of Aquaculture 43400 Serdang Selangor
Fisheries Development Division, Department of Agriculture, Harihar Bhawan, Pulchowk, Kathmandu, Nepal
PANTHA, M.B. 1993. Aquafeeds and feeding starategies in Nepal, p. 297-316. In M.B. New, A.G.J. Tacon and I. Csavas (eds.) Farm-made aquafeeds. Proceedings of the FAO/ AADCP Regional Expert Consultation on Farm-Made Aquafeed, 14-18 December 1992, Bangkok, Thailand. FAO-RAPA/AADCP, Bangkok, Thailand, 434 p.
INTRODUCTION
The kingdom of Nepal is situated along the southern slopes of the Himalayas. It is a landlocked, mountainous country in the South Asia region, lying between longitude 80°4" to 80° 12" east and between latitude 26° 22" to 30° 27" north. The total land area of the country is 147,180 km² of which two- thirds consists of hills and high mountains and one-third by the southern plain, the Terai. As shown in Table 1, agriculture, forest, pasture and water areas represent 18%, 38%, 13% and 3%, respectively. The climatic variation from north to south is very dramatic, in response to changes in altitude ranging from arctic, through alpine, to sub-tropical and tropical climates.
| Land use type | Total area (1,000 ha) | Share (%) |
|---|---|---|
| Agriculture | 2,653.3 | 18.0 |
| Forest | 5,533.4 | 37.6 |
| Snow-covered | 2,246.2 | 15.3 |
| Pasture | 1,978.5 | 13.4 |
| Water | 400.0 | 2.7 |
| Settlements and roads | 103.3 | 0.7 |
| Others(wasteland, barren land and slopes0 | 1,803.3 | 12.3 |
| Total | 14,718.0 | 100.0 |
Source: CBS (1992)
60-80% of the annual precipitation falls during the monsoon season (June to September); rainfall depends on the southeast winds. The average annual rainfall is about 1,600 mm. An extreme maximum temperature of 44°C was recorded at Dhangadhi in 1983. The population of the country is about 18.5 million, with a growth rate of 2.08% per annum (CBS 1992).
Nepal is predominantly agricultural. Nearly 90% of the population is involved in agriculture, which includes livestock, forestry and fisheries, accounting for about 56% of G.D.P. in 1990/91 (CBS 1992). Per caput animal protein consumption was 7.5 kg/yr in 1990, out of which fisheries contributed 809 g/yr (10.8%). Crops represented 61% of the agricultural GDP, while livestock contributed 27%, forestry 11% and fisheries only about 1%. The GDP per caput is estimated to be about US$ 170 in 1988/89. Agriculture accounts for about 75% of exports and it absorbs more than 90% of the labour force.
The total nutrients available per caput per day, in terms of calories, protein and fat in 1990/91 were 2,288 kcal, 61.5 g and 30.4 g respectively. The contribution of fish and fish products was extremely low (Table 2).
| Food items | Calories | Protein | Fat | |||
|---|---|---|---|---|---|---|
| (kcal) | (%) | (g) | (%) | (g) | (%) | |
| Crop based | 2,131.0 | 93.0 | 52.5 | 85.0 | 16.1 | 53.0 |
| Livestock based of which | 157.0 | 7.0 | 9.0 | 15.0 | 14.3 | 47.0 |
| - meat | 39.0 | 25.0 | 3.4 | 38.0 | 5.8 | 41.0 |
| - fish | 2.0 | 1.3 | 0.4 | 5.0 | 0.1 | 0.5 |
| - others | 116.0 | 73.7 | 5.2 | 57.0 | 8.4 | 58.5 |
| Total | 2,288.0 | 100.0 | 61.5 | 100.0 | 30.4 | 100.0 |
Source: MSD (1992)
Fish consumption, fisheries and aquaculture
The per caput availability of fresh fish was 0.86 kg/yr and of dried/ processed fish 0.01 kg/yr in 1990/91 (Table 3). Exports of fresh fish have declined from an estimated 3,000 t in the mid eighties to a few hundred tons annually, probably due to the overall effect of fish disease outbreaks (EUS) and increasing domestic demand.
| Commodity | Production (t) | Imports (t) | Exports (t) | Domestic supply (t) | Per caput availability | |
|---|---|---|---|---|---|---|
| (kg/yr) | (g/day) | |||||
| Fresh fish | 15,595 | 121 | 11 | 15,705 | 0.86 | 2.36 |
| Dried, processed fish | - | 212 | - | 212 | 0.01 | 0.03 |
Source: MSD (1992)
The demand for fish is very high and is met mainly by domestic production but partly by importing fish from neighbouring countries. Fish exports to India declined from 290 t in 1986/87 (APROSC 1989) to about 11 t in 1990/91 (MSD 1992).
The fisheries sub-sector provides a supplementary source of high-value but cheap animal protein. It also helps to create additional job opportunities and provides a higher income per unit area. In addition it helps to save foreign currency by substituting imports of fish and facilitating fish exports. Finally, the fisheries sub-sector helps in the utilization and exploitation of national land and water resources while maintaining ecological balance.
The main sources of water in Nepal are the small seasonal and large perennial rivers, of which there are more than 6,000. The glaciers and melting snow of the Himalayas constantly supplies water to the three major river systems, namely the Koshi, Gandaki and Karnali. Annual surface run-off from these rivers, including the catchment located in Tibet, amounts to 200,000 million m³. The total water surface area in the country is 4,000 km², 2.7% of the total land area (Table 1). Natural water bodies (rivers, lakes and reservoirs) constitute about 0.4 million ha (Table 4). There are about 5,000 ha of village ponds and about 325,000 ha of irrigated paddy fields.
| Type of water resource | Estimated area (1,000 ha) | Projected area (1,000 ha) |
|---|---|---|
| Natural waters | 401.4 | |
| of which | ||
| - rivers | 395.0 | |
| - lakes | 5.0 | |
| - reservoirs | 1.4 | 78.0 |
| Ponds | 5.0 | 14.0 |
| Irrigated rice fields | 325.0 | 700.0* |
| Total | 731.4 | 792.0 |
* additional area estimated by Sharma (1992)
Nepal, with an average width of 193 km and a difference in elevation of more than 8,800 m, has, within some river systems, habitats ranging from cold to warm water, and a corresponding range in fish species. Since almost all rivers flow into the Ganga river system in India, this also enriches the fish fauna of Nepalese rivers, although there are some non-migratory fish species. 172 indigenous fish species in the various water systems were reported by Rajbanshi (1982) and 176 by Terashima (1984). These occur from a few hundred metres elevation to 4,000 m above sea level. Besides these, ten warm and coldwater fish and one prawn species have been introduced into Nepal since 1956. Exotic fish species recommended for warm water aquaculture are common carp (Cyprinus carpio), silver carp (Hypophthalmichthys molitrix), bighead carp (Aristichthys nobilis), and grass carp (Ctenopharyngodon idella), along with three high-value indigenous fish species, namely rohu (Labeo rohita), mrigal (Cirrhinus mrigala) and catla (Catla catla).
Exotic fish species currently being cultured in various Fisheries Research Centres under experimental conditions are rainbow trout (Oncorhynchus mykiss), Nile tilapia (Oreochromis niloticus), Nasice carp (Cyprinus carpio - a Yugoslavian strain), and silver barb (Puntius gonionotus). Some exotic fish species introduced earlier but not now existing were amago (Oncorhynchus rhoduras) from Japan and brown trout (Salmo trutta) from the U.K. Introduction of the giant freshwater prawn (Macrobrachium rosenbergii) is made occasionally, for experimental purposes, either from Thailand or India. Tilapia mossambica was introduced by the fish farmers themselves, from India, without recommendation. Efforts are also being made towards the commercial production of three indigenous high-value coldwater fish species, namely asla (Schizothorax spp.), katle (Acrossocheilus hexagonalepis) and mahseer (Tor tor, T. putitora) (Pradhan 1987).
Fish production in Nepal is restricted to inland water bodies, mainly through capture fisheries in rivers, lakes, reservoirs, swamps and irrigated paddy fields and fish culture in traditional village ponds and new fish ponds. Traditionally, farmers used to allow flood water, which is a source of wild fish seed, to flow into their village ponds and paddy fields or stock wild seed collected from the rivers, resulting in an extensive fish production of less than 0.5 t/ha/yr.
Systematic aquaculture began in the late 1950's with the introduction of the exotic common carp. By 1960, fingerlings of common carp were successfully produced and distributed to fish farmers. Chinese carps (silver, bighead, and grass carps) were introduced after 1965, when induced breeding techniques were also adopted for the indigenous fish rohu, mrigal and catla (Pantha 1979). Fish polyculture, using all the seven fish species, started after 1980, with the launching of the First and Second Aquaculture Development Projects (Pantha 1991).
There are 13 Fisheries Development Centres in the country, out of which eight are in the Terai and are responsible for technology generation for warm water fish culture, providing support services, including training, to fish farmers. The rest are in the mountain regions for research on cage culture, coldwater fish species and indigenous fish species.
The fish production statistics of Nepal show that from 1979/80 to 1991/92 the fish culture area increased from 890 ha to 4,664 ha (424%) and aquaculture production rose from 1,150 t to 9,296 t (708%) (Table 5). Average capture fisheries production and the per caput fish consumption increased in the same period by 140% and 136%, respectively.
| Description | 1979/80 | 1986/87 | 1990/91 | 1991/92 | Increment 79/80- 91/92 (%) |
|---|---|---|---|---|---|
| Fish culture area (ha) | 890 | 4,070 | 5,180 | 4,664 | 424 |
| Fish production, total (t) of which | 3,350 | 10,715 | 15, 5, 595 | 16, 516 | 393 |
| - captured (t) | 2,200 | 5,281 | 5,281 | 5,281 | 140 |
| - cultured in ponds (t) | 1,150 | 5,434 | 10,314 | 9, 296 | 708 |
| - cultured in other waters (t) | n.a. | n.a. | n.a. | 1, 939 | |
| Fingerling distribution (million) | 4.17 | 18.16 | 40.63 | 46.90 | 1, 024 |
| Pond yield (t/ha) | 1.29 | 1.34 | 1.99 | 1.99 | 54 |
| Fish consumption (g/caput/yr) | 330 | 625 | 819 | 895 | 171 |
Source: FDD Annual Report 1991/92 (unpublished)
Seven fish species (all carps) are recommended by the government for polyculture. Stocking densities range from 7,000- 15,000/ha, depending on the intensity of production, but stocking is reduced to 5,000-10,000/ha when using large fingerlings of 2-3" size. The total pond area, total fish production and average yield for each species is shown in Table 6. The total fish production of the country coming from capture and culture operations in different water bodies was 16,516 t in 1991/92 (Table 7). The percentage of total fish production from different water bodies for 1991/92 is given in Figures 1 and 2. Stocking rates, fish mortality, average weight of harvested fish and the yield of each species is given in Table 8.
| Fish species | Water surface area (ha) | Production (t) | Average yield (t/ha) |
|---|---|---|---|
| Common carp | 997 | 1,916 | 1.92 |
| Silver carp | 949 | 1,825 | 1.92 |
| Bighead carp | 285 | 548 | 1.92 |
| Grass carp | 475 | 913 | 1.92 |
| Rohu | 759 | 1,460 | 1.92 |
| Mrigal | 522 | 1,175 | 2.25 |
| Catla | 677 | 1,459 | 2.16 |
| Total | 4,664 | 9,296 | 1.99 |
| Description | Cultured | Captured | Total | |||
|---|---|---|---|---|---|---|
| (t) | (%) | (t) | (%) | (t) | (%) | |
| Fishponds | 9,296 | 56.3 | - | - | 9,296 | 56.3 |
| Cages/enclosures | 62 | 0.4 | - | - | 62 | 0.4 |
| Ricefield | 13 | 0.1 | 1,219 | 7.4 | 1,232 | 7.5 |
| Lakes/reservoirs | 30 | 0.2 | 75 | 0.4 | 1.5 | 0.6 |
| Rivers | - | - | 3,950 | 23.9 | 3,950 | 23.9 |
| Swamps | 1,834 | 11.1 | 37 | 0.2 | 1,871 | 11.3 |
| Total | 11,235 | 68.1 | 5,281 | 31.9 | 16,516 | 100.0 |
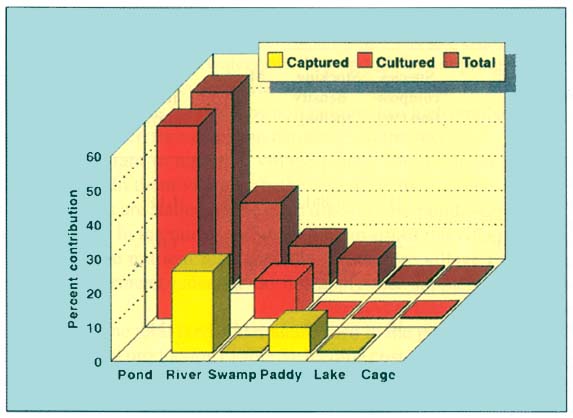
Figure 1. Fish production in Nepal in 1991/92 (total production 16,516 t)
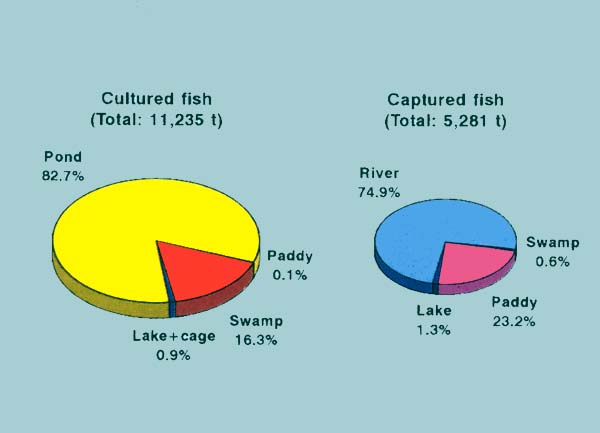
Figure 2. Cultured and captured fish production in Nepal in 1991/92
| Fish species | Species composition (%) * | Stocking density (pc/ha) | Mortality (%) ** | Harvested no. (pc/ha) | Average weight (kg/pc) *** | Production (t/ha) |
|---|---|---|---|---|---|---|
| Cyprinus | ||||||
| carpio (Cc) | 21 | 1,861 | 40 | 1,117 | 0.304 | 0.339 |
| Hypophthalmichthys | ||||||
| molitrix (Sc) | 20 | 1,770 | 42 | 1,027 | 0.466 | 0.479 |
| Aristichthys | ||||||
| nobilis (Bhc) | 6 | 531 | 42 | 308 | 0.679 | 0.309 |
| Ctenopharyngodon | ||||||
| idella (Gc) | 10 | 885 | 38 | 549 | 0.563 | 0.309 |
| Labeo | ||||||
| rohita (R) | 16 | 1,417 | 51 | 694 | 0.308 | 0.214 |
| Cirrhinus | ||||||
| mrigala (M) | 16 | 1,417 | 45 | 779 | 0.298 | 0.232 |
| Catla | ||||||
| catla (K) | 11 | 974 | 48 | 506 | 0.413 | 0.209 |
| Total (average) | 100 | 8, 855 | (44) | 4,980 | (0.400) | 1, 991 |
* species composition differs from government recommendations, which favour a higherratio of Chinese carps to Indian major
carps
** fish seed is stocked at 1-2" size, causing high
mortality
*** culture period is 8 months long
From the data given in the Tables 6 and 8, which are based on a field survey of private fish farmers conducted by the Department of Food and Agricultural Marketing Service in 1991, it is obvious that the farmers are stocking common carp at 21%, Chinese carps at 36% and Indian major carps at 43%, while the government recommendation is 25% common carp, 55% Chinese carps and 20% Indian major carps. This is mainly because the farmers get higher market prices and better keeping quality during marketing for Indian major carps than for Chinese carps. Two groups of carps are cultivated, which have different feeding habits, namely:
species that thrive best on mixed diets composed of artificial and natural feed (common carp, grass carp, catla, rohu and mrigal); and
those that feed mostly on the natural food present in the pond (silver carp and bighead carp).
Even before 1980, fish farming was considered to be a profession only for the fishermen caste or for farmers of low status. The government has given first priority to exploiting the waters of village ponds by adopting low cost fish culture technologies. Fish culture practices started first with the monoculture of common carp, which was followed by polyculture, in which emphasis was given to those species which thrive best on natural plankton food.
It is important to note that village ponds were built for religious and social purposes. In them villagers bathe and wash their clothes and utensils, while their animals are stalled on the pond dikes. These ponds were constructed in low lying areas. In the rainy season all the run-off of the villages drains into them, renewing the nutrient load annually. Therefore village ponds are very fertile and fish farmers generally do not apply any supplementary feeds or manure.
Based on the total feed and manure used in the private sector (Tables 9 and 10) and the total production (Table 5), feeding costs are only US$ 65/t of fish produced. This is mainly due to the fact that a large proportion of the fish production comes from village ponds. Most of the feeding and manuring is done by farmers who constructed their ponds after 1980. Therefore the national average cost of feeding and manuring is low, compared to that in other countries. In the government sector the feed and manuring cost of fingerling production is US$ 1.42/1,000 fingerlings (US$ 1.27 for feed and US$ 0.15 for fertilizers). In the case of market-sized fish production under the outreach programme, the cost of feed and manuring is US$ 242/t (US$ 180 for feed and US$62 for fertilizers). Since the average farm-gate value of fish in Nepal is US$ 0.825/kg, the value of the national farmed production is nearly US$ 7.7 million. National feed and manure costs are less than 10% of this figure.
| Ingredients | Quantity (t) | Price* (US$/t | Total cost (1,000 US$) |
|---|---|---|---|
| Rice bran | 2,546 | 113.4 | 288.7 |
| Wheat bran | 511 | 103.1 | 52.7 |
| Maize | 301 | 134.0 | 40.3 |
| Mustard oil cake | 520 | 82.5 | 42.9 |
| Total | 3,878 | 424.6 |
* US$ 1.00 = NRp 48.50Sources : MSD (1992); FDD Technical Report (unpublished)
| Types | Quantity (t) | Price* (US$/t) | Total cost (1,000 US$) |
|---|---|---|---|
| Cow dung | 1,200 | 5.2 | 6.2 |
| Duck manure | 100 | 20.6 | 2.1 |
| Chicken manure | 100 | 25.8 | 2.6 |
| Fertilizer | 2, 245 | 84.1 | 188.8 |
| Total | 3, 645 | 199.7 |
* US$ 1.00 = NRp 48.50Sources: MSD (1992), FDD Technical Report (unpublished)
In Nepal only 18% of the agricultural land is under irrigation; thus most of the consumable food is produced on rain-fed agricultural land. The Terai, with land suitable for crop production, receives 2,250-2,500 mm rainfall annually; rainfall is much higher than in the hilly (average 1,500 mm) or the mountainous areas (about 300 mm) (CBS 1991). The Terai produces more than 95% of pond cultured fish and about 65% of the capture fisheries from natural water bodies (FDD 1991).
The fish farmers of the Terai have more experience in fish culture and most of the hatchery and nursery operators provide feed, especially to brood fish, fry and fingerlings. Only about 30% of the fish farmers feed grow-out fish.
AVAILABILITY OF FEED INGREDIENTS
Out of many available feed ingredients, including agricultural by-products, about ten are used for feeding fish. The most commonly used are rice bran, wheat flour/bran, maize and oil cakes. The estimated total quantity of these feed ingredients is about 280,000 t (Table 11) and only about 1.4% is used for fish. Other feed ingredients, which are used in smaller quantities (about 125 t in total) are soybean cake, fish meal, meat meal, bone meal, and sesame oil cake. About 50 t of broken rice is also used for fish feed. The proximate analysis of these feed ingredients is given in Table 12.
| Feed ingredients | Available (t) | Used for fish feed | |
|---|---|---|---|
| (t) | (%) | ||
| Major ingredients | |||
| rice bran | 20,200 | 2,546 | 12.6 |
| wheat flour/bran | 28,302 | 511 | 1.8 |
| corn | 180,504 | 301 | 0.2 |
| mustard oil cake | 48,230 | 520 | 1.1 |
| Sub-total | 277,236 | 3,878 | 1.4 |
| Minor ingredients | |||
| soybean cake | 25 | ||
| fish meal | 30 | ||
| meat meal | 10 | ||
| bone meal | 25 | ||
| sesame oil cake | 10 | ||
| broken rice | 50 | ||
| Sub-total | 150 | ||
| Total | 4,028 | ||
| Feed Ingredients | Crude protein (%) | Ether extract (%) | Crude fibre (%) | Ash (%) | Ca (%) | P (%) |
|---|---|---|---|---|---|---|
| Broken rice | 7.5 | 0.5 | 0.2 | 0.5 | 0.1 | 1.0 |
| Rice bran | 13.7 | 17.9 | 6.8 | 12.0 | 0.1 | 1.4 |
| Wheat flour | 11.6 | 2.0 | 1.2 | 1.0 | 0.03 | 0.2 |
| Wheat bran | 13.5 | 4.5 | 13.0 | 6.0 | 0.1 | 1.3 |
| Corn | 10.2 | 4.5 | 2.4 | 1.4 | 0.03 | 0.3 |
| Mustard oil cake | 25.0 | 2.1 | 7.0 | 15.0 | n.a. | n.a. |
| Sesame oil cake | 44.0 | 7.9 | 5.7 | 11.2 | 2.0 | 1.4 |
| Soybean cake | 29.0 | 19.0 | 4.8 | 5.0 | 0.3 | 0.6 |
| Fish meal | 35.0 | 3.5 | 1.5 | 21.0 | 2.1 | 4.5 |
| Meat meal | 54.0 | 8.2 | 2.4 | 25.0 | 7.9 | 3.9 |
| Bone meal | 11.0 | 9.2 | 1.6 | 80.2 | 31.0 | 12.9 |
AQUAFEED MANUFACTURING INDUSTRY
Although there are more than 30 feed mills in Nepal, with production capacities of 1-10 t/day, all except one produce only animal and poultry feeds. The Animal Feed Production and Development Committee (AFPDC), Hetauda, is operated by the public sector and is responsible for producing fish feeds, as well as cattle and popultry feeds. The total amount of fish feed No.1 (22% protein) and No.3 (16% protein) supplied to government fish farms in 1991/92 was 14 t and 95 t, respectively (Table 13). The AFPDC imported 931 t of nine types of feed ingredients and feed additives in 1991/92 from India (Table 14), out of which only some ingredients were used for the manufacturing of fish feeds.
| Feed Ingredients | Fish Feed No.1(%) | Fish Feed No.3 (%) |
|---|---|---|
| Maize | 20.0 | 20.0 |
| Wheat | 30.0 | 30.0 |
| Broken rice | 5.0 | - |
| Defatted oil cake | - | 25.0 |
| Soybean cake | 15.5 | 10.0 |
| soybean, roasted | 15.0 | - |
| Fish meal | 10.0 | 5.0 |
| Bone meal | 2.0 | 2.0 |
| Mustard oil cake | - | 6.0 |
| Poultry meal | 2.0 | 2.0 |
| Salt | 0.5 | - |
| Rovimix A-D-3 (g/t) | (100) | (100) |
| Ruby-B (g/t) | (200) | (200) |
| Total | 100.0 | 100.0 |
| Protein(%) | 22 | 16 |
| Energy level (kcal/kg) | 3,000 | 3,000 |
| Total quantity (t) | 14 | 95 |
| Price (US$/t) | 227 | 170 |
| Total cost (US$) | 3,155 | 16,144 |
| Feed ingredients | Quantity (t) | Price (US$/t) | Protein (%) |
|---|---|---|---|
| Soybean cake, extracted | 120 | 247 | 42.0 |
| Fish meal | 100 | 247 | 28.0 |
| Groundnut cake | 140 | 184 | 42.0 |
| Sesame oil cake | 186 | 142 | 30.0 |
| Sunflower cake | 90 | 433 | 30.0 |
| Mustard cake, extracted | 239 | 67 | 28.0 |
| Salt | 32 | 98 | - |
| Mineral mix (cattle) | 11 | 435 | - |
| Mineral mix (poultry) | 13 | 289 | - |
| Total | 931 |
* a proportion only was used for fish feeds
Although this is the only feed-mill manufacturing fish feed (about 109 t) about 4,000 t of farm-made feeds are made from locally available feed ingredients. As mentioned earlier, considering the technical and economic capabilities of Nepalese fish farmers, fish farming started mostly with plankton feeders, mainly in polyculture. Therefore little emphasis was given to the use of fish feeds, except for the provision of good quality or complete feeds in the early nursery phase, up to 25-30 days. Supplementary feeding is now recommended for the grow-out phase.
For the past two years, the Fisheries Research Centres have been producing pellets for experimental purposes. Almost all feeds are prepared in a dry mash form. Before use the feed is soaked in water and feed balls formed. These are either thrown to fixed feeding places or placed in bamboo baskets, which are dipped into the pond. In the case of cage culture, common carp and grass carp breeders are fed with pelleted diets. Fish fry/fingerlings are fed with crumbled feeds. Pelleted feeds are also given to coldwater riverine species.
Most existing feed mills are established in the Kathmandu Valley. The feed demand of the Terai is met by feed dealers operating in most of the towns. As fish feed demand increases, there should be few problems in producing and supplying fish feed to the fish farmers of the Terai. Unlike ingredients, compounded feeds are not imported from neighbouring countries.
ON-FARM FEED FORMULATION AND MANUFACTURING
Feed formulae used by fish farmers
Farmers use various mixtures of feed ingredients in feed formulations, examples of which are given in Table 15. Feed type #1 is used mainly by hatchery/nursery operators. Feed types #2 and #3 are used for rearing fry to advanced size fingerlings and broodfish, while feed types #4 and #5 are mostly used for grow-out. Fish farmers are only providing supplementary feed; therefore most are not interested in high quality feeds. However, it is increasingly recognized by hatchery/nursery operators, and the most advanced fish farmers, that good quality feeds would increase their fish production.
| Feed ingredient | #1 | #2 | #3 | #4 | #5 | Remark |
|---|---|---|---|---|---|---|
| Rice bran | - | 35 | 50 | 80 | 60 | Land grasses |
| Wheat flour | 50 | 25 | 20 | - | 10 | are fed to |
| Maize | - | 10 | 10 | - | 5 | grass carp |
| Mustard oil cake | - | 10 | 20 | 20 | 25 | |
| Soybean meal | 50 | 15 | - | - | - | |
| Fish meal | - | 5 | - | - | - | |
| Total | 100 | 100 | 100 | 100 | 100 |
*
#1 for hatcheries and nurseries;
#2 and #3 for rearing fry to advanced sized fingerlings
andbroodfish;
#4 and #5 for grow-out
Feed formulation for high density verification trials
The characteristics of low density polyculture are shown in Table 16, while a low-cost feed for herbivorous fish species, feeding at low levels of the food chain, is shown in Table 17. Fingerling size is 10-25g. The stocking pattern and management of high density carp polyculture verification trials is shown in Table 18. The fingerlings size is 20-25 g. About 50% of the production from this system is produced by feeding.
| Fish species | Stocking rate(%) | Stocking Density (pc/ha) | Remark |
|---|---|---|---|
| Common earp | 25 | 2,000 | Feeding for 50% of total stock; 750 kg/ha of fish is produced from feed |
| Silver carp | 35 | 2,800 | |
| Bighead carp | 15 | 1,200 | |
| Grass carp | 2 | 160 | |
| Rohu | 15 | 1,200 | |
| Mrigal | 8 | 640 | |
| Total | 100 | 8,000 |
| Feed ingredients | (%) | Cost (US$/t) | FCR | Yield (t/ha) |
|---|---|---|---|---|
| Rice bran | 80 | |||
| Mustard oil cake | 20 | |||
| Total | 100 | 103 | 3:1 | 1.5 |
| Fish species | Stocking rate (%) | Stocking density (pc/ha) | Remarks |
|---|---|---|---|
| Common carp | 20 | 2,000 | Commercial feed (17% protein) calculated for common carp and mrigal only; 250-day growing season; FCR 1.7:1; US$ 169/t feed cost; and about 3 t/ha yield |
| Silver carp | 35 | 3,500 | |
| Bighead carp | 15 | 1,500 | |
| Grass carp | 10 | 1,000 | |
| Rohu | 10 | 1,000 | |
| Mrigal | 10 | 1,000 | |
| Total | 100 | 10,000 |
Source: FDD (1991)
Three indigenous (asla, Tor spp. and Acrossocheilus hexagonalepis) and one exotic coldwater fish species are also important for commercial purposes and for stocking natural waters in Nepal. The latter is rainbow trout (Oncorhynchus mykiss), which is under experimental culture in the Fisheries Research Centre at Trisuli. This centre, which has facilities for pellet feed production and a laboratory for feed analysis, uses high protein diets, the composition of which are given in Table 19.
Fish farmers do not use machinery for fish feed preparation. They purchase various raw materials or use their own by-products, e.g. rice bran, oil cake or roasted soybean meal, which are mixed manually. Generally farmers prepare sufficient feed for 15-30 days at a time.
| Ingredients | Diet A* | Diet B* | Diet C* |
|---|---|---|---|
| Soybean, whole | 35.00 | 35.00 | - |
| Fish meal | 37.00 | 20.00 | 13.60 |
| Wheat | 6.75 | 12.00 | 13.60 |
| Maize | 6.75 | 12.00 | 24.30 |
| Mustard oil cake | 6.75 | 10.00 | 24.30 |
| Rice polishings | 6.75 | 11.00 | 24.20 |
| Vitamins & minerals | 1.00 | - | - |
| Total | 100.00 | 100.00 | 100.00 |
| Crude protein (%) | 45 | 30 | 20 |
| Price (US$/t)** | 814 | 589 | 298 |
* Diet A: For asla (Schizothorax spp.) fry and
broodstock
Diet B: For Tor spp., Acrossocheilus and rainbow trout
Diet C: For common carp broodstock and grow-out
** feed prices are high, mainly because whole dried fish is used in the formulae
Source: Fisheries Research Centre, Trisuli
ON-FARM FEEDING STRATEGIES
Hatchlings and early fry are fed with high quality diets ad libitum. After the second week the fry are fed 2 to 3 times per day. Advanced size fingerlings, grow-out fish and broodfish are fed at 3.5% of their body weight, twice daily. Feed quantity is adjusted after biomass assessment at monthly intervals. The stocking rates of different age groups of fish are given in Table 20.
| Age group | Size | Stocking rate |
|---|---|---|
| Brood fish (kg) | 2-3 | 1,000-1,100 kg/ha |
| Hatchlings (cm) | 0.7-1.5 | 2 million/ha |
| Fry (cm) | 2.5-3.5 | 0.5 million/ha |
| Fingerlings (g) | <10 g | 0.25 million/ha |
| Advanced fingerlings (g) | >10 g | 8-10 thousand/ha |
Source: FDD (1991)
Organic manure (1% N, 0.7% P2O5) is applied to broodstock ponds at 2,000 t/ha as a basal dose during pond preparation. Inorganic fertilizers are used at a 1:2 N:P ratio, i.e., 917 kg of urea and about 1,900 kg of TSP. One-sixth of this is applied as a basal dose and the remainder is split into 23 doses at 15-day intervals.
For nursery ponds, organic manure is applied in the form of decomposed cow dung, poultry, duck, and pig manure or bio-gas effluent at the rate of 100 kg/week. Urea and TSP are applied at the rate of 2 kg/week and 4 kg/week, respectively, for 4 weeks.
In low density polyculture grow-out ponds, stocked with fish which feed at the lowest level of the food chain, organic manure is applied as a basal dose at the rate of 2,500 kg/ha. Inorganic fertilization, in the form of urea and TSP at rates of 467 and 963 kg/ha, respectively, is split into 20 doses; the first (basal) dose is 1/6 of the total and the remainder is split into 19 doses applied every fifteen days.
In high density carp polyculture verification trials organic manure is applied at the rate of 3 t/ha as a basal dose. Successive doses are applied at the rate of 2.5 t/ha/month for 7 months. Inorganic fertilizers are applied at the rate of 50 kg/ha/month for 8 months, with a total of 400 kg/ha N and 800 kg/ha P, i.e., 870 kg/ha urea and 1,740 kg/ha TSP.
Traditional village ponds are the main water bodies for aquaculture in the country. More than 75% are rain-fed. Since these ponds are deep, fish culture is practiced without water exchange, except that the water level is maintained during the summer months when suitable water supplies are available. Since Nepalese extensive fish culture systems practice low levels of manuring and feeding, regular water exchange is not necessary. However, those adopting semi-intensive fish culture systems occasionally practice water exchange (one to two times a year). The cost of water management for 1 m deep water under the Terai climate is about US$ 52-103/yr, depending on soil structure; more water is needed for ponds constructed on light soils.
MAJOR INSTITUTIONS INVOLVED IN AQUAFEED RESEARCH AND DEVELOPMENT
For the last two years the Fisheries Research Centres (FRC's) at Janakpur and Trisuli have been conducting applied research on fish nutrition. After positive results are obtained, the feeding techniques are verified in other Fisheries Development Centres (FDC's) and one or two experiments are also conducted in farmers' ponds in all of the 20 districts of the Terai, under an outreach verification programme, before being recommended as a technological package to fish farmers nationwide.
Nutritional research and fish feed development in Nepal is of recent origin and there are only a few qualified technical personnel. Research facilities are not adequately developed but are planned under the Natural Water Fishery Development Project, Pokhara/Trisuli. At the moment the author of this paper, Mr. M.B. Pantha, Chief, FDD, also being a nutritionist, is helping to conduct nutritional research and fish feed formulation in the Fisheries Research Centres in Janakpur, Trisuli and Pokhara.
Nutritional research is also implemented in the field by other Fisheries Development Officers, namely Mr. R.R. Dhital, Mr. J.D. Bista and Mr. S.K. Wagle. Aquafeed research and development for cultured carp species is being conducted by the National Aquaculture Research Centre, Janakpur, and the Fisheries Research Centre, Pokhara, while the Fisheries Research Centre in Trisuli is involved in feed development for indigenous and exotic coldwater fish species.
CURRENT NATIONAL REGULATIONS
There is no specific regulation for aquafeed manufacturing but there is a feedstuff law enacted in 1976, and feedstuff by-laws of 1984, which give detailed rules and regulations regarding the procurement, storage, marketing and quality control of animal feeds generally. These are only available in the Nepali language.
CURRENT PROBLEMS AND CONSTRAINTS
The current problems and constraints in the manufacturing and use of aquafeeds include a lack of basic facilities and adequately trained manpower for nutritional research and feed development programmes. In addition, the majority of fish ponds are operated by poor small-scale farmers, who may not be able to afford to purchase expensive feeds or to apply the recommended amounts. As a result of the training provided to fish farmers, the high price of fish, and the fact that fish culture is less labour intensive than other agricultural enterprises, aquaculture is getting popular. To increase fish production, farmers are in favour of using locally available feed ingredients or agricultural by-products for fish feeds. Another problem is the lack of adequate infrastructure for fish feed distribution in the main fish production region.
TRENDS IN AQUAFEED MANUFACTURING AND USE
In the near future about 78,000 ha of new reservoirs are expected to be constructed for hydro-power generation. Pond area is expected to expand in the low-lying parts of the paddy field area. Similarly, the area of irrigated rice is expected to increase by 700,000 ha by the end of the 10th Five Year Plan period, e.g. by 2005. Visualizing the country's existing water resources and its future potential, there is great scope for expansion, in terms of area and intensification, of fish production in Nepal.
A decade ago, farmers in Nepal believed that it was a waste of money to provide feed and fertilizers in ponds, because they were unable to see the fish feeding on them. Now concepts are changing and almost all the hatchery or nursery operators are feeding their broodfish and fish fry. Owners of new fish ponds also feed and fertilize their ponds regularly to achieve higher fish production. Fishery Research Centres are now giving priority to nutritional research and the development of economic aquafeeds.
Experiments with various aquafeeds in the Fisheries Research Centres, and their outreach verification trials in other FDC's and fish ponds of the private sector, will help to develop improved technological packages for fish farmers. This will create an increasing fish feed demand of at least 10% per year, which can easily be met by established feed mills. Establishing feed mills specifically for aquafeeds would not be viable.
Numerous agricultural by-products have still not been tested for their suitability in fish feed preparation. Nutritional research is necessary to develop economical aquafeeds utilizing these locally available ingredients. The price of inorganic fertilizers has quadrupled recently. Therefore, there is good scope for aquafeeds to increase fish production through semi-intensive methods. By stocking advanced fingerlings (>10 g) and the provision of good quality supplementary feeds in the grow-out ponds the present mortality levels of 35- 45% can easily be reduced to less than 20%.
LIST OF REFERENCES
ADB. 1991. Agricultural Research Study. Fisheries and Agricultural Research in Nepal: 1975- 2005. A study team report prepared for the National Agricultural Research Centres and ADB (Ts. No. 1182, NEP). 90 p.
APROSC. 1989. ADB Evaluation Division - Impact study of agriculture financing in Nepal. APROSC Agricultural sector strategy of the Eighth Plan (1990-95). 55 p.
CBS. 1991. Statistical Year Book of Nepal. Central Bureau of Statistics, Kathmandu, Nepal. 15 p.
CBS. 1992. Statistical Pocket Book, Nepal. Central Bureau of Statistics, Kathmandu, Nepal. 12 p.
FDD. 1991. Fisheries Development Division Budgeting Norms for 1991/92. 25 p.
MSD. 1992. Food Balance Sheet of Nepal, 1990/91. Marketing Service Division. 29 p.
Pantha, M.B. 1979. Induced spawning of Catla catla, 12 p. In Proceedings of the Fourth National Fisheries Seminar, 22-29 November 1979, FDC, Harihar Bhawan, Kathmandu, Nepal.
Pantha, M.B. 1991. History of fish culture in Nepal: past, present situation and future strategies (unpublished). 16 p.
Pradhan, B. 1987. Potential of reservoir fishery development in Asia, 12 p. In Proceedings of a Workshop, Kathmandu. IDRC.
Rajbanshi, K.G. 1982. A general bibliography on fish and fisheries of Nepal. Royal Nepal Academy, Kathmandu. 96 p.
Sharma, B.P. 1989. Status of Aquaculture Development in Nepal. 10p. In Aquaculture in Asia. Asian Fisheries Society, Indian Branch, Bombay, India.
Sharma, K.R. 1992. Some thoughts on irrigation sector. Gorkhapatra, 21 September 1992.
Terashima, A. 1984. Three new species of the Cyprinid genus Schizothorax from Lake Rara, North Western Nepal. Japanese Journal of Ichthyology 31 (2):122-135.
![]()
![]()
![]()