| Total Production Volume and Composition by Main Species Groups | 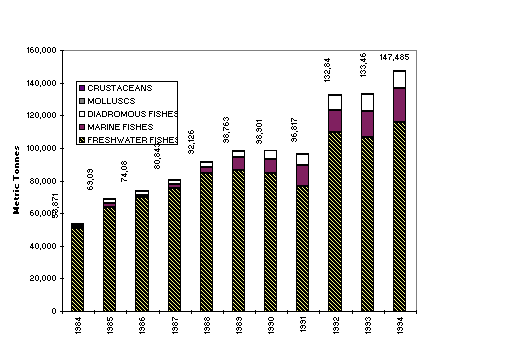
|
| Total Production Value and Composition by Main Species Groups | 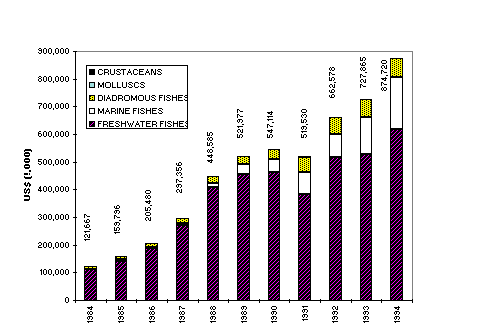
|
| Main Producers (Metric Tonnes) in 1994; (paranthesise=% total production) | 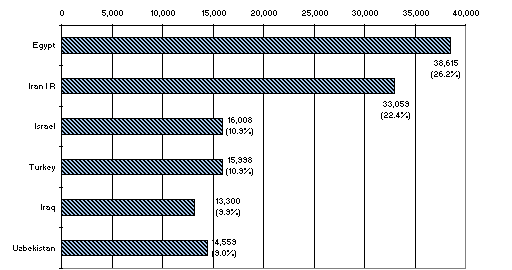
|
| Main Producers (US$) in 1994; (paranthesise=% total production value) | 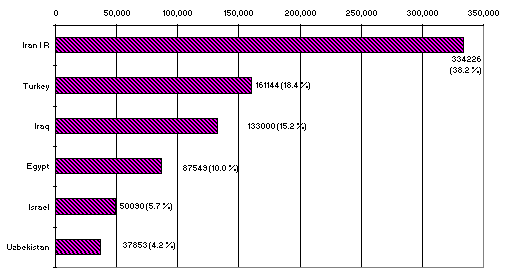
|
| Production Volume (metric tonnes and %) by Main Species Groups | 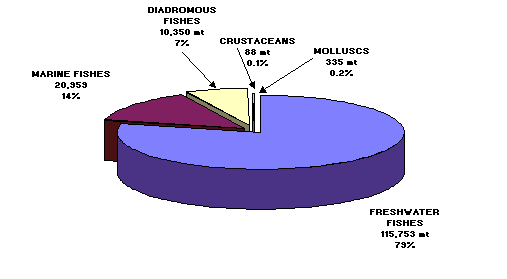
|
| Main Species by Production Volume (mt & % total production value), 1994 | 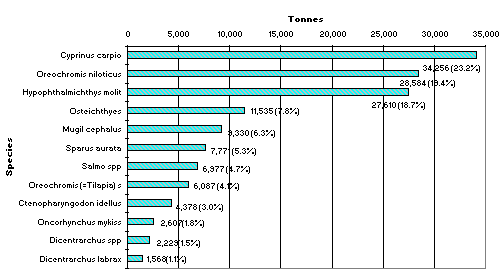
|
| Main Species by production value & % total production value, 1994 | 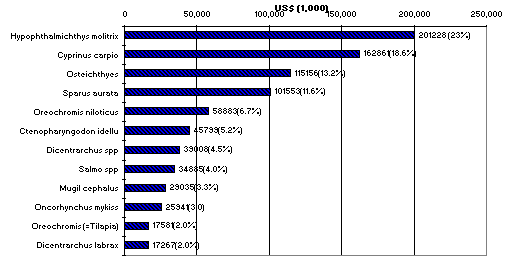
|