![]()
![]()
![]()
|
F. Plauborg, Department of Land Use, M.N. Andersen, Department of Soil Science, T. Heidmann, Department of Land Use, and J.E. Oleson, Department of Soil Science, Danish Institute of Plant and Soil Sciences, Tjele, Denmark |
SUMMARY
MARKVAND is a PC-based decision support system which gives daily information on the timing, the amount and the economic net return of irrigation for a large group of agricultural crops in Denmark. In general, tests have shown a good performance of the MARKVAND system and to date 100 copies of the software have been sold and it is used by at least 200 farmers in Denmark.
The MARKVAND system includes conceptual and empirical sub models for crop development, water balance and crop yield. The model for crop development is calculated from temperature sums; the water balance model is based on the field and wilting capacity concepts and empirical models, using the stress-day concept, are included for the calculation of crop yield. A priority module ranks the crops with respect to economic net return of irrigation and thus recommends in which order the crops should be irrigated. Calculations in the priority module are based on model-calculated yield increases from irrigation, cost of irrigation and crop prices. The irrigation demand is calculated for a five-day forecast period to help farmers in planning their activities.
Daily climate input to the MARKVAND system is reference evapotranspiration and air temperature calculated in a national (40 by 40 km) climate grid and precipitation measured at farm level. A seven-day forecast for precipitation can be given as optional input, which is a valuable option enabling better planning of irrigation and the possibility of saving water.
In Denmark, the timing and need for irrigation has previously been based on local experience, simple rules and calculated figures for precipitation deficit (reference evapotranspiration minus precipitation). Supplemental irrigation is needed nearly every year on sandy soils to maintain a stable production and, at present, about 15 000 irrigation systems are used to irrigate 420 000 ha or 15% of the agricultural land. Along with the increased demand for water in different sectors of the society and because of the need to balance the cost and income in agricultural production, it was found necessary to focus on more efficient methods of irrigation management.
Irrigation is mostly carried out using moving rain-guns and the water is supplied from pumped groundwater sources. At present, constraints on an adequate supply of irrigation water are mostly caused by a limited irrigation capacity. However, restrictions on me use of groundwater are becoming increasingly important.
During the period 1988-1994 joint efforts by the Danish Institute of Plant and Soil Science and the Danish Agricultural Advisory Centre resulted in the development of the MARKVAND system, a PC-based software to support decisions on irrigation management (Plauborg and Olesen, 1991; Plauborg et al., 1994). The present paper describes the MARKVAND system and verifications of the system using measurements from several irrigation experiments.
FIGURE 1 - Model-calculated leaf area index, growth stages and effective root depth for peas on a loamy sandy soil in a normal year. (-): Total leaf area index L. (- -): Green leaf area index. F1, F2, ... F5 correspond to the growth stages: vegetative 1 and 2, flowering, pod filling and ripening, respectively.
FIGURE 2 - Reservoirs and processes in the water balance model of MARKVAND. Precipitation, P; irrigation. I; transpiration, EaT; evaporation of intercepted water, Eal; evaporation from soil, EaS; and drainage, D.

MATERIALS AND METHODS
Description of the MARKVAND system
Climate input to the MARKVAND system is daily grass reference evapotranspiration (Allen et al., 1989) and temperature calculated in a 40 by 40 km climate grid covering Denmark. Reference evapotranspiration in the grid is calculated from a modification of the Penman formula (Penman, 1956) developed by Mikkelsen and Olesen (1991). Additional daily information on farm measurements of precipitation and irrigation, as well as a seven-day forecast of precipitation, are used. Initially, a database describing soils and crops was created.
The model calculates daily values of the total leaf area index (green and yellow leaf area indices), effective root depth and growth stages using functions of temperature summations. Temperature sums (with base 0°C) are calculated from the starting day of growth for winter crops and the day of emergence for spring crops. Effective root depth is defined as the soil depth down to which the capacity for plant available water equals the amount of soil water which potentially may be extracted by the total crop root system in a drying period before wilting of the crop. The capacity for plant available water is defined as the water content at field capacity (pF 2.0) minus water content at wilting point (pF 4.2). Root growth rate is 1.2 mm day-1 for grass and 1.5 nun day-1 for other crops until maximum effective root depth has been reached (Aslyng and Hansen, 1982). Maximum effective root depth is determined by both crop and soil type. An example for peas in a normal year on a loamy sandy soil is given in Figure 1.
The water balance model in MARKVAND runs on a daily basis and is developed from previously used conceptual models, cf. Kristensen and Jensen (1975) and Aslyng and Hansen (1982). The reservoirs and processes included in the model are pictured in Figure 2. The main equations are described below.
Potential evapotranspiration is divided into potential evaporation from the soil, EpS (mm day-1), and crop, EpC (mm day-1), using an extinction coefficient k = 0.6, and reference evapotranspiration, EpR (mm day-1).
E
pS = EpRexp(-kL), (1)
where L is the total (green and yellow) leaf area index.
E
pC = EpR - EpS, (2)
Actual evaporation from soil, EaS is calculated from:
, (3)
where D t is time step (day). Ve is the actual soil water content in the evaporation reservoir (mm). Vr and Vb, both in nun are the actual plant available soil water content in the root zone reservoir and sub zone reservoir, respectively. Cr and Cb are the capacities for plant available soil water in these soil reservoirs (mm). For bare soil, Vr and Cr are nil, and Vb and Cb enclose the whole soil profile. ce is an empirical soil dependent evaporation factor with values of 0.08 to 0.15 (dimensionless). The evaporation from soil is then described in two stages (Eq. 3): stage 1, equal to the potential evaporation level, EpS (or EpR for bare soil); and stage 2, markedly reduced and dependent on the potential evaporation level and the ratio: actual to maximum storage of plant available water in the soil.
Infiltration is handled in a temporary soil water reservoir included in Cr, which in the event of precipitation or irrigation fills up. Furthermore, the evaporation reservoir fills up enabling the model to switch between stage 1 and stage 2 evaporation even if the total soil profile is rather dry. Excess water above field capacity in both the root zone and subzone reservoirs drains at a rate decreasing exponentially with time. The initial rate and decay constant depend on the amount of excess water, soil type and depth of the reservoirs. Surface runoff and capillary rise of soil water are not included in the model.
Potential transpiration, EpT (mm day-1), is calculated from:
E
pT = EpR [1 - exp(-kLg)], (4)
where Lg is green leaf area index.
Actual transpiration, EaT (mm day-1) is calculated from:
, (5)
where cT is an empirical soil dependent constant varying from 10 to 12 mm day-1 and Vr/Cr is relative plant available soil water content.
FIGURE 3 - Relative transpiration as a function of relative available soil water content for different levels of potential transpiration, 1, 3, 5 mm/day, respectively
Figure 3 shows the relative transpiration (or crop transpiration coefficient), EaT/EpT, as a function of relative plant available water content in soil for three different levels of potential transpiration. As infiltration is accounted for in a temporary soil water reservoir, crop transpiration may temporarily increase after precipitation even if the relative available water content in the root zone is low.
Evaporation from intercepted water on leaves, EaI (mm day-1) is accounted for by assuming a storage capacity of 0.5L (mm). Actual evapotranspiration, Ea, is then calculated as the sum of EaS, EaT, and EaI.
From the above description of crop development and water balance, it may be realized that the calculation of evapotranspiration from a crop in the MARKVAND system is consistent with the generally recognized crop coefficient, kc-concept, which relates reference evapotranspiration to maximum evapotranspiration from a specific surface cover, e.g., Doorenbos and Kassam (1979). In the MARKVAND system, this crop coefficient is given implicitly in the above equations, being a function of the total leaf area index, the amount of intercepted water on crop leaves and the actual water content in the soil evaporation reservoir. However, in the MARKVAND system the crop coefficient cannot exceed one.
Yield response to irrigation is calculated based on a modification of the stress-day model (Hiler and Clark, 1971; Mogensen, 1980):
, (6)
where Ya, EaT and EaIg are the final yield, the daily transpiration and evaporation of intercepted water from green leaves, respectively, of a drought stressed crop, while Ym and EpT are the corresponding variables for a fully irrigated crop ky is a drought sensitivity parameter which varies with crop species and developmental stage.
ky was estimated from Danish irrigation experiments on agricultural crops where stress days (Sd = (1 - (EaT + EaIg/EpT)) were calculated on a daily basis from the water balance model. For different water stress treatments which included only a single day of stress, the drought sensitivity was calculated from:
k
y = (1 - Ya/Ym)/Sd, (7)
To express ky as a continuous function, the found ky-values were fitted to a polynomial function of a temperature summation, ts, which was initiated at emergence of spring crops, or at onset of growth for winter crops:
ky = a + a1ts + a2ts2 + a3ts3, (8)
Since most treatments in the applied irrigation experiments contained more than one day of stress, Eq. 7 was extended (Eq. 9) to account for multiple days of stress.
, (9)
where i is day-number between emergence and harvest. A similar multiplicative model reads:
, (10)
These statistical models (Eqs. 9 and 10) were fitted to the experimental data with the parameters in Eq. 9 estimated by the linear least-squares procedure REG of SAS (SAS Institute, 1988) and the parameters in Eq. 10 by the non-linear procedure NLIN.
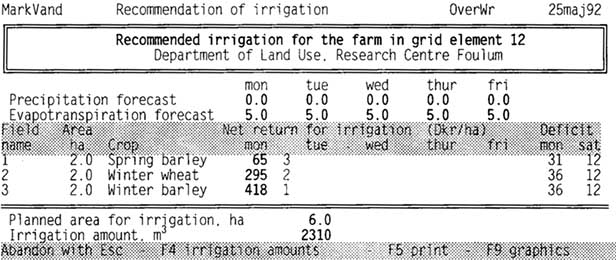
For each crop the priority module calculates the need for irrigation based on information on calculated stress days, allowable soil water deficit and drought sensitivity of the crop. The last two mentioned vary with crop development. Furthermore, it takes into account the cost of irrigation and the actual prices of crops, and produces an irrigation strategy for a five-day forecast period. Within the latter period the crops are ranked in order of their economic net return from irrigation (Figure 6). As an example, drought sensitivity functions (Eq. 8) expressed as gross economical yield decrease (Dkr/ha) per stress day for spring crops are presented in Figure 4. From these relationships irrigation in mid-June would be recommended in the order potatoes, peas, spring barley and spring rape if all crops were exposed to the same level of drought.
FIGURE 4 - Drought sensitivity for spring crops expressed as decrease in gross economic yield per stress day as function of time. Functions calculated from 1992 crop prices and temperature sums in 1992 at Jyndevad in south Jutland.
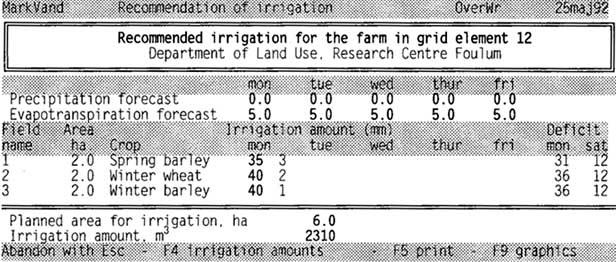
The output provided to the end user is presented in Figures 5 and 6. Figure 5 shows the output screen in MARKVAND with the recommended irrigations ranked from one to three. The economic net return is shown in Figure 6.
The MARKVAND system can be applied from March to November and is adapted to Danish growth conditions for the following crops: peas, potatoes, grass, spring and winter barley, winter wheat, winter rye, beets, spring and winter rape and corn.
Experimental data
A huge number of historical irrigation experiments from different years on a coarse sandy soil at Jyndevad in south Jutland and a loamy sand soil at Foulum in mid Jutland were used to parameterize the models on crop development, water balance and crop yield. However, the majority of these experiments have been planned for other purposes than modelling and were in several cases incomplete. So in addition, several parameter values were extracted from the literature.
FIGURE 5 - Recommended amount and priority of irrigation calculated with MARKVAND
FIGURE 6 - Priority and the economic net return obtained by irrigation calculated with MARKVAND
TABLE 1 - Performance of the MARKVAND water balance on a coarse sandy soil. Mean values of DET are presented where DET is defined as model calculated minus indirectly measured daily evapotranspiration (mm day-1), s is the standard error on the mean (mm day-1), nobs is number of observations. Minimum time difference, pmin, between neutron scatter measurements was 3 days. pmax gives the maximum time difference between neutron scatter measurements, nyears gives the number of different years with experimental data. Levels of significance, *0.05 >P> 0.01, **0.01 >P> 0.001, ***0.001 >P.
|
Crop |
DET |
s |
nobs |
pmax |
nyears |
|
All |
-0.2*** |
0.01 |
7074 |
77 |
15 |
|
Winter wheat |
-0.3*** |
0.03 |
1133 |
28 |
6 |
|
Spring barley |
-0.1*** |
0.02 |
1790 |
31 |
10 |
|
Winter barley |
-0.1* |
0.06 |
340 |
10 |
3 |
|
Peas |
0.3 |
0.1 |
95 |
12 |
2 |
|
Potatoes, m. early |
0.1* |
0.05 |
474 |
17 |
3 |
|
Potatoes, late |
-0.2*** |
0.04 |
471 |
10 |
3 |
|
Beets |
-0.4*** |
0.06 |
609 |
17 |
5 |
|
Rye grass |
-0.3*** |
0.03 |
1161 |
77 |
4 |
|
Corn |
-0.1 |
0.1 |
110 |
25 |
1 |
|
Spring oil seed rape |
-0.1 |
0.07 |
218 |
14 |
3 |
|
Winter oil seed rape |
-0.1** |
0.03 |
673 |
31 |
5 |
TABLE 2 - Estimated parameters a, a1, a2 and a3 in the drought response function ky in MARKVAND. RMSe (root mean square error) is the standard error of regression on 1-Ya/Ym and n is the number of experimental treatments used in the analysis. Validity interval of the functions are from temperature sum ta to tb (°Cd).
|
Crop |
a |
a1 |
a2 |
a3 |
RMSe |
n |
ta |
tb |
|
Winter barley |
-7.77 · 10-02 |
5.32 · 10-04 |
-4.52 · 10-07 |
0.0 |
0.14 |
9 |
171 |
1004 |
|
Spring barley |
-9.27 · 10-02 |
2.83 · 10-04 |
-1.51 · 10-07 |
0.0 |
0.11 |
25 |
424 |
1451 |
|
Winter wheat |
-7.44 · 10-05 |
1.20 · 10-04 |
-7.26 · 10-08 |
0.0 |
0.09 |
43 |
1 |
1656 |
|
Potatoes, m.late |
5.19 · 10-03 |
8.71 · 10-05 |
-6.11 · 10-08 |
0.0 |
0.05 |
26 |
0 |
1482 |
|
Winter rape |
-7.97 · 10-02 |
3.35 · 10-04 |
-2.13 · 10-07 |
0.0 |
0.11 |
26 |
292 |
1281 |
|
Spring rape |
-7.08 · 10-02 |
2.78 · 10-04 |
-1.56 · 10-07 |
0.0 |
0.09 |
37 |
309 |
1472 |
|
Peas |
-1.38 · 10-01 |
8.26 · 10-04 |
-9.82 · 10-07 |
3.26 · 10-10 |
0.07 |
44 |
220 |
1226 |
|
Rye grass |
1.34 · 10-02 |
8.46 · 10-06 |
-7.04 · 10-09 |
0.0 |
0.03 |
14 |
0 |
2106 |
|
Fodder beet |
-5.66 · 10-02 |
6.66 · 10-05 |
-7.74 · 10-09 |
0.0 |
0.06 |
15 |
957 |
2594 |
FIGURE 7 - Calculated relative yield decrease plotted against measured yield for peas. Data from experimental stations Jyndevad () and Borris (D).
RESULTS AND DISCUSSION
A short summary of results on the performance of the water balance model and crop yield model will be presented.
Table 1 shows statistics on the variable DET defined as model calculated minus indirectly measured daily evapotranspiration (mm day-1). DET is presented as a mean value of nobs observations. Observations of DET represent periods of varying length (from pmin = 3 to pmax = 77 days) during several growing seasons (nyears). The indirectly measured evapotranspiration has been calculated, as daily average values, from measurements of water storage with the neutron-scatter method and a simple water balance applied in periods where drainage from the soil profile may be neglected. The different lengths of periods were due to a varying frequency of measurement of soil water storage with the neutron-scatter method. In general, Table 1 shows a good agreement between model-calculated and measured evapotranspiration, although the model slightly, but significantly, underestimated evapotranspiration from most crops.
Using Eqs. 9 and 10 and data from irrigation experiments carried out mainly on a coarse sandy soil it was possible to estimate drought sensitivity parameters for the crops shown in Table 2. For all crops except fodder beets the multiplicative model (Eq. 10) gave the best description of data. Only positive values of ky were accepted which restricted the validity of the yield response to only a part of the growing season defined as the temperature sum intervals listed in the Table 2 which start and end at ta and tb, respectively.
Table 2 shows standard errors of regression varying from 3% for grass to 14% for winter barley. This error can alternatively be described in scatter plots as deviation from the 1:1 line when simulated yield is plotted against measured yield, cf. Figure 7. For several crops, among others corn, late potatoes and winter rye, sufficient experimental data were not available for the development of the parameters. It could be argued that the relative error when using the crop-water production functions for predicting yield is unacceptably high for some crops. However, it was concluded that the developed crop-water production functions shown in Table 2 were of satisfactory accuracy and suitable for implementation in the priority module in MARKVAND.
At present, about 100 units of the software have been sold and it is being used by at least 200 farmers in Denmark.
CONCLUSIONS
MARKVAND has proven to be a useful decision support system for farmers for use in real-time management of irrigation water to agricultural crops. The system, which is based on simple conceptual/empirical models, is robust, simple to run, and needs relative few data inputs. Calculated outputs from the system lack some accuracy, partly as a consequence of the modelling approach applied; however, improvements may be achieved in the prediction of water use and yield from further studies on crop development (leaf area index, and, especially, root depth) and crop coefficients.
REFERENCES
Allen, R.G., Jensen, M.E., Wright, J.L. and Burman, R.D. 1989. Operational estimates of reference evapotranspiration. Agron. J. 81: 650-662.
Aslyng, H.C. and Hansen, S. 1982. Water balance and crop production simulation. Hydrotechnical Laboratory. The Royal Veterinary and Agricultural University. Copenhagen. 200 p.
Doorenbos, J. and Kassam, A.H. 1979. Yield response to water. FAO Irrigation and Drainage Paper 33. Rome. 193 p.
Hiler, E.A. and Clark, R.N. 1971. Stress day index to characterize effects of water stress on crop yields. Trans. ASAE 14: 757-761.
Kristensen, K.J. and Jensen, S.E. 1975. A model for estimating actual evapotranspiration from potential evapotranspiration. Nord. Hydrol. 6: 170-188.
Mikkelsen, H.E. and Olesen, J.E. 1991. Sammenligning af metoder til bestemmelse af potentiel vandfordampning. Tidsskrift for Planteavl. Beretning S2157.
Mogensen, V.O. 1980. Drought sensitivity at various growth stages of barley in relation to relative evapotranspiration and water stress. Agron. J. 72: 1033-1038.
Penman, H.L. 1956. Evaporation: an introductory survey. Neth. J. Agric. Sci. 4: 4-29.
Plauborg, F. and Olesen, J.E. 1991. Development and validation of the model MARKVAND for irrigation scheduling in agriculture. Tidsskrift for Planteavl. Beretning S 2113. Danish Institute of Plant and Soil Science, Copenhagen. 103 pp.
Plauborg, F., Andersen, M.N. and Heidmann, T. 1994. MARKVAND. A PC-Based software to support decisions on irrigation in Denmark. In: Proceedings of 13th international conference. International Soil Tillage Research Organization. Vol. 2. H.E. Jensen, P. Schjønning, S.A. Mikkelsen and K.B. Madsen. (eds.). The Royal Veterinary and Agricultural University, Copenhagen and the Danish Institute of Plant and Soil Science, Copenhagen. pp. 1181-1186.
SAS Institute. 1988. SAS/STAT. Users Guide, Release 6.03 Edition. Cary, NC, pp. 1028.
![]()
![]()
![]()