![]()
![]()
![]()
New Zealand's roundwood removals have increased markedly over the past 45 years, averaging a 4.1 percent increase annually. Total roundwood removals from New Zealand forests for the year ended December 1995 are estimated at 17,085,000 cubic metres. Figure 5 shows the gradual decline in harvesting from the natural forests, to a point where natural forest harvest removals are negligible, and the rapid ascent of the planted forests to being New Zealand's major source of industrial wood. The industrial wood harvest from natural forests in 1995 totalled 114,000 cubic metres.
New Zealand's planted forests are regularly statistically surveyed with the results published in the National Exotic Forest Description. In 1992 a publication modelling wood flows on the basis of this data, the National Exotic Forest Description (NEFD) 1992 National and Regional Wood Supply Forecasts published a range of wood flow scenarios based on planting rates, management regimes and clear fell age scenarios. The results of the Base-cut1 and 50,000 hectares planting2 scenarios are shown in Table 1. More recent New Zealand Ministry of Forestry forecasts based on industrial capacity changes and economic conditions are included in the table to 2000.
Figure 5: New Zealand Annual Roundwood Removals 1951-1996
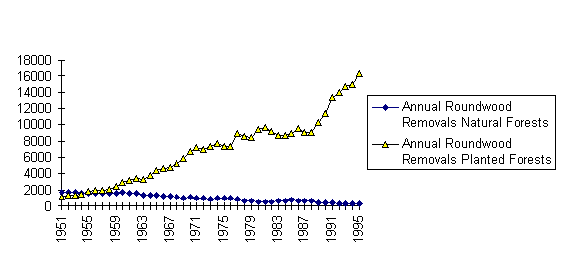
Source: NZMOF
Although not displayed, the actual harvest path to date has remained between the base cut scenario and an early cut scenario with a target clear fell age of 25 years. These two scenarios converge in 2001, as does an extension of the Ministry of Forestry forecast path. Beyond this, the NEFD scenarios outline a sustainable yield potential to 2010. The extent to which this theoretical maximum is reached will be largely dependent on the relative competitiveness of New Zealand's forestry industries.
Logs are New Zealand's largest forest products export, in terms of both value and volume. In 1995 New Zealand's log trade totalled 5.2 million cubic metres, with an f.o.b. value of US$430 million. The export market for New Zealand logs is presently dominated by Japan and Korea. In 1995 these two countries purchased 94 percent of New Zealand export logs.
Table 1: Annual Harvest Predictions (m3)
Year ended |
Ministry of Forestry |
NEFD Base Cut |
NEFD 50,000 ha Replanting |
December 1993 |
15,175,000 |
14,402,000 |
14,507,000 |
December 1994 |
16,195,000 |
14,759,000 |
14,600,000 |
December 1995 |
17,088,000 |
14,858,000 |
14,774,000 |
December 1996 |
17,627,000 |
14,875,000 |
14,792,000 |
December 1997 |
17,859,000 |
14,522,000 |
14,447,000 |
December 1998 |
18,372,000 |
14,558,000 |
14,539,000 |
December 1999 December 2000 December 2001 December 2002 December 2003 December 2004 December 2005 December 2006 December 2007 December 2008 December 2009 December 2010 |
18,752,000 - - - - - - - - - - - - - - - - - - - - - - - - - - - - - - - - - - - - - - - - - - - - - - - - - - - - - - - - - - - - - - - - - - - - - - - - - - - - - - - - - - - - - - - - |
16,836,000 17,738,000 20,647,000 22,099,000 22,063,000 22,731,000 23,062,000 23,048,000 23,125,000 23,216,000 23,391,000 23,699,000 |
17,031,000 18,256,000 22,450,000 23,507,000 23,609,000 24,720,000 25,315,000 25,608,000 25,842,000 26,090,000 27,943,000 28,725,000 |
Source: NZMOF, Turland et al
The development of a substantive New Zealand log trade is a relatively recent event and essentially parallels the increasing New Zealand harvest. As Table 2 shows, the annual New Zealand harvest increased by 6,192,000 cubic metres in the period 1981-1995. During the same period, log exports increased by 4,449,000 cubic metres while additional roundwood processed in New Zealand increased by only 1,733,000 cubic metres.
Table 2: Development of New Zealand Harvest Profile and Log Export Trade (000 m3)
Year |
1981 |
1983 |
1985 |
1987 |
1989 |
1991 |
1993 |
1995 |
Roundwood Harvest |
10,245 |
9,358 |
9,626 |
9,613 |
10,619 |
13,693 |
14,937 |
16,437 |
Log Exports |
803 |
440 |
360 |
426 |
1545 |
3,293 |
4,290 |
5,262 |
Processed (Roundwd Eq.) |
9,442 |
8,918 |
9,266 |
9,187 |
9,074 |
10,400 |
10,647 |
11,175 |
Source: NZMOF, Author
Several points can be inferred from Table 2. Firstly, the rapid increase in log exporting corresponds with the privatization of the forest estate and reflects the private sector realities of obtaining returns on investment and maintaining liquidity. The differing objectives of the private sector and the Forestry Corporation of New Zealand compared with those of the New Zealand Forest Service are clearly apparent in the differing behaviours in terms of log exports in the pre- and post- 1987 periods. Secondly, it is evident that the transition to the higher harvest potential of New Zealand's forests has not been matched by development of processing capacity. It is evident that, at present, New Zealand does not have sufficient effective processing capacity to manufacture its current harvest. Despite the planned installation of considerable capacity during the coming five years, it is apparent that the potential sustainable harvest will continue to outstrip the development of processing facilities throughout this period. Therefore, either log exports will continue to escalate, or a higher level of growing stock will be accumulated. Conventional wisdom in New Zealand, relating to the maximization of internal rates of return, suggests that provided reasonable markets are available then log exports will continue to accelerate.
Table 3 shows a simple scenario for the development of industry within the New Zealand forestry sector. Using the NEFD 50,000 hectares new planting scenario (see Table 1) to determine the potential harvest, and extrapolating the current rate of (announced) new capacity development Table 3 shows the substantial potential for increased log exports. There appears to be sufficient available wood available to increase log exports by more than 7 million cubic metres in the period 1996-2010. However, there are several good reasons to anticipate that New Zealand companies may not log the forest to its full potential thereby restricting log exports.
Table 3: Scenario for Growth in Log Exports and Processing Capacity to 2010 ('000 m3)
Year |
1996 |
1998 |
2000 |
2002 |
2004 |
2006 |
2008 |
2010 |
Roundwood Harvest |
17,627 |
18,372 |
20,000 |
23,507 |
24,720 |
25,608 |
26,090 |
28,725 |
Log Exports |
5,476 |
5,500 |
6,000 |
7,000 |
7,500 |
8,000 |
8,000 |
8,500 |
Processed (Roundwd Eq.) |
12,151 |
12,872 |
13,500 |
14,000 |
14,500 |
15,000 |
15,500 |
16,000 |
Accumulated Forest Stock |
0 |
0 |
500 |
2,507 |
2,720 |
2,608 |
2,590 |
4,225 |
Source: Turland et al, Author
Firstly, there will be a need to find markets for additional log sales. While growth of the Japanese and Korean markets, and substitution for North American and tropical hardwood logs in these markets, could account for some of the growth in log exporting, other markets will also need further development. China is one market with enormous potential. Similarly, a number of other Asian markets offer possibilities. Log exports to South-east Asian nations including Malaysia, Thailand and the Philippines have grown steadily in recent years. China-Taipei and the USA are other markets which may be targeted.
Secondly, New Zealand log exporters will be aware that these same markets need to be targeted for the sale of more processed New Zealand forestry products and a propensity for companies to "shoot themselves in the foot" will need to be avoided. This will involve developing an integrated market strategy ensuring log exports do not spoil markets for processed products, and in which limiting log supplies may be used to maintain prices at a desired level.
Thirdly, and perhaps most importantly, log exports will remain a controversial topic in the New Zealand forestry sector. Log exports are often viewed as an export of employment. By limiting log exports to an "acceptable" level companies may avoid controversy and, particularly if Government policy begins to swing leftwards, avoid the possibility of Government regulation.
Presently, there are no quantitative controls applied to log exports from planted forests. This reflects Government's market-led economic philosophy which requires that land be used in a manner which is most economically efficient. If it were to curb forest growers' access to international log markets, Government argues, the return on an investment in forest growing will be lowered. In this instance land which, in the presence of no export restrictions, would have been used for forest growing may be diverted into some less efficient use.
This policy, while consistent with New Zealand's overall economic philosophy, has been the cause of substantial controversy. Exporting of logs has been equated to exporting employment and, particularly during periods of high international log prices, small domestic processors have been vociferous in their appeals for protection. These processors do have a legitimate argument where overseas processors have free access to New Zealand logs but have protection for their own more processed products. New Zealand processors are disadvantaged in competing in those markets. The Japanese tariff applied to sawn timber has been the principal target for this criticism.
The 1993 amendments to the Forests Act, designed to maintain the long-term sustainability of the natural forests, made exporting logs from the natural forests illegal. Consequently, there is no export trade in natural forest logs
New Zealand imports a very small amount of logs each year. In 1995 log imports totalled 1,365 cubic metres with more than half of these being sourced from Australia. Australian logs were probably eucalyptus used for speciality purposes (e.g. electricity line poles) or possibly to supplement wood pulping. Other speciality purpose logs were imported from USA, Canada, Papua New Guinea and Fiji. It is unlikely that in the future New Zealand will import logs beyond the current special-purpose trade.
Exports of woodchips comprise a very minor segment of the New Zealand forestry industry. Woodchip exports in the year to December 1995 totalled 303,000 bone dry units with an export value of US$40 million. Woodchips are presently exported mainly from four ports in New Zealand - Tauranga, Nelson, Dunedin and Bluff. Presently, Tauranga, Nelson and Dunedin export pine chips, and Bluff exports pine and beech chips. Japan is the sole destination for New Zealand woodchip exports. The chips are used in Japan's pulp and paper industry.
Beech chip exports are being phased out in line with the indigenous forest export provisions of the Forests Act 1949. Beech shipments are almost certain to end in 1996. Pine chip shipments, and possibly some eucalyptus chips will continue into the 21st century. However, new fibreboard capacity is being commissioned in all of the regions presently exporting woodchips. As a consequence chips may be diverted into the new mills reducing, and possibly eventually eliminating, New Zealand's woodchip trade.
New Zealand does not presently import woodchips and a trade is unlikely to develop.
Production of sawn timber in New Zealand has grown strongly since the late-1980's. In 1988 sawn timber production totalled 1,821,000 cubic metres. By 1995 this had increased to 2,949,000 cubic metres, an average annual increase of 8 percent. However, there are signs that New Zealand's production of sawn timber is reaching a plateau in response to several potentially limiting factors in current export markets.
New Zealand has significant sawn timber productive potential. A 1992 New Zealand Forest Industries Strategy Study calculated a scenario based on available wood supplies showing the potential for New Zealand sawn timber production to reach 4.25 million cubic metres by 1995 and 6.3 million cubic metres by 2005. Achievement of this capacity would require the construction of around 30 sawmills of varying sizes throughout New Zealand and increased utilization of existing capacity. It is evident that New Zealand is some distance from having developed this capacity in 1995 and, based on growth performance during the past few years, expected difficulties in export markets and very limited announcements of new capacity over the next few years, it seems unlikely that the 1992 Strategy Study scenarios will be seriously threatened.
Table 4 provides an extrapolation of New Zealand Ministry of Forestry forecasts to 2000 and makes a "best guess" at the structure of the sawn timber sector in New Zealand through to 2010. The production scenario assumes an annual increase of 70,000 cubic metres.
Table 4: Scenario for Growth in Market Dynamics for New Zealand Sawn Timber ('000 m3)
Year |
1996 |
1998 |
2000 |
2002 |
2004 |
2006 |
2008 |
2010 |
Sawmill Production |
3,060 |
3,200 |
3,350 |
3,490 |
3,630 |
3,770 |
3,910 |
4,050 |
Exports |
1,170 |
1,280 |
1,350 |
1,410 |
1,465 |
1,520 |
1,570 |
1,615 |
Imports |
45 |
50 |
50 |
55 |
55 |
60 |
60 |
65 |
Consumption |
1,935 |
1,970 |
2,050 |
2,135 |
2,220 |
2,310 |
2,400 |
2,500 |
Source: NZMOF, Author
Sawn timber consumption in New Zealand is strongly related to housing construction rates and demand for packaging timbers. About 60 percent of sawn timber production is used in dwelling construction and the remaining 40 percent goes into industrial applications and furniture The majority of houses built in New Zealand are wooden framed with new residential dwelling constructions fluctuating between 15,000 and 25,000 units annually during the past 15 years with no substantive upward trend. On this basis, despite targeted GDP growth of 3 percent per annum it is more realistic to base a single scenario projection on 2 percent annual increase in sawn timber consumption. Table 4 shows that 2 percent annual growth in sawn timber consumption will see 2.5 million cubic metres of sawn timber used annually in New Zealand by 2010.
New Zealand's sawn timber producers are increasingly reliant on export markets to fuel the industry's expansion. Sawn timber exports have grown from an average of 300,000 cubic metres per annum in the 1970's to almost 1,200,000 cubic metres per annum.
Table 4 treats sawn timber exports as a residual of the production-consumption equation (Ex = P + I - C). To achieve the industry output shown in Table 4 New Zealand would need to find additional export markets for only an additional 450,000 cubic metres during the coming 15 years. However, this target may prove more daunting than it appears when dynamics in New Zealand's present markets are examined.
Australia is presently by far New Zealand's largest export market. In the year to December 1995 Australia imported 371,000 cubic metres of New Zealand sawn timber, 35 percent of sawn timber exports. And 1995 was a year in which the Australian housing market was in recession. A measure of the weakness of the Australian market is that in 1994 New Zealand sawn timber exports to Australia totalled 475,000 cubic metres. With the New Zealand dollar expected to continue to strengthen against the Australian dollar through to the end of the century, improving sawmill efficiency and improving quality systems will be a key to retaining price advantage in Australia. Australian production of sawn timber is expected to increase as Australia assumes a net exporter position for forestry products. Australian forecasts suggest this position will be reached between 2005 and 2010. In the meantime the Australian market for New Zealand sawn timber is likely to dwindle. New Zealand will need to actively develop new markets particularly for wood presently cut for structural grades of timber. Presently, a high proportion of New Zealand's structural sawn timber production is exported to Australia. Japan, the second largest market, imports primarily packaging grade timber and generally in flitch form. The United States, the third largest market, imports mainly mouldings and shop grade timbers.
New Zealand's sawmillers will probably be required to compete in the same markets as are developed by log exporters. New primary target markets will probably include China, China-Taipei, Malaysia, Philippines and Thailand. For a commodity product such as sawn timber competition will largely be on price which means New Zealand will need to use technology to overcome the relative labour cost disadvantage (competing in Asia). Presently, New Zealand probably has a comparative advantage in treatment and drying of radiata pine sawn timber. However, these advantages are unlikely to remain in the long run.
Radiata pine from New Zealand and Chile has captured around 10 percent of the US markets for shop and mouldings and better lumber, largely as a result of decreased production of US Ponderosa pine. Further increases in export volumes of sawn timber into the US will be limited by radiata pine's capacity to further displace Ponderosa and competing species such as Southern Yellow pine in these markets. Increasing competition from other Central and South American countries also places constraints on New Zealand's ability to further penetrate the US market. Competition from other exporters will be stiff.
New Zealand imports a very limited quantity of sawn timber. Sawn timber imports totalled 42,000 cubic metres in 1995. Almost a half of this comprised Western red cedar imported from Canada. A number of countries supplied small quantities of hardwood sawn timber, the largest quantities being sourced from Indonesia, Fiji, Australia and Malaysia. These hardwoods are generally used for outdoor purposes such as decking and bridge-building, or for furniture. New Zealand is expected to continue to import small, but increasing, amounts of sawn timber.
Wood pulp production in New Zealand is presently carried out at 6 mills in New Zealand. Total production of wood pulp in the year to December 1995 totalled 1,410,000 tonnes, 3.8 percent above production in the December 1994 year. Table 5 shows the practical maximum capacities for New Zealand's pulp and paper mills. As shown, Kawerau and Kinleith are world-scale integrated pulp and paper mills, both also producing some market pulp. Penrose is New Zealand's major paper recycling plant.
Over the past five years, pulp and paper production in New Zealand has been largely stable. However, a major change is in the pipeline for Kawerau and may be a precursor for future changes. Kawerau's production of pulp is likely to decline in volume terms due to a conversion from producing solely radiata softwood pulp to production of both radiata and eucalyptus hardwood pulp. Kawerau is to install a new thermo-mechanical (TMP) pulping facility to replace its ageing stoneground facility. The likely changes to paper production at Kawerau, discussed below, will also see, in the long run, a major reduction in the amount of market pulp sold out of the mill. Kawerau market pulp exports may decline by around 75 percent.
Table 5: Estimated Maximum Practical Capacities for NZ Pulp and Paper Mills (1995) (metric tonnes)
Mill |
Kraft Pulp |
Mechanical Pulp |
Newsprint |
Paperboard/Linerboard |
Fine Paper |
Tissue |
Kawerau |
290,000 |
330,000 |
420,000 |
|||
Kinleith |
450,000 |
300,000 |
||||
Penrose |
60,000 |
|||||
Whakatane |
10,000 |
40,000 |
90,000 |
|||
Mataura |
10,000 |
20,000 |
||||
Caxton |
30,000 |
50,000 | ||||
Karioi |
120,000 |
|||||
Whirinaki |
220,000 |
|||||
Total |
780,000 |
710,000 |
420,000 |
460,000 |
20,000 |
50,000 |
Source:Author
It is increasingly evident that the pulp and paper industry in New Zealand is entering a transitional phase. Obviously more wood-fibre is becoming available for pulping, but the increases are too dispersed to provide material for new kraft pulp mills. Areas which could potentially support a CTMP facility are instead building fibreboard plants. The New Zealand Forest Industries Strategy Study saw fibreboard mills and CTMP mills as two mutually exclusive options in the development of New Zealand's forestry sector. On the positive side New Zealand's economic growth will provide an increasing market for paper. On the negative side New Zealand will eliminate tariffs on pulp and paper in 2000 and around the same time large components in New Zealand's mills will be due for modernization. Some rationalization may occur around the turn of the century.
Perhaps a most likely scenario over the coming 10 years will see New Zealand's mills focus more heavily on the domestic market. Modernization and possibly expansion of existing facilities will allow gradual capacity increases through to 2010. The scenario shown in table 6 spreads these potential increases evenly across the next decade.
Pulp is an intermediate product in the papermaking process. Presently, New Zealand has four integrated pulp mills with both Whakatane and Caxton supplementing their pulp production with purchases (or in-Company transfers) of market pulp. Penrose and Mataura are the two small papermaking facilities without virgin pulping capacity.
Exports of market pulp are made from Kawerau, Kinleith, Karioi and Whirinaki. Karioi is jointly owned by two Indonesian companies, while Whirinaki is owned by New Oji Paper of Japan. Both these mills generally direct the majority (if not all) of their production to their parent companies. Whirinaki's exports ensure Japan is New Zealand's largest export pulp market. Australia, Indonesia, China-Taipei and Korea are other markets to which New Zealand's exports exceed 50,000 tonnes, however there are a broad range of markets importing lesser quantities of woodpulp. Few difficulties are envisaged in selling whatever market pulp New Zealand produces over the forecast horizon.
Table 6: Scenario for Growth in Market Dynamics for New Zealand Pulp ('000 tonnes)
Year |
1996 |
1998 |
2000 |
2002 |
2004 |
2006 |
2008 |
2010 |
Production |
1,387 |
1,379 |
1,386 |
1,430 |
1,460 |
1,490 |
1,520 |
1,550 |
Exports |
640 |
650 |
504 |
520 |
530 |
540 |
550 |
560 |
Imports |
20 |
30 |
25 |
30 |
30 |
30 |
30 |
30 |
Consumption |
767 |
759 |
907 |
940 |
960 |
980 |
1,000 |
1,020 |
Source: NZMOF, Author
Table 6 shows a smoothed increasing trend in pulp production in New Zealand. A major change in the focus of paper production at Kawerau causes a decline in exports in 2000, but using the same smoothing principle exports increase gradually from there-on to 2010.
New Zealand presently imports small volumes of pulp for speciality paper purposes. The USA and South Africa have been the major suppliers of pulp during the past two years. It is anticipated New Zealand will continue to import these, or similar pulp mixes, in small quantities through to 2010.
New Zealand production of newsprint is carried out exclusively at Fletcher Challenge Ltd's (FCL) Kawerau mill. Production in the year to December 1995 totalled 395,000 tonnes, 6.2 percent above production in the December 1994 year.
In New Zealand a significant change in newsprint production is likely to occur over the next three years with the announcement of FCL's Australasian Paper Strategy. The strategy involves shifting newsprint capacity around Australasia with significant changes likely at Kawerau. FCL are examining the potential for converting Kawerau's No. 1 newsprint machine to produce fine coated paper. This plan would reduce Kawerau's newsprint output by 120,000 tonnes per annum, but would establish a 230,000 tonne fine paper facility. The newsprint reduction would eliminate the need to export into Asia spot markets and reduce the volume of exports into Australia. Table 7 shows a market dynamics scenario for newsprint in New Zealand.
Table 7: Scenario for Growth in Market Dynamics for New Zealand Newsprint ('000 tonnes)
Year |
1996 |
1998 |
2000 |
2002 |
2004 |
2006 |
2008 |
2010 |
Production |
380 |
280 |
260 |
260 |
260 |
260 |
260 |
260 |
Exports |
260 |
140 |
110 |
100 |
90 |
80 |
70 |
60 |
Imports |
0 |
0 |
0 |
0 |
0 |
0 |
0 |
0 |
Consumption |
120 |
140 |
150 |
160 |
170 |
180 |
190 |
200 |
Source: NZMOF, Author
New Zealand's consumption of newsprint is likely to continue to match economic growth. There are suggestions that the profusion of electronic media may, in time, make newspapers redundant thereby significantly reducing newsprint demand. This paper does not subscribe to these suggestions.
Exports of newsprint in the year to December 1995 totalled 228,000 tonnes, 9.2 percent below the volume exported in the previous December year. Newsprint exports from New Zealand will decline as a result of the new paper strategy and will continue to decline, as shown in Table 7, as priority is given to servicing the New Zealand domestic market. Almost all exports will be to Australia as part of the FCL Australasian paper strategy.
New Zealand presently imports almost no newsprint. Newsprint imports in 1995 totalled 28 tonnes. There is unlikely to be significant change to Tasman Pulp and Paper's present monopoly.
In the year to December 1995 New Zealand's production of other paper and paperboard totalled 508,000 tonnes. Table 5 shows the majority of this production is kraft linerboard, though smaller quantities of tissue and fine papers are also produced. Production and exports of coated printing and writing papers will be substantially boosted when FCL goes ahead with its planned upgrades at Kawerau. FCL would expect to capture the bulk of the New Zealand coated paper market. Table 8 shows substantial change to market dynamics in response to this planned conversion.
Table 8: Scenario for Growth in Market Dynamics for New Zealand Paper and Paperboard ('000 tonnes)
Year |
1996 |
1998 |
2000 |
2002 |
2004 |
2006 |
2008 |
2010 |
Production |
500 |
660 |
710 |
730 |
750 |
770 |
790 |
810 |
Exports |
100 |
190 |
220 |
210 |
200 |
190 |
180 |
180 |
Imports |
190 |
140 |
140 |
150 |
150 |
160 |
160 |
170 |
Consumption |
590 |
610 |
630 |
670 |
700 |
730 |
770 |
800 |
Source: NZMOF, Author
There are unlikely to be new paper mills built and, with the phasing out of paper tariffs around 2001, New Zealand's smallest mills may struggle to remain competitive. However, other existing mills are likely to expand capacities during upgrades to more than offset any closures and paper and paperboard production is likely to increase throughout the period.
Consumption growth in other paper and paperboards is likely to mirror growth rates in the general economy. Consequently, consumption has been conservatively estimated at growing by around 2 percent per annum.
A significant portion of the coated paper produced through the expansion at Kawerau would be exported to Australia where FCL recently purchased Pratt Paper, an Australian paper distributor. Currently around two-thirds of all New Zealand's paper exports are sent to Australia. The other major markets appear to be spot market sales into Hong Kong and Singaporean trading markets. The FCL strategy is designed to eliminate the need for these sales by focusing on Australasia and signs are that the other paper mills (owned by Carter Holt Harvey) are following suit. Exports of paper over the longer term of the forecast are expected to decline substantially with increasing substitution to meet the demands of the domestic market.
Imports of other paper and paperboard comprise the vast bulk of forestry products imports into New Zealand. Total imports of forestry products in 1995 totalled US$535 million of which pure paper and paperboard imports comprised US$270 million, and manufactures of paper and paperboard comprised an additional US$150 million. Presently these are mainly sourced from Europe, Australia, Japan and the US.
The Kawerau conversion will markedly reduce New Zealand's forestry import burden with a major decline expected between 1998 and 2000. After 2000 increasing consumption should also see a trend toward increasing imports to meet the speciality paper needs which New Zealand cannot meet for itself.
Fibreboard capacity in New Zealand is growing rapidly. Production of fibreboard in the year to December 1995 was 664,000 cubic metres. With substantial new capacity planned to be commissioned during the coming five years annual fibreboard production over the next five years is expected to increase by around 350,000 cubic metres to 1,050,000 cubic metres in the March 2000 year. The bulk of this production increase will be exported. Table 9 provides a summary of production and capacity change over the coming five years.
Table 9: Estimated Fibreboard Production and Capacity by Mill
Mill |
1995 Production |
2000 Production |
2000 Capacity |
Start-up date |
Canterbury Timber Products |
185,000 |
210,000 |
220,000 |
|
Nelson Pine Industries |
210,000 |
340,000 |
370,000 |
(1997)* |
FCL Auckland |
42,000 |
40,000 |
45,000 |
|
FCL Taupo |
175,000 |
160,000 |
175,000 |
|
Juken Nissho Kaitaia |
85,000 |
85,000 |
85,000 |
|
Rayonier Mosgiel |
0 |
95,000 |
120,000 |
1997 |
Wenita Taeri |
0 |
10,000 |
120,000 |
1999 |
Carter Holt Eves Valley |
0 |
40,000 |
120,000 |
1999 |
Juken Nissho Gisborne |
0 |
70,000 |
85,000 |
1998 |
Total |
697,000 |
1,050,000 |
1 340,000 |
*New line
Source: Author
Not all of this production is, or will be, medium density fibreboard. FCL Auckland produces hardboard and softboard, while the Juken Nissho mills produce tri-board (a fibreboard core with two facing veneers). The 1992 New Zealand Forest Industries Strategy Study identified a production scenario with the potential for 10 new fibreboard lines to be installed between 1992 and 2005. Presently New Zealand is tracking this scenario quite closely with 7 lines likely to have been established by 2000. The scenario mapped in Table 10 assumes 4 additional lines will start up in the first decade of the 21st Century. Table 10 provides a scenario of market dynamics for fibreboard in New Zealand.
Table 10: Scenario for Growth in Market Dynamics for New Zealand Fibreboard ('000 m3)
Year |
1996 |
1998 |
2000 |
2002 |
2004 |
2006 |
2008 |
2010 |
Production |
700 |
920 |
1,050 |
1,250 |
1,350 |
1,450 |
1,550 |
1,650 |
Exports |
400 |
590 |
700 |
880 |
965 |
1,045 |
1,125 |
1,205 |
Imports |
5 |
5 |
5 |
5 |
10 |
10 |
10 |
10 |
Consumption |
305 |
335 |
355 |
375 |
395 |
415 |
435 |
455 |
Source: NZMOF, Author
Consumption of fibreboard in New Zealand is generally for cabinet work, mouldings or for furniture manufacture. Some of this furniture is later exported. Consumption, in Table 10, is forecast to increase by around 3 percent per annum, in line with predicted general economic expansion. There is, however, considerable potential for pure fibreboard exports to be diverted into domestic consumption for remanufacture and later export. This potential is not modelled here.
International demand for fibreboard is growing rapidly and a large number of new mills are being commissioned globally to meet this demand. For example, US fibreboard capacity is expected to increase by 1.7 million cubic metres in the coming five years. Canadian capacity will expand by a similar magnitude, while a number of Asian mill start-ups will also impact on New Zealand's markets. The global fibreboard market is still relatively immature and it is difficult to estimate the overall price impacts of such rapid growth. It is also unclear whether, in fact, markets exist for all the production. Table 10 shows strong increases in New Zealand exports of fibreboard. This assumes no problems for marketing New Zealand's production and this may be an optimistic assumption.
Japan has become the dominant market for New Zealand's fibreboard exports, moving Australia into second place. In 1995 Australia purchased US$37 million, Japan took US$65 million and Taiwan bought US$18 million. These markets are likely to remain among the most important although several other South-east Asian countries including, Thailand, Malaysia and the Philippines may also become significant importers of New Zealand fibreboard.
New Zealand imports minimal quantities of fibreboard, mainly hardboard from Australia.
Particleboard is produced at three mills in New Zealand. Currently production totals around 175,000 cubic metres per annum and there are presently no plans afoot to increase production. However, the most recently constructed mill, Kopu, was completed only in 1990 which suggests the economics of particleboard manufacture in New Zealand remain sound. There is probably scope for one or two smaller mills to be commissioned soon after 2000 and Table 11 shows this scenario.
Table 11: Scenario for Growth in Market Dynamics for New Zealand Particleboard ('000 m3)
Year |
1996 |
1998 |
2000 |
2002 |
2004 |
2006 |
2008 |
2010 |
Production |
170 |
170 |
170 |
190 |
200 |
200 |
240 |
240 |
Exports |
120 |
116 |
112 |
128 |
133 |
129 |
164 |
160 |
Imports |
2 |
2 |
2 |
3 |
3 |
4 |
4 |
5 |
Consumption |
52 |
56 |
60 |
65 |
70 |
75 |
80 |
85 |
Source: NZMOF, Author
Domestic consumption of particleboard has declines sharply in New Zealand over the past 10 years. In 1985 particleboard consumption totalled 156,000 cubic metres. In 1995 this had declined to 46,000 cubic metres. A large part of the decline has been the substitution of fibreboard for particleboard in construction purposes. Nonetheless it is difficult to see particleboard consumption declining further. Consequently Table 11 describes a modest recovery of particleboard consumption to 2010.
As New Zealand consumption of particleboard has declined exports of particleboard have increased. In general this trend is shown as continuing in Table 11, contingent on new particleboard capacity being installed. Australia and Japan are the most important particleboard markets for New Zealand.
New Zealand imports small quantities of particleboard. Particleboard imports in 1995 totalled 2,000 cubic metres. This is unlikely to change.
Plywood production has been a growth area in New Zealand's forest industry during the past five years with laminated veneer lumber (LVL) an important subgroup of plywood production. The opening of Carter Holt Harvey's new Tokoroa plywood plant, in tandem with the Juken Nissho plant at Gisborne, has significantly increased the plywood/veneer capacity of the sector with the result that announced plywood capacity increases will be sufficient to increase production from 164,000 cubic metres in the year to December 1995, to 295,000 cubic metres in year 2000. Veneer production (most of which is used for plywood production) will increase by a similar magnitude. The scenario described in Table 12 assumes further capacity increases around 2005.
Table 12: Scenario for Growth in Market Dynamics for New Zealand Plywood ('000 m3)
Year |
1996 |
1998 |
2000 |
2002 |
2004 |
2006 |
2008 |
2010 |
Production |
165 |
255 |
295 |
310 |
310 |
350 |
380 |
400 |
Exports |
130 |
208 |
256 |
270 |
268 |
306 |
335 |
353 |
Imports |
5 |
5 |
5 |
6 |
6 |
6 |
7 |
7 |
Consumption |
40 |
42 |
44 |
46 |
48 |
50 |
52 |
54 |
Source: NZMOF, Author
Plywood consumption in New Zealand has never been substantial and, with continued growth in fibreboard production, there is limited scope for consumption to increase. Increases in line with 3 percent annual growth are modelled in Table 12.
Exports will increase very much in line with increases in production. Much of New Zealand's plywood production is likely to go into North Asia markets, particularly Japan and Korea, for use in low grade construction work particularly for concrete formwork. In latter years an increasing proportion of plywood classification exports will actually be laminated veneer lumber. Presently, this comprises around a third of New Zealand's plywood exports. Veneer exports will remain relatively small, but not unimportant. Presently New Zealand exports around 12,000 cubic metres of veneer.
New Zealand presently imports around 5,000 cubic metres of plywood and 2,500 cubic metres of veneer. These are generally hardwood products sourced from Indonesia, Malaysia, Fiji and Brazil. This low level of imports is not expected to increase markedly.
Other forestry products comprise a range of manufactured and remanufactured items including furniture and furniture components, manufactures of paper and paperboard, mouldings, prefabricated housing components and other wooden manufactures. Production data for this range of articles is not compiled as part of the forestry statistics. However, these are significant industries. As an indication, the annual export value of these items exceeds US$130 million.
Solidwood remanufacturing has been identified as a major opportunity for New Zealand to enhance the contribution made by forestry to the economy. Relatively modest investments could, on paper, return high export returns and result in significant employment within forestry. The reality has yet to transpire. Radiata Pine's image as an industrial grade timber does not lend itself to promoting higher value enduses in many markets. Additionally, the Just-In-Time nature of many secondary components markets severely disadvantages exporters relative to local firms. It seems likely New Zealand firms will need to seriously revise their strategies to compete in remanufactured markets. This may involve establishing processing plants offshore (as is presently being done in Thailand) or large scale warehousing facilities.
Remanufacturing firms are likely to continue to further process sawn timber otherwise directly destined for the export market. It is unlikely that they will generate much additional demand for roundwood.
1 Target clearfell age for radiata pine- 30 years. No new planting. Complete descriptions of assumptions included in publication.
2 Target clearfell age for radiata pine- 30 years. 50,000 hectares annually of new planting. Complete descriptions of assumptions included in publication.
![]()
![]()
![]()