![]()
![]()
![]()
ANNEX 5: NATIONAL EXOTIC FOREST DESCRIPTION -NATIONAL AND REGIONAL WOOD SUPPLY FORECASTS - 1996
by Paul Lane (NZMOF) & Lisa Te Morenga (NZFRI)
In October 1996, the New Zealand Ministry of Forestry published the latest National Exotic Forest Description (NEFD) wood supply forecasts. The Overview from this report is reprinted below. [As can been seen, these new wood supply forecasts remain consistent with the forecasts used in the main paper with the base and new planting wood flow scenarios incorporating this paper's forecast for 2010 in their narrow range and a virtually identical late cut scenario used as is modelled in Table 3]
Overview
The potential sustainable wood supply available from New Zealand's planted production forests is forecast to rise from 17.1 million cubic metres in the year ending 31 March 1996 to almost 30 million cubic metres by 2010, a 73 percent increase. The volume of pruned logs is forecast to rise steadily from 1.5 million cubic metres in 1996 to 4.2 million cubic metres in 2010, an almost three-fold increase. Radiata pine makes up 89 percent of the wood supply in 1996 and is expected to increase to 93 percent by 2010.
The forecast 73 percent increase in annual wood harvest between 1996 and 2010 will result in a doubling of the area of forest harvested each year. The forecast harvest in 2010 will be from clear felling 53,000 hectares of planted production forest, compared with the estimated harvested area of 26,000 hectares in the year ending March 1996.
This study uses six scenarios to show the outcome of a range of options on the long-term, sustainable supply of wood. Three clear fell age scenarios: base cut, early cut, and late cut are based on the age of harvesting and assume no new planting.
Three new planting scenarios: plant 40,000 ha/year, plant 60,000 ha/year, and plant 90,000 ha/year are based on a range of new planting levels. The primary assumptions for each of these scenarios are shown in table A5-1.
Table A5-1: Primary Assumptions for Each Scenario
|
Scenario |
Target clear fell age for radiata pine (years) |
Area of national new planting (ha/year) |
base cut |
28 |
0 |
early cut |
25 |
0 |
late cut |
35 |
0 |
plant 40,000 ha/year |
28 |
40,000 |
plant 60,000 ha/year |
28 |
60,000 |
plant 90,000 ha/year |
28 |
90,000 |
Radiata pine was modelled on a non-declining yield basis in all scenarios, and all areas clear felled are assumed to be replanted in the year following clear felling.
Increased growth rates from genetically improved planting stock have not been directly included in any of the scenarios. The long-term wood supply forecasts presented are considered to be conservative without the inclusion of genetic improvement.
The base cut scenario is the best forecast of future wood supply based on the existing planted forest estate. The early and late cut scenarios provide estimates of upper and lower bounds within which the future level of harvest will almost certainly fall. These clear fell age scenarios show the effect of selecting different target clear fell ages on the long-run wood supply when it is managed on a sustainable yield basis.
The new planting scenarios show the outcome of different levels of new planting on the long-run forecast wood supply. The impact of new planting does not dramatically increase the wood supply until 2020. The plant 60,000 ha/year scenario is the best estimate of future new planting. The other two new planting scenarios provide likely estimates of upper and lower bounds.
Separate forecasts were carried out for each of the 10 wood supply regions: Northland; Auckland; Central North Island; East Coast; Hawkes Bay; Southern North Island; Nelson & Marlborough; West Coast; Canterbury; and Otago & Southland. These were then aggregated to provide the national forecasts summarized in table A5-2.
Table A5-2: National Wood Supply Forecasts (Average Annual Recoverable Volumes Million Cubic Metres/ Year)
|
Lustrum |
Base cut |
Early cut |
Late cut |
Plant 40,000 ha/year |
Plant 60,000 ha/year |
Plant 90,000 ha/year |
1996-00 |
18.8 |
22.3 |
17.4 |
18.8 |
18.8 |
18.8 |
2001-05 |
26.6 |
27.6 |
17.7 |
26.6 |
26.6 |
26.6 |
2006-10 |
29.1 |
28.7 |
24.6 |
29.2 |
29.2 |
29.3 |
2011-15 |
29.4 |
29.8 |
30.2 |
30.3 |
30.5 |
31.0 |
2016-20 |
31.0 |
29.9 |
31.0 |
32.0 |
32.4 |
32.9 |
2021-25 |
31.3 |
30.1 |
32.1 |
40.3 |
42.4 |
43.4 |
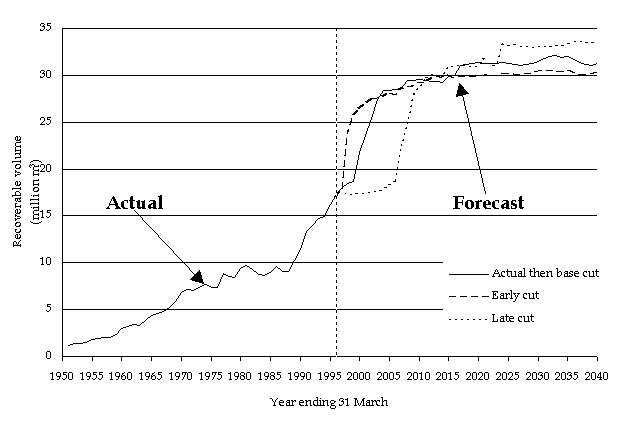
Graph 1 shows the wood supply forecasts in context with historical levels of planted forest harvest since 1951. This graph illustrates that the increase in the rate of harvesting that began in 1989 will continue until around 2005 in the base cut scenario. While there have been major structural changes in the ownership of planted forests during the 1990s, the primary reason for the increase in harvest was the establishment of significant areas of new planted production forests from the early 1970s to the mid-1980s. During the 15-year period 1971 to 1986 an average 45,000 hectares of new forest was established each year.
Graph 1: Actual and Forecast Harvest from New Zealand's Planted Forests
 Notes:
1. The vertical line indicates the beginning of the forecasts (1996).
2. Source of actual planted forest volumes: New Zealand Forestry Statistics 1995, Ministry of Forestry, 1996. Table A11, pp 16.
The forecast for each of the clear fell age scenarios rises steeply from 1997 to 2010. Each of these scenarios reaches a plateau where the annual recoverable volume becomes reasonably constant indefinitely. Table A5-3 summarizes these levels and the years they are reached.
Table A5-3: Maximum Recoverable Volumes Forecast for the Clear fell Age Scenarios
Scenario |
Target age of radiata pine (years) |
Maximum recoverable volume (million m3/yr) |
Year available from |
Base cut |
28 |
31.0 - 32.1 |
2017 on |
Early cut |
25 |
29.7 - 30.5 |
2012 on |
Late cut |
35 |
33.1 - 33.6 |
2024 on |
The early cut forecast demonstrates a sharp rise in wood supply post-1997, reaching a plateau around 2012. However, this plateau stabilizes at a level one to two million cubic metres lower than the other scenarios. It is also important to recognize that the physical properties of radiata pine logs from 25-year-old stands are different from logs produced from older stands.
The wood supply forecast from the new planting scenarios does not reach a steady state plateau since new areas of forest are continuously established over the forecast horizon (see graph 2).
Graph 2: Forecast Wood Supply from New Zealand's Forests Assuming Constant New Planting
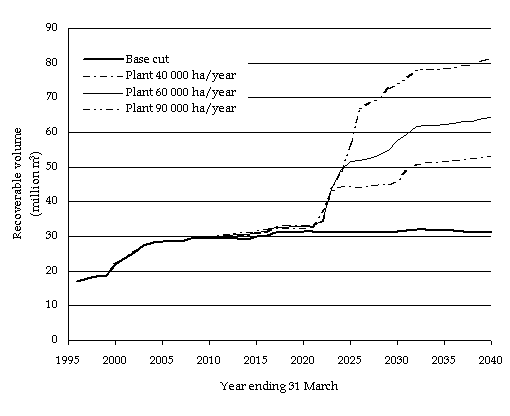
The Central North Island is the dominant wood supply region, producing 59 percent of the forecast national wood supply in 1996. While still remaining dominant, the future supply of wood produced in the Central North Island is relatively constant. In regions with extensive areas of young planted forests, such as Northland and the East Coast, there will be large increases in wood supply as forests in these regions begin to mature.
The forecasts in this report are essentially resource-based forecasts of the level of harvest attainable given the assumptions on yields, areas and harvesting constraints. This is not a prediction of how companies will manage the cut from their forests, nor is it a prescription for how their cut should be managed.
![]()
![]()
![]()