![]()
![]()
![]()
Jan Remröd
Swedish Forest Industries Association, Stockholm
General economic situation
The weakening of the economic activity, that started during the second half of 1995, continued in 1996. Stocks were reduced in the industry and in the distribution chain, and stock reduction seems to have contributed negatively to GDP with one percentage point. Industry production slowed down considerably, from an increase of 10 percent in 1995 to 1 percent in 1996. Investments showed a strong increase for the whole year, 7 percent, but slowed down during the course of the year, as a three-year investment cycle is nearing its end.
The inflation rate continued to decrease to a record low and is one of the lowest in Europe. Both long- and short-term interest rates continued to decrease. The unemployment continues to be a major problem, and the unemployment rate is considered to be only marginally reduced during the next few years. The budget deficit in the public sector has been considerably reduced.
Key indicators, percentage change
|
|
1995 |
1996 |
1997 prognosis |
|
GDP |
3.6 |
1.2 |
2.0 |
|
Consumer prices |
2.9 |
0.8 |
1.0 |
|
Open unemployment |
7.7 |
7.9 |
7.0 |
|
Current account balance, in percentage of GDP |
2.1 |
2.6 |
4.0 |
Performance of the pulp and paper industry
The Swedish production of paper and board decreased in 1996 for the second consecutive year and amounted to 9 million tonnes, a decrease by 125 000 tonnes or 1 percent. The capacity utilisation fell to 90 percent. Exports decreased marginally, by 0.5 percent and amounted to 7.3 million tonnes. Deliveries to the EU countries fell by 2 percent and reached 5.7 million tonnes. Deliveries to Eastern European countries increased strongly but are still at low levels, and also exports to Asia increased. Deliveries to the home market decreased by 3 percent. For further details see the statistics attached.
The Swedish exports of pulp increased by 2 percent. Producers' inventories were reduced in the first half year, but showed again an increase towards the end of the year. See also the statistics attached.
Recovered paper
The consumption of recovered paper at paper and board mills increased by 5 percent to 1.5 million tonnes in 1996. This resulted in an increase of the utilization rate to 16.7 percent compared to 15.6 percent the year before. The collection of recovered paper has been calculated to 1.1 million tonnes corresponding to a recovery rate of about 55 percent. The availability of recovered paper was good during the year.
A new de-inking line with a yearly capacity of 140 000 tonnes of newspapers and magazines started up in May 1996.
Raw material availability 1996-1997
Both the sawmill industry and the pulp and paper industry experienced high raw material availability during most of 1996. The situation for the sawmills, however, changed during the third quarter, when sawmills in some regions started to experience timber shortage. Price raises during the fourth quarter for saw timber have improved the situation, and at present there is a good availability for raw material for both sawmills and pulpmills.
Investment and capacity in the pulp and paper industry
Investments in the pulp and paper industry in Sweden reached 12 billion SEK in 1996 and are predicted to reach 9 billion SEK in 1997.
According to preliminary figures in the most recent capacity survey, paper and board capacity will increase by 500 000 tonnes to 10.5 million tonnes in 1997. A new machine for the production of liquid board has recently started up, and the capacity figures also reflects the new machines for LWC and newsprint that started up in 1996. Investments also concern improved quality standard of pulp and paper, rebuilds of wood-handling and of the bleaching process in the pulp mills and other environmental measures. Market pulp capacity will increase by 100 000 tonnes to 3.9 million tonnes in 1997.
Issues of particular interest
Progress in sustainable forest management (SFM) also in relation to certification
Swedish forestry has gone through some major changes during the last decade. All forest companies have introduced ambitious environmental programmes to be able to practise forestry without jeopardising the biological diversity. Sustainable forest management is today not only a question of sustainable yield, but also of ecological sustainability. Some steps towards sustainability that have been taken are: site-adaptation, day-to-day conservation and ecological landscape planning.
The Swedish forest industry looks upon certification as a way to verify, and get credit for, the environmentally friendly methods that already have been, and will be, introduced.
The Swedish forest industry is involved in the certification issue at three different levels:
International
The industry participates in the ISO Working Group (ISO/TC207/WG2 on Forestry). The groups mission is to create a linkage between national certification standards and ISO 14000. The Swedish forest industry believes that a nationally-developed certification standard within the Forest Stewardship Council (FSC) framework could be very well linked to the ISO environmental management system. Therefore, FSC and ISO are complementary, and do not exclude each other.
Nordic
The Nordic Certification Project is a cooperation between the forest industry and the forest owners in Sweden, Finland and Norway. The aim of the project is to share information and experiences from the national certification initiatives which now take place in the Nordic countries, and to harmonise the national work as much as possible.
National
A Swedish FSC Working Group was formed in February 1996. Economic, environmental and social interests participate in the work. All relevant stakeholders have decided to take part in the work. The Swedish forest industry is also an active part in the discussion. The Working Group plans to propose a national standard during the spring of 1997. The proposals should be developed in consensus.
The socio-economic dimension of SFM and wood processing
Sweden has a long tradition of a good relations between employers, employees and indigenous people. Most potential conflicts have been settled a long time ago. In some cases, the parties have opposing interests, such as wages, etc. These questions are, however, settled in regular negotiations each year.
The remaining questions regarding the socio-economic dimension of SFM will be discussed and handled within the Swedish FSC Working Group.
Sustainability of fibre supply
The annual timber harvest has, throughout the whole century, been far below the annual increment. At present, only 70 percent of the yield will be harvested. The Swedish fibre supply is therefore sustainable indeed.
Paper and board statistics, 1996
|
Production |
1996 |
1995 |
Change in |
1996 |
1995 |
Change in |
|
|
thousand tonnes |
Q4 |
Q4 |
% 96/95 |
Acc |
Acc |
% 96/95 |
|
|
Newsprint |
580 |
561 |
3.4% |
2283 |
2345 |
-2.6% |
|
|
Woodfree printing and writing |
390 |
303 |
28.8% |
1418 |
1394 |
1.7% |
|
|
Wood-containing printing and writing |
204 |
155 |
31.9% |
752 |
652 |
15.3% |
|
|
Tissue |
76 |
79 |
-3.6% |
297 |
293 |
1.5% |
|
|
Wrapping papers |
206 |
260 |
-20.7% |
880 |
1082 |
-18.7% |
|
|
|
Kraft paper |
200 |
254 |
-21.2% |
858 |
1057 |
-18.8% |
|
Folding boxboards |
319 |
285 |
11.9% |
1345 |
1358 |
-0.9% |
|
|
Case materials |
475 |
404 |
17.6% |
1910 |
1904 |
0.3% |
|
|
|
Kraft liner |
381 |
313 |
21.9% |
1506 |
1491 |
1.0% |
|
Others |
35 |
36 |
-2.6% |
132 |
140 |
-5.7% |
|
|
Total paper and board |
2286 |
2083 |
9.7% |
9018 |
9169 |
-1.6% |
|
|
Total deliveries |
1996 |
1995 |
Change in |
1996 |
1995 |
Change in |
|
|
thousand tonnes |
Q4 |
Q4 |
% 96/95 |
Acc |
Acc |
% 96/95 |
|
|
Newsprint |
615 |
580 |
6.0% |
2252 |
2350 |
-4.2% |
|
|
Woodfree printing and writing |
373 |
297 |
25.5% |
1422 |
1377 |
3.3% |
|
|
Wood-containing printing and writing |
204 |
177 |
15.4% |
722 |
715 |
0.9% |
|
|
Tissue |
68 |
67 |
2.3% |
272 |
279 |
-2.5% |
|
|
Wrapping papers |
189 |
239 |
-21.1% |
811 |
988 |
-17.9% |
|
|
|
Kraft paper |
182 |
232 |
-21.2% |
790 |
962 |
-18.0% |
|
Folding boxboards |
322 |
282 |
14.0% |
1318 |
1281 |
2.9% |
|
|
Case materials |
464 |
392 |
18.4% |
1932 |
1826 |
5.8% |
|
|
|
Kraft liner |
364 |
304 |
19.8% |
1514 |
1424 |
6.3% |
|
Others |
33 |
32 |
3.1% |
129 |
132 |
-2.6% |
|
|
Total paper and board |
2267 |
2066 |
9.8% |
8858 |
8948 |
-1.0% |
|
|
Exports |
1996 |
1995 |
Change in |
1996 |
1995 |
Change in |
|
|
thousand tonnes |
Q4 |
Q4 |
% 96/95 |
Acc |
Acc |
% 96/95 |
|
|
Newsprint |
512 |
463 |
10.6% |
1862 |
1929 |
-3.5% |
|
|
Woodfree printing and writing |
305 |
232 |
31.4% |
1162 |
1118 |
4.0% |
|
|
Wood-containing printing and writing |
164 |
137 |
20.3% |
594 |
569 |
4.3% |
|
|
Tissue |
39 |
36 |
6.8% |
152 |
146 |
4.3% |
|
|
Wrapping papers |
167 |
215 |
-22.4% |
723 |
891 |
-18.9% |
|
|
|
Kraft paper |
162 |
209 |
-22.7% |
704 |
869 |
-19.0% |
|
Folding boxboards |
265 |
227 |
17.1% |
1068 |
1037 |
3.0% |
|
|
Case materials |
389 |
324 |
20.1% |
1614 |
1524 |
5.9% |
|
|
|
Kraft liner |
326 |
271 |
20.2% |
1356 |
1272 |
6.6% |
|
Others |
26 |
24 |
8.6% |
101 |
100 |
0.9% |
|
|
Total paper and board |
1869 |
1658 |
12.7% |
7275 |
7315 |
-0.5% |
|
|
Domestic deliveries |
1996 |
1995 |
Change in |
1996 |
1995 |
Change in |
|
|
thousand tonnes |
Q4 |
Q4 |
% 96/95 |
Acc |
Acc |
% 96/95 |
|
|
Newsprint |
102 |
117 |
-12.3% |
390 |
420 |
-7.3% |
|
|
Woodfree printing and writing |
68 |
65 |
4.3% |
260 |
259 |
0.3% |
|
|
Wood-containing printing and writing |
39 |
40 |
-1.3% |
128 |
146 |
-12.2% |
|
|
Tissue |
30 |
3! |
-3.1% |
119 |
133 |
-10.1% |
|
|
Wrapping papers |
21 |
23 |
-9.1% |
89 |
97 |
-8.9% |
|
|
|
Kraft paper |
21 |
22 |
-7.2% |
86 |
93 |
-7.9% |
|
Folding boxboards |
56 |
55 |
1.5% |
250 |
244 |
2.7% |
|
|
Case materials |
76 |
69 |
10.5% |
318 |
301 |
5.4% |
|
|
|
Kraft liner |
38 |
33 |
15.9% |
158 |
152 |
4.0% |
|
Others |
7 |
8 |
-14.0% |
28 |
32 |
-13.1% |
|
|
Total paper and board |
399 |
407 |
-2.0% |
1583 |
1634 |
-3.1% |
|
|
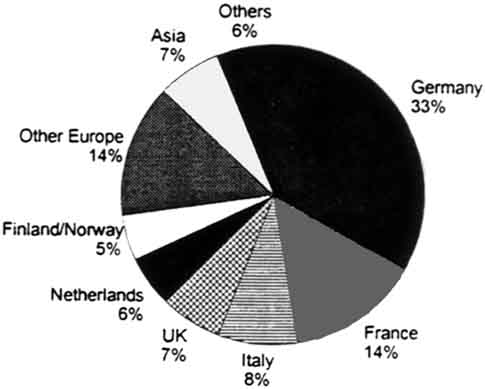
Deliveries per destination |
1996 |
1995 |
Change in |
1996 |
1995 |
Change in |
|
|
thousand tonnes |
Q4 |
Q4 |
% 96/95 |
Acc |
Acc |
% 96/95 |
|
|
EC, excl. Sweden |
1443 |
1306 |
10.5% |
5716 |
5827 |
-1.9% |
|
|
|
United Kingdom |
364 |
334 |
9.0% |
1429 |
1466 |
-2.5% |
|
Germany |
345 |
332 |
4.0% |
1429 |
1475 |
-3.1% |
|
|
France |
146 |
126 |
16.2% |
604 |
621 |
-2.8% |
|
|
Italy |
101 |
102 |
-1.1% |
432 |
482 |
-10.5% |
|
|
Other West Europe |
116 |
100 |
16.1% |
446 |
408 |
9.2% |
|
|
North America |
21 |
31 |
-32.1% |
83 |
135 |
-38.5% |
|
|
Asia |
165 |
114 |
44.7% |
616 |
529 |
16.3% |
|
|
Other countries |
124 |
108 |
15.3% |
414 |
415 |
-0.1% |
|
|
Total exports |
1869 |
1659 |
12.7% |
7275 |
7315 |
-0.5% |
|
|
Domestic |
399 |
407 |
-2.0% |
1583 |
1634 |
-3.1% |
|
|
Total Deliveries |
2268 |
2066 |
9.8% |
8858 |
8948 |
-1.0% |
|
Swedish Forest Industries Association, March 1996.
Exports of Paper and Board
Deliveries by destination-change in per cent 96/95
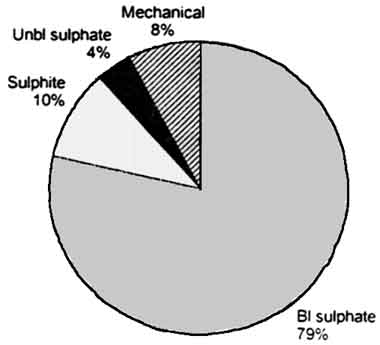
Deliveries by grade
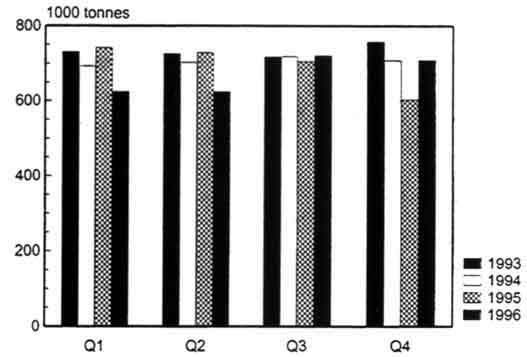
Market pulp statistics, 1996
Market pulp
|
PRODUCTION |
Q4 |
Q4 |
Change |
Cumul. |
Cumul. |
Change |
|
thousand tonnes |
1996 |
1995 |
96/95% |
1996 |
1995 |
96/95% |
|
TOTAL |
820 |
719 |
14.2 |
3136 |
3324 |
-5.7 |
|
of which |
|
|||||
|
Mechanical pulp |
78 |
90 |
-13.0 |
328 |
412 |
-20.4 |
|
White pulp |
709 |
603 |
17.6 |
2679 |
2781 |
-3.7 |
|
EXPORTS |
Q4 |
Q4 |
Change |
Cumul. |
Cumul. |
Change |
|
thousand tonnes |
1996 |
1995 |
96/95% |
1996 |
1995 |
96/95% |
|
TOTAL |
617 |
516 |
19.7 |
2628 |
2587 |
1.6 |
|
of which |
|
|||||
|
Mechanical pulp |
48 |
59 |
-19.6 |
219 |
272 |
-19.3 |
|
White pulp |
546 |
439 |
24.3 |
2292 |
2213 |
3.6 |
|
DELIVERIES OF WHITE PULP |
Q4 |
Q4 |
Change |
Cumul. |
Cumul. |
Change |
|
thousand tonnes |
1996 |
1995 |
96/95% |
1996 |
1995 |
96/95% |
|
EU excl. Nordic |
444 |
366 |
21.2 |
1885 |
1893 |
-0.4 |
|
of which |
|
|||||
|
Germany |
190 |
154 |
22.9 |
792 |
776 |
2.1 |
|
France |
85 |
60 |
41.9 |
338 |
330 |
2.3 |
|
Netherlands |
30 |
21 |
45.8 |
118 |
109 |
7.6 |
|
Italy |
39 |
30 |
30.0 |
183 |
188 |
-3.0 |
|
W. Europe excl. Nordic |
465 |
377 |
23.4 |
1963 |
1961 |
0.1 |
|
Finland+Norway |
28 |
21 |
31.4 |
103 |
101 |
1.8 |
|
E. Europe |
27 |
17 |
59.6 |
110 |
84 |
31.4 |
|
Asia |
21 |
14 |
53.6 |
78 |
38 |
107.4 |
|
North America |
3 |
7 |
-61.6 |
22 |
17 |
31.1 |
|
Other countries |
2 |
4 |
-36.4 |
15 |
12 |
26.0 |
|
TOTAL EXPORTS |
546 |
439 |
24.3 |
2292 |
2213 |
3.6 |
|
Domestic |
129 |
87 |
47.6 |
458 |
419 |
9.2 |
|
TOTAL DELIVERIES |
675 |
527 |
28.2 |
2750 |
2632 |
4.5 |
White pulp = bleached sulphate, unbleached and bleached sulphite.
Swedish Forest Industries Association, March 1996.
DELIVERIES OF WHITE PULP BY DESTINATION - Percentage change 96/95
DELIVERIES BY GRADE - Percentage change 96/95
![]()
![]()
![]()