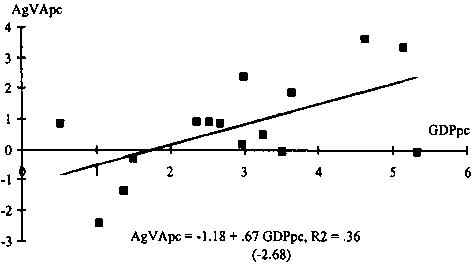
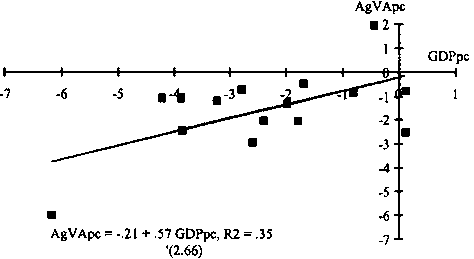
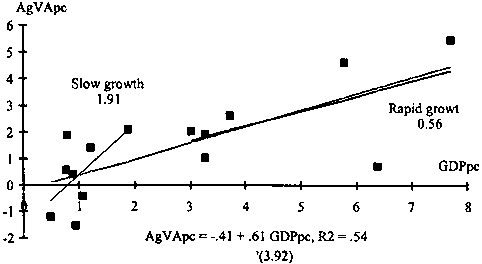
Figure 1. Relation between GDP and Agricultural growth
Early growth

Recession

Late growth

Table 1 Gross domestic product per capita (estimated annual growth rate, constant local currency)
Table 2 Real exchange rate (estimated annual growth rate)
Table 3 Inflation (estimated annual)
Table 4 Government expenditure (estimated annual growth rate, constant local currency)
Table 5 Agricultural value added per capita (estimated annual growth rate, constant local currency)