Given that there are several interrelated factors, at the macro and micro levels, influencing demand for woodfuels, making a wood energy outlook is an arduous and complicated task. Moreover, the extent at which these factors influence wood energy demand is not easily known largely because of lack of adequate and reliable data, this limitation being a characteristic of the traditional energy sector. Furthermore, the presence of micro factors (like household income, scarcity of fuelwood supply, availability of alternative fuels, etc.) indicates that the future role of wood energy would vary from one area to another depending on the behavior of these micro factors over time. Thus, making rash generalizations, at the aggregate level, could be very dangerous. Nevertheless, a qualitative assessment of the influence of these factors on future wood energy use is still possible if it is done to create images of the future role of wood energy. In other words, scenarios on the future role of wood energy can be developed based on the evolution of these factors.
There could be a long list of "alternative futures" with respect to the future role of wood energy, each one making assumptions on one or more variables influencing wood energy demand. This study, however, limits its analysis to three scenarios that represent in very broad terms the three general directions in which future wood energy consumption could go:
The first is a "do nothing" or business-as-usual (BAU) scenario that excludes any policy intervention either to increase fuelwood supply or to reduce or increase (influence) fuelwood demand. In this scenario future growth in woodfuel consumption would be determined by its past and present rate of growth, the extent of which would vary from country to country depending on economic performance and population growth. In other words, elasticities that measure the responsiveness of fuelwood consumption to economic and population growth could be calculated for each country. This scenario requires making assumptions on future economic and population growth or could use existing baseline projections of these two macro variables. The difficulty, however, with this procedure is that there is no real time series data on fuelwood consumption currently available. FAO has historical data on fuelwood consumption (see Part B), but these are based for the most part on estimates and considers only fuelwood coming from forests (that is, excluding fuelwood coming from non-forest lands which could be significant in many countries). Moreover, the combined effect of economic and population growth and urbanization rate on fuelwood consumption should be taken into account. Increased income has the tendency to dampen fuelwood demand because of increased preference for modern fuels. This is indicated in data presented in Part B which shows decreasing share of fuelwood in total energy consumption. This would be especially true in urban and peri-urban areas and other areas which have access to modern fuels. The impact of increased income on fuelwood consumption in rural areas may not be significant in terms of decrease in relative fuelwood consumption, but could be significant in terms of increase in absolute fuelwood consumption. In rural areas, affordability of energy sources is not the only issue that explains why in rural areas more people are collecting than buying fuelwood. But, in many cases perhaps, accessibility is the more important determining factor for the composition of the household energy mix. Thus, with increased income and poor accessibility to modern energy sources, people in rural areas will tend to increase their energy consumption by using more of purchased fuelwood. In any case, fuelwood would continue to increase in absolute terms because of population growth, especially if there is no significant improvement in income distribution (as more poor people will be relying on fuelwood).
The above analysis ignores the pressure created by increased fuelwood demand on fuelwood supply sources, in particular forest resources. The situation would definitely vary from one country to another and from one area to another within a particular country. For example, the Philippine Household Energy Strategy Study (HESS) concludes that biomass resources in the country are being used at a rate that should not be a cause of concern for a long time to come (UNDP-ESMAP, 1992). However, the study points to some provinces that could already be feeling the pressure of increased fuelwood demand. The situation is the opposite in India and Pakistan. India has, in fact, already banned fuelwood collection from forests (Natarajan, 1995). In Pakistan, the government had to encourage farmers to plant trees on their farmlands to sustain the supply of fuelwood (Hosier, 1993). Thus, whether this scenario would be sustainable depends on the current levels of productivity and stock of biomass resources in each country. In the long run, however, this scenario would not be sustainable because nothing is done (i) to enhance forest resources which tend to deteriorate with time because of pressures other than fuelwood demand (in particular, land use patterns changes); (ii) nor to improve efficiency of energy use and thus contribute to conservation of fuelwood supply resources.
The second and third scenarios represent probably the extremes. The second, called the "green" energy (GREEN) scenario, assumes future fuelwood consumption that is higher than what will be projected in the business-as-usual case. This implies increasing fuelwood consumption that is a result not only of growing population but also of some deliberate attempt to promote fuelwood use because of its positive environmental implications. Though fuelwood combustion actually contributes to global warming, this is offset by forests and trees, from where fuelwood is sourced, that serve as carbon sink, making fuelwood combustion carbon neutral. This scenario makes a rather "heroic" assumption about the behavior of energy consumer. In general, consumers that can choose from an available mix of fuels would prefer modern commercial fuels because these are more convenient to use, more accessible, and cleaner in terms of contribution to indoor air pollution. Over time, access to modern fuels will have improved and consumers will have improved their capacity to buy these fuels. The green energy scenario, therefore, requires an effort to counter this strong tendency from energy consumers.
On the other hand, the GREEN scenario could also mean increased fuelwood consumption in the form of wood residues in wood-based industries (e.g. sawmills, plymills, pulp and paper industry). Wood residues can substitute fossil fuels as feedstock to boilers through cogeneration systems. According to the EC-ASEAN COGEN Programme, sawmills and plymills, for example, which are the largest wood-based industries in terms of wood consumption, generate 45-55% of raw materials input as wood wastes. Moreover, it is estimated that the wood-based industry in south-east Asia alone generates about 19 million tonnes of residues annually, which can run 1,000 MW of electrical generating capacity (Menu, 1997). Most of this potential (765 MW) are in Indonesia and Malaysia. However, the use of wood residues to generate electricity in this industry depends first of all on the market for wood-based products. A high demand, obviously, means increased opportunities to realize this potential. Furthermore, governments’ policy to promote renewable energy sources coupled with attractive incentives to private power investors to go into renewable energy generation will be an important condition for increased reliance on wood residues.
The GREEN scenario also makes an inherent assumption about availability of and accessibility to fuelwood supply. In effect, it assumes that fuelwood supply will be made sustainable through improved forest management (and fuelwood collection) practices and increased fuelwood output from non-forest lands, thus addressing simultaneously the problems associated with fuelwood collection (e.g. spending too much time in fuelwood collection and collecting from distant sources).
The second scenario should also address the issue of improving efficiency of energy use. In this case, an aggressive effort to promote, for example, improved cookstoves would be launched by governments. Some authors refer to this as an important transition between using lower quality fuels (like fuelwood) to using higher quality modern fuels (see for example Barnes et al., 1994). The introduction of improved biomass stoves represents an important step in the energy ladder in situations where an actual shift to modern from traditional fuels is not yet possible because of questions of availability of the end-use equipment and fuels as well as their affordability.
This second scenario, obviously, will have positive implications in promoting sustainable woodfuel demand and enhancing the sustainability of supply of biomass resources. The actual impact in each situation would depend on adhering to "key success factors" in planning and implementing improved cookstoves programs, for example. Barnes et al. (1994) have identified these factors based on a survey of 137 international cookstoves programs and four in depth case studies. The experience of China, which has the largest improved cookstoves program worldwide is particularly enlightening.
The third or "massive" fossil fuel promotion (FOSSIL) scenario represents the other extreme. In this case, a deliberate attempt is made to switch to modern fuels and to reduce the use of traditional fuels. In principle, however, such an attempt may not be necessary because of the natural tendency of energy consumers to switch to modern fuels when they are able to do so. However, this is not always the case. Pacudan (1997) shows that there are barriers to the use of energy efficient technologies and modern fuels. The case of Sri Lanka is illustrated in which demand for biomass fuels in urban areas remained stable despite the increase in income because of the availability of "free" biomass fuels. In addition, the case of rural Pakistan is cited in which the non-occurrence of the transition to modern fuels, even if it was affordable to do so, is explained by the excess labor of women. Yet, in any case, in order for this scenario to happen, fuel switching policy that intends to promote the use of modern fuels should address first the issues of affordability and availability.
Fuelwood consumption projections will be made based on these three scenarios and using FAO’s database for total fuelwood consumption. FAO’s database was preferred over those of the UN and AIT because it covers all countries, except Maldives, with a higher degree of consistency than both UN’s and AIT’s. Using FAO’s database also facilitates making regional overview and cross-country comparisons because they are available for almost all countries under study. However, it should be noted that these estimates refer only to fuelwood supply from forest lands. But because the concern is the implications of future wood energy use to the forestry sector, the exercise will still be useful even if in many countries a big share of fuelwood supply comes probably from non-forest lands.
The BAU scenario assumes no policy intervention to increase fuelwood supply nor to influence fuelwood demand through energy efficiency or conservation or fuel switching policy. It is assumed the fuelwood consumption is determined mainly by expected population and economic growth, the basic demand determinants. As mentioned, however, the impacts of these two variables in fuelwood consumption tend to be in opposite directions. Specifically, economic growth has a restraining effect on fuelwood consumption because of strong tendency to shift to modern or high quality fuels with increased income, while population growth will raise fuelwood consumption in absolute terms, especially in developing countries. In practice, however, it maybe difficult to model the combined effects of these two variables. It could be shown, on the other hand, that population growth is strongly positively correlated with fuelwood consumption. Thus, it will be assumed arbitrarily that the net effect of the two variables can be represented by the historical average growth rates of fuelwood consumption. In all of the countries, this is positive indicating the strong effect of population growth. In fact, in all of the scenarios, the effect of population growth will be assumed to persist. That is, in all scenarios, fuelwood consumption will increase in absolute terms as a result of population growth. The level of economic development of the countries being studied, both now and in near future, has not come to a point that an absolute decline in fuelwood consumption is realizable. What is more likely is a gradual shift from the use of traditional fuels. Thus, over time, the projected growth in fuelwood consumption may be allowed to decrease to take into account the effect of income and the availability of and accessibility to modern fuels.
In this study, the average growth rate of fuelwood consumption for the period 1980-1994 would be used to project it through 2010. As mentioned, the growth rates maybe allowed to decline depending on projected growth in income (GDP), particularly in the period 2005-2010 when, presumably, access to modern fuels would have improved significantly compared to previous periods. The decline would be minimal for countries with lower projected GDP growth rate and would be slightly higher for those with higher projected GDP growth rate. Yet for simplicity, the study will stick to one case using a constant average growth rate to project fuelwood consumption for the period through 2010 (see Table 4.7).
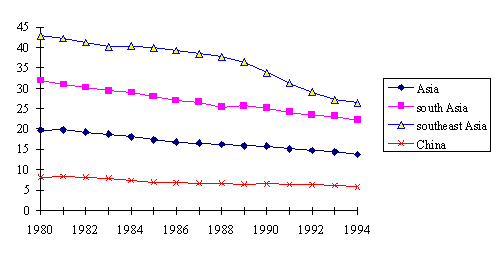
Projected fuelwood consumption for the GREEN and FOSSIL scenarios will be based on assumptions on the future contributions of wood energy in the total energy mix. These assumptions, in turn, are based on based on past trend. To calculate historical shares of fuelwood consumption to total energy consumption, data on total energy consumption will come from UN database, while fuelwood consumption will still come from the FAO database. Figure 4.15 shows that, in general, the shares are decreasing for all countries in the region, indicating that total energy consumption is normally growing faster than fuelwood consumption and that a gradual shift to alternative fuels is happening.
Figure 4.15:
Share of Fuelwood in Total Energy Consumption, 1980-1994 (%)

Table 4.5 shows the assumed fuelwood contributions in the total energy mix for the years 2000, 2005, and 2010 for the two scenarios. These figures are not arbitrarily chosen. They were set taking into account historical performance, of course, but also taking into consideration the individual energy and economic profile of the countries. For example, for Cambodia where fuelwood already accounts for 90% of total energy consumption, future fuelwood contributions have been maintained at current proportion because it is not reasonable to expect that this share will go up in the future even if a strong effort is exerted to promote fuelwood consumption. Moreover, it maybe said that the green energy scenario should at least maintain current contribution of fuelwood.
Assumptions have to be made also on the total energy consumption for the period through 2010 before the projected fuelwood consumption is derived for this period. These figures are calculated using the annual average growth of total energy consumption in 1980-1994 and assuming that these growth rates will persist throughout the projection period. The calculated growth rates and projected total energy consumption are shown in Table 4.6.
Table 4.5: Basic Assumptions for the Three Scenarios
Countries |
Percent Share of Fuelwood to Total Energy |
BAU |
GREEN |
FOSSIL |
||||
1994 |
1995-2010 |
2000 |
2005 |
2010 |
2000 |
2005 |
2010 |
|
Bangladesh |
47 |
2.09 |
49 |
52 |
55 |
40 |
35 |
30 |
Bhutan |
87 |
1.87 |
90 |
90 |
90 |
80 |
75 |
70 |
India |
20 |
2.07 |
25 |
28 |
32 |
18 |
15 |
12 |
Nepal |
77 |
2.61 |
70 |
70 |
70 |
60 |
55 |
50 |
Pakistan |
16 |
3.62 |
20 |
23 |
25 |
12 |
10 |
8 |
Sri Lanka |
48 |
1.47 |
50 |
53 |
55 |
45 |
40 |
35 |
Cambodia |
90 |
3.22 |
90 |
90 |
90 |
85 |
80 |
75 |
Indonesia |
35 |
1.8 |
38 |
40 |
42 |
30 |
25 |
20 |
Laos |
89 |
2.84 |
90 |
90 |
90 |
80 |
75 |
72 |
Malaysia |
7 |
2.66 |
10 |
12 |
15 |
5 |
4 |
4 |
Myanmar |
63 |
2.34 |
70 |
70 |
70 |
60 |
55 |
45 |
Philippines |
28 |
2.30 |
30 |
32 |
35 |
25 |
22 |
20 |
Thailand |
13 |
1.65 |
15 |
18 |
20 |
10 |
8 |
6 |
Vietnam |
45 |
3.14 |
47 |
49 |
50 |
45 |
40 |
35 |
China |
6 |
2.00 |
10 |
12 |
15 |
5 |
4 |
3 |
Table 4.6: Projected Total Energy Consumption (PJ)
1980-1994 |
1994 |
2000 |
2005 |
2010 |
|
| Asia | 4.78 |
60,586 |
79,545 |
99,850 |
125,491 |
| South Asia | 5.73 |
15,745 |
21,172 |
27,013 |
34,472 |
| Bangladesh | 5.08 |
642 |
950 |
1,217 |
1,560 |
| Bhutan | 1.60 |
15 |
16 |
18 |
19 |
| India | 5.00 |
13,002 |
17,425 |
22,241 |
28,388 |
| Maldives | n.a. |
0 |
0 |
0 |
|
| Nepal | 4.53 |
250 |
326 |
407 |
508 |
| Pakistan | 5.20 |
1,655 |
2,244 |
2,892 |
3,726 |
| Sri Lanka | 2.53 |
181 |
210 |
238 |
270 |
| Southeast Asia | 5.69 |
10,700 |
13,957 |
17,534 |
22,161 |
| Cambodia | 2.68 |
71 |
83 |
95 |
108 |
| Indonesia | 3.72 |
4,167 |
5,188 |
6,228 |
7,477 |
| Laos | 1.49 |
48 |
52 |
56 |
61 |
| Malaysia | 5.65 |
1,418 |
1,972 |
2,596 |
3,418 |
| Myanmar | 2.19 |
311 |
354 |
395 |
440 |
| Philipiines | 2.72 |
1,224 |
1,438 |
1,644 |
1,879 |
| Thailand | 6.66 |
2,821 |
4,154 |
5,734 |
7,917 |
| Vietnam | 1.87 |
640 |
715 |
785 |
861 |
| China | 4.68 |
34,141 |
44,415 |
55,303 |
68,859 |
Given the assumed future contributions of fuelwood to total energy consumption and projected values for the latter, fuelwood consumption for 2000, 2005, and 2010 can be calculated.
Scenarios should be internally consistent. Initial results, therefore, were checked for consistency. Given the projected total energy consumption, the share of fuelwood in the BAU scenario was calculated to provide the check. It should be between the shares assumed for the GREEN and FOSSIL scenarios. Needless to say, it should not be more than 100% (that is, fuelwood consumption could not exceed projected total energy consumption). This implies that the assumed growth rates used in projecting fuelwood consumption in the BAU scenario should be consistent with the projected total energy consumption.
Inconsistencies were noted for five countries� Bhutan, Cambodia, Laos, Thailand, and Vietnam. For Laos, the assumed fuelwood consumption growth rate had resulted in a value that exceeded projected total energy consumption. Obviously, this is unacceptable, so the assumed growth rate was reduced. In the case of Thailand, the calculated growth rate had given fuelwood consumption values in the BAU scenario that were lower than those under the FOSSIL scenario. The growth rate was, therefore, raised to increase projected fuelwood consumption. For the other three countries, the assumed fuelwood consumption growth rates had resulted in values that exceeded those calculated for the GREEN scenario. So the assumed growth rates were adjusted until the criterion was met. Otherwise, it would not be necessary to promote fuelwood to increase its usage at the level expected for the GREEN scenario. Table 4.7 compares the adjusted and initial fuelwood consumption growth rates for these five countries.
Table 4.7: Adjusted Fuelwood Consumption Growth Rates in the BAU Scenario
Countries |
Calculated growth rates (%) |
Adjusted growth rates (%) |
Bhutan |
1.87 |
1.50 |
Cambodia |
3.22 |
2.00 |
Laos |
2.84 |
1.50 |
Thailand |
1.65 |
2.70 |
Vietnam |
3.14 |
2.00 |
Figures 4.16 to 4.19 summarize the results for the three scenarios, according to subregions, after these adjustments were made. (Detailed results are shown in Appendix 2.) What is immediately noticeable in these figures is the tremendous increase in fuelwood consumption in GREEN scenario. In that scenario, fuelwood consumption in Asia is projected to jump from 8,304 PJ in 1994 to more than 28,000 PJ in 2010, or at an annual average rate of 8% per annum. In contrast, fuelwood consumption in the FOSSIL scenario will increase barely 1% per annum, to 9,708 PJ in 2010. In the BAU scenario, fuelwood consumption will grow on average by 2.1% per annum, to about 11,600 PJ in 2010.
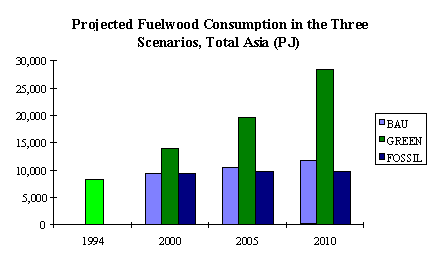
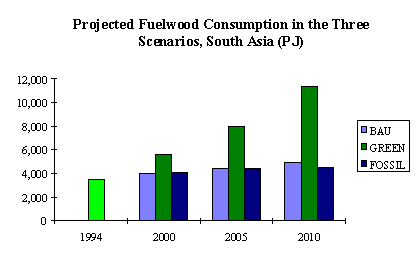
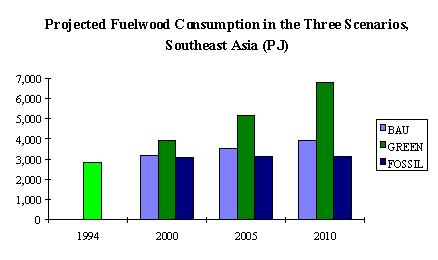
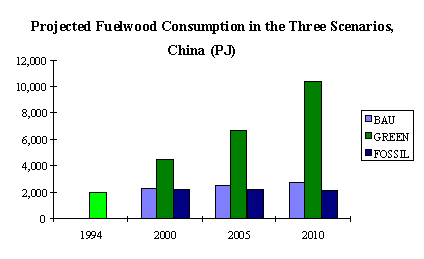
The GREEN scenario is a "big" departure from the BAU scenario because the former attempts to reverse current trends of decreasing relative importance of fuelwood consumption in the total energy mix. The GREEN scenario is probably very unlikely from this point of view, and the projected fuelwood consumption would really represent an extreme case. However, from the point of view of policy, in particular, one that intends to promote the use of wood energy because of benefits to the environment, the GREEN scenario reflects the fact that this policy should really be very strong in order to be effective.
On the other hand, the "slight" departure of the FOSSIL scenario from the BAU scenario implies that the demand for wood energy would still be driven primarily, on the macro level, by population and income. Efforts that intend to encourage modern energy sources (derived from fossil fuels) should first address the issue of availability and affordability before they can be successful.
These projections were also compared with those of FAO (Global Forest Products Outlook 1994-2010) and RWEDP (Koopmans, 1997) as a further check for validity of results. These two other studies cover Asia-pacific countries, including RWEDP member countries. However, they include only one scenario that is comparable to the BAU scenario in the present study. In general, as shown in Figures 4.20-4.23, the RWEDP study gives the highest projections, while FAO, the lowest. The BAU projections, therefore, lie between these two other projections. (See also Appendix 3.) For example, FAO and RWEDP project that by 2010 total fuelwood consumption in Southeast Asia would reach 3,371 and 4,185 PJ, respectively. BAU places this figure at 3,867 PJ.
In addition, it can be observed that towards the end of the projection period the difference between BAU’s and FAO’s projections tends to become bigger, while the difference becomes smaller between BAU’s and RWEDP’s projections through 2010. For example, for all countries in 2010, BAU overshoots FAO by 1,661 PJ, while the difference between BAU and RWEDP is only almost half as much, or 864 PJ.
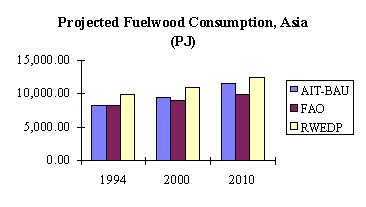
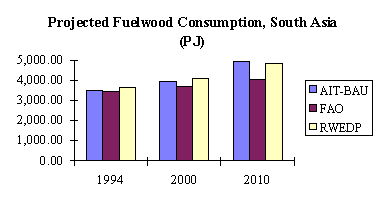
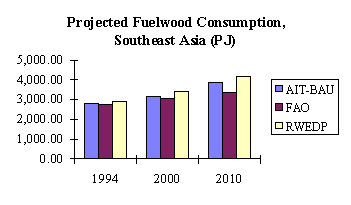
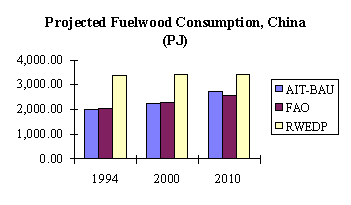
Obviously, there are exceptions to these two general trends. Figure 4.21 shows that in 2010 BAU’s is slightly in excess (85 PJ) of RWEDP’s projection, primarily because of India and Bangladesh. It is also shown in Appendix 3 that RWEDP, in fact, gives the lowest projection for Indonesia all throughout the projection period. In Figure 4.23, while the difference between RWEDP’s and BAU’s projections decreases, it is still in the order of 700 PJ in 2010. Moreover, the difference is increasing for Thailand, reaching 1006 PJ in 2010.
In any case, except for these countries, the three studies—FAO, RWEDP, and AIT—give very close approximations of future fuelwood consumption. In most cases, as shown in Table 4.8, the differences do not go beyond 5 Mm3.
Table 4.8: Differences Between Fuelwood Consumption Projections
AIT-BAU vs. FAO (PJ) |
RWEDP vs. AIT-BAU (PJ) |
|||||
1994 |
2000 |
2010 |
1994 |
2000 |
2010 |
|
Asia Total |
71.98 |
427.74 |
1,661.20 |
1,584.30 |
1,472.68 |
863.69 |
South Asia1 |
51.35 |
296.78 |
922.47 |
158.01 |
138.59 |
-84.67 |
Bangladesh |
-7.30 |
14.75 |
65.77 |
-154.35 |
-141.03 |
-107.60 |
Bhutan |
13.02 |
14.24 |
16.52 |
-0.42 |
-0.49 |
-2.77 |
India |
62.53 |
219.11 |
625.21 |
40.50 |
68.18 |
-32.03 |
Maldives |
0.01 |
0.00 |
0.00 |
-0.01 |
0.00 |
0.00 |
Nepal |
-2.78 |
16.18 |
63.85 |
4.51 |
7.41 |
-4.01 |
Pakistan |
0.69 |
47.31 |
162.44 |
265.95 |
202.20 |
60.44 |
Sri Lanka |
-1.80 |
-0.56 |
5.21 |
1.41 |
1.82 |
-1.48 |
South East Asia2 |
15.19 |
100.95 |
495.74 |
101.57 |
236.68 |
318.59 |
Cambodia |
-1.25 |
0.81 |
8.99 |
19.40 |
-3.88 |
-33.41 |
Indonesia |
-27.10 |
-27.34 |
117.17 |
-605.17 |
-666.49 |
-873.60 |
Laos |
6.94 |
7.98 |
11.49 |
-42.77 |
-46.76 |
-54.27 |
Malaysia |
24.20 |
32.60 |
55.76 |
2.54 |
2.20 |
-9.68 |
Myanmar |
1.25 |
12.98 |
49.27 |
160.18 |
138.78 |
89.59 |
Philippines |
-4.87 |
24.99 |
92.38 |
7.80 |
12.14 |
11.20 |
Thailand |
30.07 |
59.43 |
143.66 |
355.50 |
595.46 |
1,006.22 |
Vietnam |
-7.10 |
-2.52 |
28.51 |
161.31 |
158.47 |
128.27 |
China |
-50.34 |
-30.99 |
172.20 |
1,380.50 |
1,158.41 |
700.56 |
1 Excluding Bhutan
2 Excluding Laos
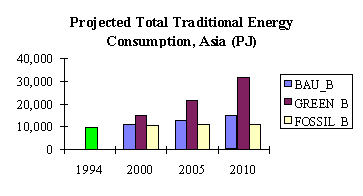
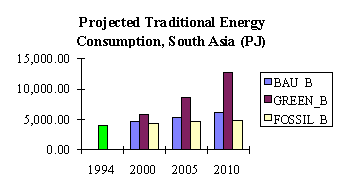
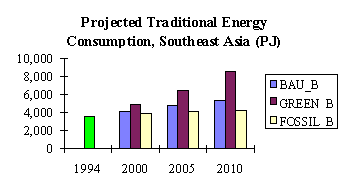
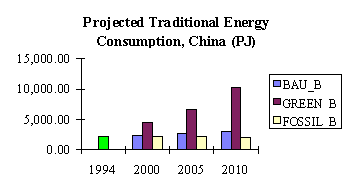
Total traditional energy consumption was also projected under the same three scenarios following the same methodology and using data from UN database (see Figures 4.24-27). Detailed results are shown in Appendix 4.
