![]()
![]()
![]()
Industrial roundwood, as defined in FAO Forest Products Yearbook, includes all industrial wood in the rough (sawlogs and veneer logs, pulpwood and other industrial roundwood) and, in the case of trade, chips and particles and wood residues.
As a consequence of moderate growth in population and rapid growth in the economy, consumption of industrial roundwood in the Asia-Pacific region has shown sustained increases, as shown in Table 16. The total consumption in the region was 320 million m3 in 1992, about one-fourth of the world's total, many countries showed steady and strong growth, while some countries had slightly declining trends.
Table 16. Consumption of industrial roundwood, in thousand m3, 1962-1992.
|
Country |
1962 |
1972 |
1982 |
1992 |
|
Australia |
10146 |
10618 |
9213 |
10147 |
|
Bangladesh |
654 |
571 |
1009 |
907 |
|
Bhutan |
0 |
238 |
271 |
278 |
|
Cambodia |
437 |
484 |
567 |
650 |
|
China |
30901 |
48358 |
86985 |
98531 |
|
Fiji |
64 |
113 |
218 |
43 |
|
French Polynesia |
0 |
0 |
1 |
1 |
|
Hong Kong |
448 |
314 |
561 |
390 |
|
India |
7148 |
13921 |
21285 |
25306 |
|
Indonesia |
5536 |
5540 |
21997 |
38876 |
|
Japan |
54839 |
91784 |
74243 |
75086 |
|
Korea Dem People's Rep |
600 |
602 |
671 |
496 |
|
Korea Rep |
1842 |
6286 |
8033 |
12123 |
|
Laos |
83 |
164 |
207 |
182 |
|
Macau |
29 |
0 |
21 |
0 |
|
Malaysia |
4123 |
9699 |
13976 |
26896 |
|
Myanmar |
2001 |
2445 |
3627 |
2949 |
|
Nepal |
559 |
434 |
434 |
620 |
|
New Caledonia |
10 |
18 |
13 |
7 |
|
New Zealand |
4467 |
6204 |
8899 |
10029 |
|
Pakistan |
544 |
552 |
863 |
2294 |
|
Papua New Guinea |
152 |
461 |
1011 |
646 |
|
Philippines |
3543 |
5434 |
5471 |
4159 |
|
Samoa |
1 |
56 |
61 |
62 |
|
Singapore |
0 |
1404 |
481 |
-99 |
|
Solomon Islands |
10 |
5 |
92 |
-184 |
|
Sri Lanka |
599 |
497 |
668 |
664 |
|
Thailand |
3031 |
5434 |
4188 |
4505 |
|
Tonga |
0 |
0 |
8 |
5 |
|
Vanuatu |
0 |
12 |
4 |
39 |
|
Viet Nam |
1784 |
2145 |
3545 |
4411 |
|
Asia Pacific |
133551 |
213793 |
268623 |
320019 |
|
World |
1037677 |
1293439 |
1378260 |
1600470 |
|
Share |
13% |
17% |
19% |
20% |
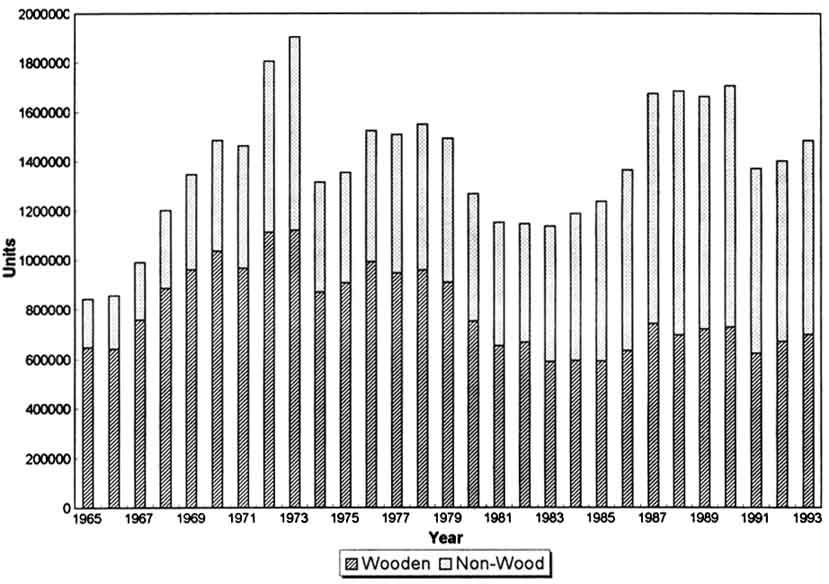
The largest consumers within the region are China with about 99 million m3, Japan with 75, Indonesia with 39, Malaysia with 27, and India with 25 million m3. Japan's consumption peaked in 1973 at nearly 100 million m and appeared to level off since 1980. This trend has paralleled that of the Japanese housing construction, which responded strongly to economic growth. Housing is the single largest end-use market for coniferous roundwood/sawnwood in Japan. Figure 5 displays the Japanese housing starts using wooden and non-wood materials. Housing starts also peaked at nearly 2 million units in 1973. Of the total, about 58% were wooden units and 42% were non-wood. Roundwood consumption has been stable since 1980, because of the rise in housing of non-wood materials which surpassed wooden housing starts in 1985.
Figure 5. Japanese housing starts by construction type, 1965-1993.
Domestic consumption of industrial roundwood increased sharply for Indonesia in 1980 and for Malaysia in 1988, mainly because of the bans on log exports to stimulate domestic processing. By 1992, domestic consumption took nearly all production in Indonesia, and 60% in Malaysia.
Table 17 reports the production of industrial roundwood by country and territory from 1962 to 1992. The total production of the region was 288 mm3 in 1992, accounting for only 18% of the world's total. The largest producers were China with 93 million m, Malaysia with 45, Indonesia with 39, Japan with 28, and India with 25 million m3. Of these countries, Indonesia and Malaysia registered the highest growth in production, while Japan's production has gradually declined since the 1970s. Viet Nam's production grew fast since the end of the Viet Nam war in 1975, and peaked at 5.4 million m3 in 1987. Oceania countries, led by Australia and New Zealand, also saw significant increases in production in the 1980s. In contrast to other countries, Philippines' production of industrial roundwood has steadily declined from 13 million m3 in 1968 to 3.6 million m3 in 1992. The reduction was due mainly to the serious depletion of forests. Between 1962 and 1992, the forest land area in the Philippines decreased by about 40% from 17 million hectares in 1962 to 10 million hectares in 1992.
Table 17. Production of industrial roundwood, in thousand m3, 1962-1992.
|
Country |
1962 |
1972 |
1982 |
1992 |
|
Australia |
10061 |
11362 |
14872 |
16552 |
|
Bangladesh |
654 |
571 |
1009 |
893 |
|
Bhutan |
|
|
|
|
|
Cambodia |
520 |
490 |
567 |
1135 |
|
China |
30364 |
44347 |
78092 |
92792 |
|
Fiji |
64 |
113 |
220 |
270 |
|
French Polynesia |
0 |
0 |
1 |
1 |
|
Hong Kong |
463 |
342 |
568 |
488 |
|
India |
7162 |
13944 |
21272 |
24570 |
|
Indonesia |
5653 |
18920 |
25521 |
39351 |
|
Japan |
44483 |
43114 |
32239 |
27736 |
|
Korea Dem People's Rep |
600 |
600 |
600 |
600 |
|
Korea Rep |
1233 |
2119 |
2362 |
1994 |
|
Laos |
83 |
167 |
214 |
265 |
|
Macau |
|
|
|
|
|
Malaysia |
7187 |
21794 |
33908 |
44851 |
|
Myanmar |
2099 |
2556 |
3832 |
4101 |
|
Nepal |
610 |
560 |
560 |
620 |
|
New Caledonia |
10 |
18 |
12 |
6 |
|
New Zealand |
4724 |
8272 |
9957 |
14992 |
|
Pakistan |
529 |
475 |
833 |
2188 |
|
Papua New Guinea |
157 |
870 |
2223 |
2655 |
|
Philippines |
8337 |
12291 |
7110 |
3614 |
|
Samoa |
1 |
56 |
61 |
61 |
|
Singapore |
|
|
|
|
|
Solomon Islands |
10 |
243 |
425 |
330 |
|
Sri Lanka |
596 |
497 |
668 |
664 |
|
Thailand |
3039 |
5497 |
4045 |
2736 |
|
Tonga |
0 |
0 |
8 |
5 |
|
Vanuatu |
0 |
12 |
9 |
39 |
|
Viet Nam |
1782 |
2123 |
3504 |
4460 |
|
Asia Pacific |
130421 |
191353 |
244692 |
287969 |
|
World |
1036778 |
1292087 |
1375818 |
1603376 |
|
Share |
13% |
15% |
18% |
18% |
The Asia-Pacific region's imports of industrial roundwood are shown in Table 18. Total imports were 68 million m3 in 1992, over 60% of the world's total imports. The imports expanded very fast until the late 1970s and peaked at 80 million m3 in 1979 when Indonesia and Malaysia imposed the bans on log exports. The largest importers in the region have been Japan with 47 million m3 in 1992, the Republic of Korea with 10 million m3, and China with 6 million m3. Japan is also the world's leading importer of industrial roundwood. Japan's growing fibre deficit is well known. Its industrial roundwood imports accounted for more than 63% of domestic consumption in 1992, compared with 20% in 1962, 53% in 1972 and 57% in 1982.
Like Japan, the Republic of Korea has been very dependent on foreign imports of industrial roundwood, mostly from Malaysia, Indonesia and Philippines. Its imports increased from less than one million m3 in 1962 to nearly 10 million m3 in 1978. In 1980, Korea's imports suddenly dropped by one-third, to 6 million m3, mainly because Indonesia restricted its log exports. Since then, Malaysia and Papua New Guinea have strengthened their position. However, a general trend has been for less imports of tropical hardwood and more imports of softwood from the United States. Since 1990, Korea's imports of industrial roundwood showed a strong growth, and reached 10 million m again in 1992. In 1982 imports made up about 71% of Korea's total industrial roundwood consumption, a share that increased to 84% by 1992.
Table 18. Imports of industrial roundwood, in thousand m3, 1962-1992.
|
Country |
1962 |
1972 |
1982 |
1992 |
|
Australia |
108 |
98 |
1 |
7 |
|
Bangladesh |
0 |
0 |
0 |
14 |
|
Bhutan |
|
|
|
|
|
Cambodia |
83 |
6 |
0 |
485 |
|
China |
571 |
4105 |
8957 |
6442 |
|
Fiji |
0 |
0 |
0 |
0 |
|
French Polynesia |
0 |
0 |
1 |
1 |
|
Hong Kong |
463 |
342 |
568 |
488 |
|
India |
12 |
1 |
20 |
739 |
|
Indonesia |
0 |
0 |
0 |
78 |
|
Japan |
10374 |
48683 |
42034 |
47380 |
|
Korea Dem People's Rep |
0 |
2 |
71 |
0 |
|
Korea Rep |
609 |
4167 |
5671 |
10135 |
|
Laos |
|
|
|
|
|
Macau |
29 |
0 |
21 |
0 |
|
Malaysia |
106 |
265 |
20 |
10 |
|
Myanmar |
0 |
0 |
0 |
0 |
|
Nepal |
|
|
|
|
|
New Caledonia |
0 |
0 |
1 |
1 |
|
New Zealand |
12 |
9 |
8 |
11 |
|
Pakistan |
15 |
77 |
30 |
106 |
|
Papua New Guinea |
|
|
|
|
|
Philippines |
0 |
1 |
6 |
550 |
|
Samoa |
0 |
0 |
0 |
1 |
|
Singapore |
0 |
1406 |
528 |
70 |
|
Solomon Islands |
|
|
|
|
|
Sri Lanka |
3 |
0 |
0 |
0 |
|
Thailand |
1 |
13 |
149 |
1794 |
|
Tonga |
|
|
|
|
|
Vanuatu |
|
|
|
|
|
Viet Nam |
2 |
22 |
41 |
0 |
|
Asia Pacific |
12388 |
59197 |
58127 |
68312 |
|
World |
39458 |
95957 |
99434 |
114044 |
|
Share |
31% |
62% |
59% |
60% |
Fuelled by its economic reforms, China's imports nearly doubled between 1978 and 1988, from 8 to 14 million m3. Since 1989, however, China's imports declined, reflecting new political and economic conditions. Unlike Japan and the Republic of Korea, historically, China had been self-sufficient for industrial roundwood, and imports accounted for less than 2% of its total consumption in 1962. The share had increased to 10% in 1982, but came down to less than 7% in 1992.
As shown in Table 19, the Asia-Pacific region exported 35 million m3 of industrial roundwood in 1992, about 30% of the world's total. Exports had increased during the 1960s and 1970s until Indonesia restricted log exports in 1980 and Malaysia in 1985. In the 1980s, Malaysia had surpassed Indonesia to become the world's leading exporter of industrial roundwood, with 18 million m in 1992. Other major exporters in the region include Australia with 6 million m, and New Zealand with 5 million m3. Papua New Guinea and Myanmar also became important suppliers of industrial roundwood. Philippines' exports had, however, declined significantly since the 1980s, and the country became a net importer in 1989. For Malaysia, New Zealand, Papua New Guinea and Myanmar, exports were mostly logs, while for Australia, almost all of exports were chips, particles and wood residues.
Table 19. Exports of industrial roundwood, in thousand m3, 1962-1992
|
Country |
1962 |
1972 |
1982 |
1992 |
|
Australia |
23 |
842 |
5660 |
6412 |
|
Bangladesh |
|
|
|
|
|
Bhutan |
0 |
0 |
7 |
0 |
|
Cambodia |
|
|
|
|
|
China |
34 |
94 |
64 |
703 |
|
Fiji |
0 |
0 |
2 |
280 |
|
French Polynesia |
|
|
|
|
|
Hong Kong |
15 |
28 |
7 |
98 |
|
India |
26 |
24 |
7 |
3. |
|
Indonesia |
117 |
13380 |
3524 |
553 |
|
Japan |
18 |
13 |
30 |
30 |
|
Korea Dem People's Rep |
0 |
0 |
0 |
104 |
|
Korea Rep |
0 |
0 |
0 |
6 |
|
Laos |
0 |
3 |
7 |
83 |
|
Macau |
0 |
0 |
0 |
0 |
|
Malaysia |
3170 |
12360 |
19952 |
17965 |
|
Myanmar |
98 |
111 |
205 |
1152 |
|
Nepal |
51 |
126 |
126 |
0 |
|
New Caledonia |
|
|
|
|
|
New Zealand |
269 |
2077 |
1066 |
4974 |
|
Pakistan |
|
|
|
|
|
Papua New Guinea |
5 |
409 |
1212 |
2009 |
|
Philippines |
4794 |
6858 |
1645 |
5 |
|
Samoa |
|
|
|
|
|
Singapore |
0 |
2 |
47 |
169 |
|
Solomon Islands |
0 |
238 |
333 |
514 |
|
Sri Lanka |
0 |
0 |
0 |
0 |
|
Thailand |
9 |
76 |
6 |
25 |
|
Tonga |
0 |
0 |
0 |
0 |
|
Vanuatu |
0 |
0 |
5 |
0 |
|
Viet Nam |
0 |
0 |
0 |
49 |
|
Asia Pacific |
8629 |
36641 |
33905 |
35134 |
|
World |
38559 |
94605 |
96992 |
116950 |
|
Share |
22% |
39% |
35% |
30% |
Table 20 shows the direction of trade in industrial roundwood (wood in the rough) within the Asia-Pacific and with other regions in 1992. The region's total imports of industrial roundwood (wood in the rough) were 44 million m3, and more than 51% of it came from other regions of the world. The Asia-Pacific exports went mostly to countries in the same region, primarily to Japan. Exports to other regions were insignificant, accounting for less than 1 % of the total. The top three importers of wood in the rough in 1992 were Japan with 25 million m3, the Republic of Korea with 10 million m3 and China with 5. The major suppliers to the region were the United States with 13 million m3, Russia with 5 million m3, Chile and Canada with 1 million m3 and the European Union with 27,000m3. The total imports from these countries represented more than 90 % of all imports from outside the Asia-Pacific region.
Table 20. Direction of trade in industrial roundwood (wood in the rough), in thousand m3, 1992.
Of the region's total imports of wood in the rough, coniferous and non-coniferous species constituted 55% and 45%, respectively. Tables 21 to 23 summarize the direction of trade in coniferous and non-coniferous industrial roundwood in 1992. New Zealand was the only substantial exporter of coniferous industrial roundwood in the region, with 4.6 million m exported mainly to Japan, the Republic of Korea and China, more than 80% of the imports were from outside the region.
Table 21. Direction of trade in industrial roundwood (coniferous), in thousand m3, 1992.
|
Exporters |
New Zealand |
Asia Pacific |
USA |
Russia |
Chile |
Canada |
EU |
Other |
Total |
|
Japan |
1863 |
1863 |
8451 |
3619 |
162 |
742 |
1 |
253 |
15091 |
|
Korea Rep |
2275 |
2275 |
2416 |
214 |
962 |
51 |
9 |
160 |
6087 |
|
China |
411 |
411 |
1378 |
549 |
0 |
11 |
0 |
401 |
2750 |
|
Asia-Pacific |
4549 |
4549 |
12245 |
4382 |
1124 |
804 |
10 |
814 |
23928 |
|
USA |
11 |
11 |
|
|
|
|
|
|
|
|
Other |
1 |
1 |
|
|
|
|
|
|
|
|
Total |
4561 |
4561 |
|
|
|
|
|
|
|
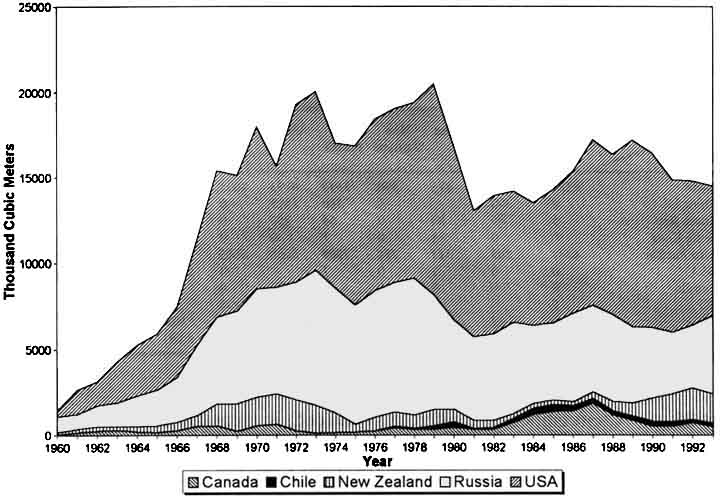
Figure 6 shows the Japanese softwood log imports from major suppliers between 1960 and 1993. The United States and Russia were the main sources, while Chile and Canada each had a small share of the region's import markets. Concomitant with rapid economic growth following World War II and lasting until the oil crisis in the early 1970s, Japan's housing starts registered substantial annual increases, as shown in Figure 5. This trend inevitably boosted Japan's imports of roundwood and sawnwood. Over this period, imports from the United States and Russia increased sharply, while imports from New Zealand and Canada also rose. During the 1970s, as its economy grew, Japan's imports remained relatively stable. However, a significant reduction in imports came at the beginning of the 1980s, triggered by a recession in Japan. By the mid 1980s, imports began to climb as the economy recovered. In the early 1990s, even though the United States remained Japan's largest procurer, the shares of Russia and New Zealand increased.
Table 23. Direction of trade in industrial roundwood (non-coniferous) from temperate countries, in thousand m3, 1992.
|
Exporters |
New Zealand |
Asia Pacific |
USA |
Russia |
EU |
Other |
Total |
|
Japan |
1 |
1 |
98 |
534 |
24 |
174 |
833 |
|
China |
205 |
205 |
378 |
9 |
2 |
64 |
658 |
|
Indonesia |
0 |
0 |
548 |
0 |
0 |
65 |
613 |
|
Korea Rep |
10 |
10 |
72 |
32 |
0 |
22 |
136 |
|
Asia-Pacific |
216 |
216 |
1096 |
575 |
26 |
327 |
2240 |
|
Other |
7 |
7 |
|
|
|
|
|
|
Total |
223 |
223 |
|
|
|
|
|
Among the non-coniferous species, tropical hardwoods dominated the markets, accounting for about 89% of the total. Virtually all of the trade of tropical hardwoods was within the region itself. Japan led the consuming countries with nearly 19 million m3, followed by the Republic of Korea with 4 million m3, and Thailand and China with 2 million m. Malaysia was the single largest exporter of tropical hardwoods with 13 million m3, or 77% of the region's total exports. Nearly all of them were headed to Asia-Pacific countries.
As for the temperate species, the within region trade was mainly between New Zealand and China, involving about 10% of the region's total imports, more than half of the region's imports were from the United States, and one-fourth from Russia.
Figure 6. Japanese softwood log imports from major suppliers (Source: Robertson and Waggener 1995).
Among the Asia-Pacific's imports of industrial roundwood in 1992, more than one-third were chips, particles and wood residues (see Table 24). These imports came mostly from countries outside the region. Japan was the major importer of chips, particles and wood residues, taking about 93% of the Asia-Pacific total imports. Indonesia was the important exporter within the region, while the United States was the largest supplier among other regions. China, however, was both importer and exporter. According to FAO's Forest Products Yearbook 1992, Australia exported 6 million m3 of industrial roundwood, mostly chips, particles and wood residues to Japan, although in the U.N.'s Timber Bulletin, Australia was not listed as a major exporter.
![]()
![]()
![]()