![]()
![]()
![]()
Table 61 through 64 show consumption, production, imports and exports of other fibre pulp in the Asia-Pacific region from 1962 to 1992. Although it has increased, the trade in other fibre pulp is still very limited, most countries consume all of their production domestically. Prior to the mid-1970s, other fibre pulp represented only about 6% of the world production of pulp for paper and board, and slightly more than half of that was produced and consumed in the Asia-Pacific region. Since the late 1970s, production and consumption had risen sharply, especially in that region. By 1992, about 16 million metric tons, 11% of the world production/consumption of pulp, was pulp of non-wood fibres. Of this amount, a substantial part was made and used by China (12.6 million metric tons), India (1 million) and Latin America (0.7 million). The total production in the region in 1992 was 14.2 million metric tons, 87% of global production.
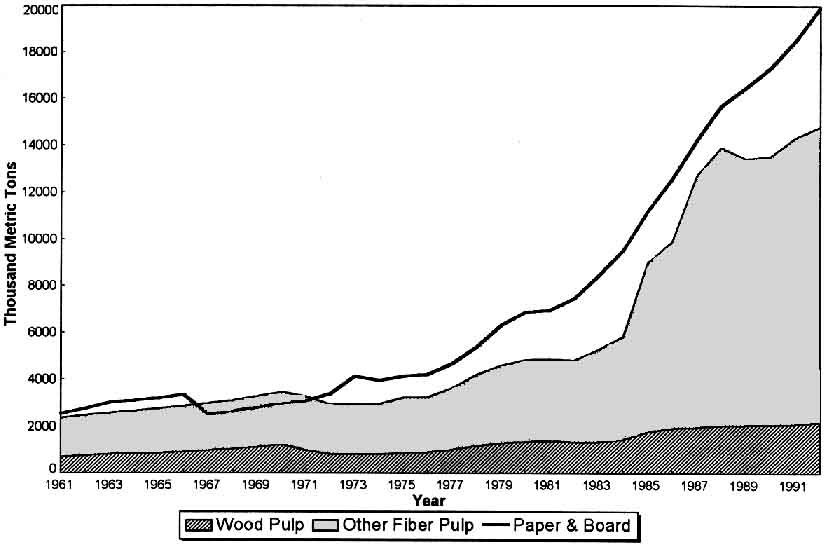
Figure 12. Production of wood pulp, other fibre pulp, and paper & board in China, 1961 - 1992.
Other fibre production soared in China during the period of 1984 to 1988, in response to fast increases in paper & board consumption, meanwhile, wood pulp production also increased but not as much as other fibre pulp, due to the country's limited wood resources (Figure 12). The proportion of other fibre pulp had been stable before 1982 at 72%, but increased significantly since then and reached 85% by 1992.
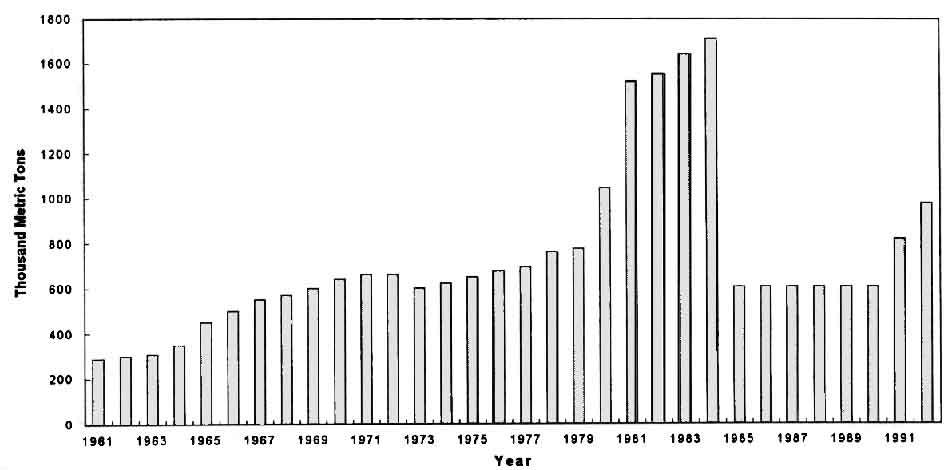
India has been the second largest producer and consumer of other fibre pulp in the region. Its production peaked at 1.7 million metric tons in 1984 and then dropped sharply in 1985 according to FAO data, as shown in Figure 13.
Figure 13. Production of other fibre pulp in India, 1961 - 1992.
Table 61. Consumption of other fibre pulp, in thousand metric tons. 1962-1992.
|
Country |
1962 |
1972 |
1982 |
1992 |
|
Australia |
3 |
0 |
10 |
9 |
|
Bangladesh |
0 |
15 |
51 |
33 |
|
Bhutan |
|
|
|
|
|
Cambodia |
2 |
0 |
0 |
0 |
|
China |
1695 |
2098 |
3456 |
12599 |
|
Fiji |
|
|
|
|
|
French Polynesia |
|
|
|
|
|
Hong Kong |
|
|
|
|
|
India |
300 |
658 |
1554 |
985 |
|
Indonesia |
8 |
22 |
122 |
85 |
|
Japan |
38 |
31 |
21 |
32 |
|
Korea Dem People's Rep |
3 |
35 |
50 |
50 |
|
Korea Rep |
0 |
14 |
31 |
3 |
|
Laos |
|
|
|
|
|
Macau |
|
|
|
|
|
Malaysia |
0 |
2 |
1 |
1 |
|
Myanmar |
0 |
10 |
13 |
2 |
|
Nepal |
8 |
15 |
15 |
15 |
|
New Caledonia |
|
|
|
|
|
New Zealand |
|
|
|
|
|
Pakistan |
20 |
50 |
58 |
146 |
|
Papua New Guinea |
|
|
|
|
|
Philippines |
15 |
9 |
45 |
8 |
|
Samoa |
|
|
|
|
|
Singapore |
|
|
|
|
|
Solomon Islands |
|
|
|
|
|
Sri Lanka |
2 |
5 |
10 |
3 |
|
Thailand |
2 |
43 |
46 |
250 |
|
Tonga |
|
|
|
|
|
Vanuatu |
|
|
|
|
|
Viet Nam |
0 |
7 |
13 |
72 |
|
Asia Pacific |
2096 |
3014 |
5496 |
14293 |
|
World |
4033 |
5782 |
8073 |
16018 |
|
Share |
52% |
52% |
68% |
89% |
Table 62. Production of other fibre pulp, in thousand metric tons, 1962-1992.
|
Country |
1962 |
1972 |
1982 |
1992 |
|
Australia |
3 |
0 |
9 |
9 |
|
Bangladesh |
0 |
15 |
51 |
33 |
|
Bhutan |
|
|
|
|
|
Cambodia |
2 |
0 |
0 |
0 |
|
China |
1705 |
2110 |
3466 |
12603 |
|
Fiji |
|
|
|
|
|
French Polynesia |
|
|
|
|
|
Hong Kong |
|
|
|
|
|
India |
300 |
660 |
1553 |
975 |
|
Indonesia |
8 |
22 |
89 |
84 |
|
Japan |
38 |
27 |
10 |
4 |
|
Korea Dem People's Rep |
3 |
35 |
50 |
50 |
|
Korea Rep |
0 |
4 |
30 |
0 |
|
Laos |
|
|
|
|
|
Macau |
|
|
|
|
|
Malaysia |
0 |
1 |
1 |
1 |
|
Myanmar |
0 |
10 |
13 |
2 |
|
Nepal |
8 |
15 |
15 |
15 |
|
New Caledonia |
|
|
|
|
|
New Zealand |
|
|
|
|
|
Pakistan |
20 |
50 |
56 |
145 |
|
Papua New Guinea |
|
|
|
|
|
Philippines |
15 |
10 |
51 |
27 |
|
Samoa |
|
|
|
|
|
Singapore |
|
|
|
|
|
Solomon Islands |
|
|
|
|
|
Sri Lanka |
2 |
5 |
10 |
3 |
|
Thailand |
2 |
27 |
43 |
190 |
|
Tonga |
|
|
|
|
|
Vanuatu |
|
|
|
|
|
Viet Nam |
0 |
7 |
13 |
72 |
|
Asia Pacific |
2106 |
2998 |
5460 |
14213 |
|
World |
4043 |
5811 |
7987 |
16285 |
|
Share |
52% |
52% |
68% |
87% |
Table 63. Imports of other fibre pulp, in thousand metric tons, 1962-1992.
|
Country |
1962 |
1972 |
1982 |
1992 |
|
Australia |
0 |
0 |
1 |
0 |
|
Bangladesh |
|
|
|
|
|
Bhutan |
|
|
|
|
|
Cambodia |
|
|
|
|
|
China |
0 |
1 |
3 |
6 |
|
Fiji |
|
|
|
|
|
French Polynesia |
|
|
|
|
|
Hong Kong |
|
|
|
|
|
India |
0 |
0 |
1 |
10 |
|
Indonesia |
0 |
0 |
33 |
1 |
|
Japan |
0 |
4 |
11 |
28 |
|
Korea Dem People's Rep |
|
|
|
|
|
Korea Rep |
0 |
10 |
1 |
3 |
|
Laos |
|
|
|
|
|
Macau |
|
|
|
|
|
Malaysia |
0 |
1 |
0 |
0 |
|
Myanmar |
|
|
|
|
|
Nepal |
|
|
|
|
|
New Caledonia |
|
|
|
|
|
New Zealand |
|
|
|
|
|
Pakistan |
0 |
0 |
2 |
1 |
|
Papua New Guinea |
|
|
|
|
|
Philippines |
0 |
0 |
0 |
1 |
|
Samoa |
|
|
|
|
|
Singapore |
|
|
|
|
|
Solomon Islands |
|
|
|
|
|
Sri Lanka |
|
|
|
|
|
Thailand |
0 |
16 |
3 |
60 |
|
Tonga |
|
|
|
|
|
Vanuatu |
|
|
|
|
|
Viet Nam |
|
|
|
|
|
Asia Pacific |
0 |
32 |
55 |
110 |
|
World |
0 |
147 |
241 |
276 |
|
Share |
|
22% |
23% |
40% |
Table 64. Exports of other fibre pulp, in thousand metric tons. 1962-1992.
|
Country |
1962 |
1972 |
1982 |
1992 |
|
Australia |
|
|
|
|
|
Bangladesh |
|
|
|
|
|
Bhutan |
|
|
|
|
|
Cambodia |
|
|
|
|
|
China |
10 |
13 |
13 |
10 |
|
Fiji |
|
|
|
|
|
French Polynesia |
|
|
|
|
|
Hong Kong |
|
|
|
|
|
India |
0 |
2 |
0 |
0 |
|
Indonesia |
|
|
|
|
|
Japan |
|
|
|
|
|
Korea Dem People's Rep |
|
|
|
|
|
Korea Rep |
|
|
|
|
|
Laos |
|
|
|
|
|
Macau |
|
|
|
|
|
Malaysia |
|
|
|
|
|
Myanmar |
|
|
|
|
|
Nepal |
|
|
|
|
|
New Caledonia |
|
|
|
|
|
New Zealand |
|
|
|
|
|
Pakistan |
|
|
|
|
|
Papua New Guinea |
|
|
|
|
|
Philippines |
0 |
1 |
6 |
20 |
|
Samoa |
|
|
|
|
|
Singapore |
|
|
|
|
|
Solomon Islands |
|
|
|
|
|
Sri Lanka |
|
|
|
|
|
Thailand |
|
|
|
|
|
Tonga |
|
|
|
|
|
Vanuatu |
|
|
|
|
|
Viet Nam |
|
|
|
|
|
Asia Pacific |
10 |
16 |
19 |
30 |
|
World |
10 |
176 |
155 |
188 |
|
Share |
100% |
9% |
12% |
16% |
![]()
![]()
![]()